Nifty 50 Update | Technical Levels MappedThere are two chart of Nifty50.
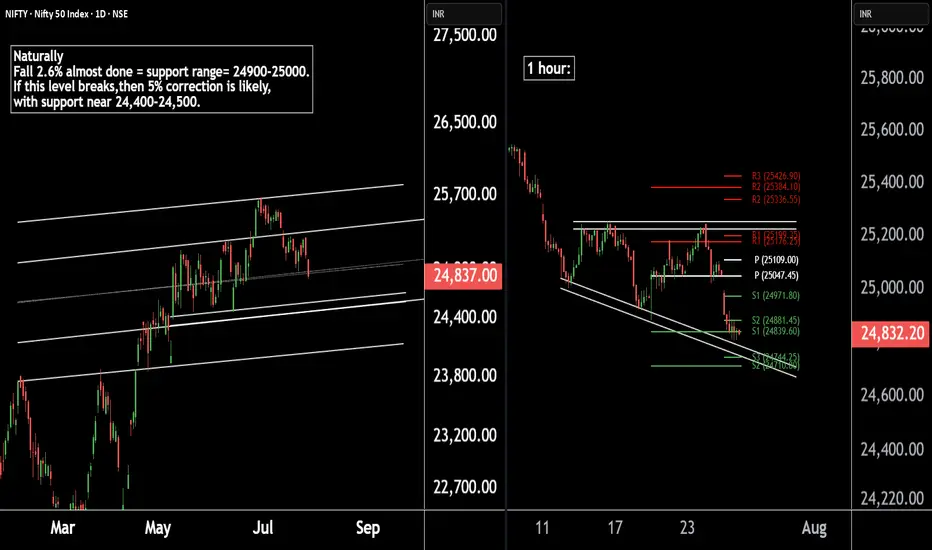
Nifty 50 is trading within a well-defined parallel channel. As part of its natural corrective phase, a potential decline of around 5% cannot be ruled out, with key support anticipated near the 24,400–24,500 zone.
Nifty is forming a broadening wedge pattern on the 1-hour timeframe, with crucial support around 24,740. Additionally, both the weekly and monthly pivot supports are aligned in the 24,740–24,710 zone, reinforcing the significance of this level.
If this level sustain then we may see higher prices in Nifty50.
Thank You !!
NIFTY trade ideas
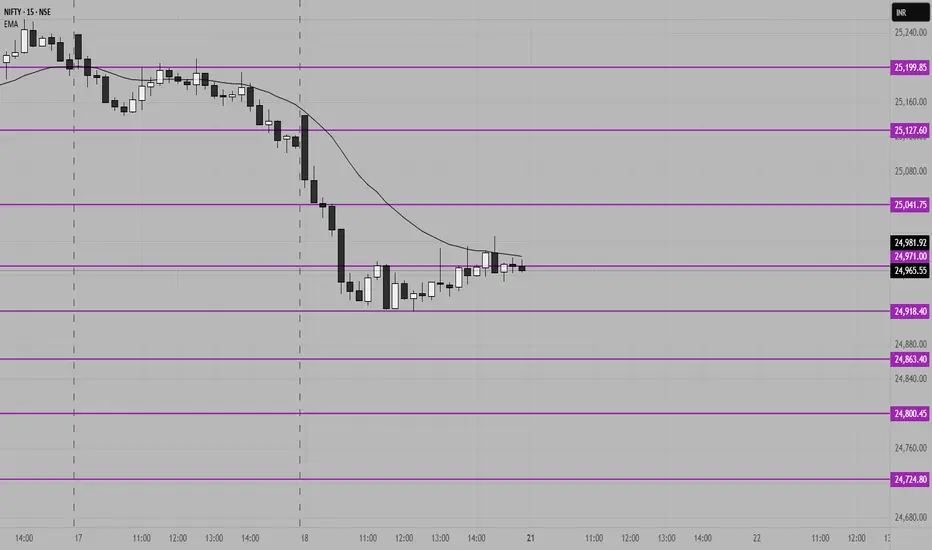
Nifty key Support and resistance levels for 21st July 2025NIFTY Key Support & Resistance for July 21st
Chart Overview:
NIFTY might consolidate after a sharp fall, currently trading around the 24,918–24,965 zone on the 15-minute chart. The price is hovering below the EMA, indicating weak momentum and hesitation in recovery.
Key Levels:
Major Resistance:
25,200 – Strong resistance zone; multiple rejections expected if tested. Watch for possible reversals or fake breakouts near this level.
Other Resistances:
* 25,127
* 25,041
Immediate Supports:
* 24,918
* 24,863
* 24,724
Outlook for July 21st:
* Failure to sustain above 24,970 could invite fresh selling toward 24,724.
* Range-bound action likely between 25,041 and 24,863 unless a strong breakout occurs.
---
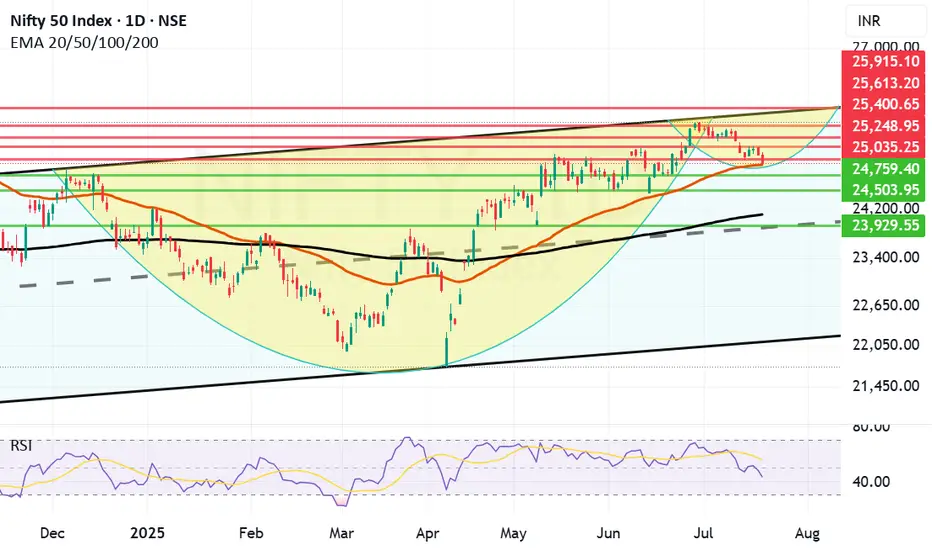
Can Reliance and Banks turn Nifty around? do or die Monday. Nifty as of now has taken support at Mother line in daily chart. As expected in my Yesterday's message. So Hopefully if Big Banks Results are in line tomorrow we might see Nifty going upwards from Monday.
Mota Bhai just announced the results. EBITDA is slightly less than expected but Net Profit and Revenue is much better than Market expectation. In my view market should react positively to this result.
Supports For Nifty remain at 24932 (Mother line), 24759, 24503. As indicated earlier if we get a closing below 24503 we may see a Fall towards 24106 or 23929 (In unlikely circumstances).
Nifty Resistances remain at: 25035, 25248, 25400 and 25613 (Channel top Resistance).
Results for tomorrow
HDFC BANK
ICICIBANK
AUSMALL BANK
RBL BANK
UNION BANK
YES BANK
CENTR BANK
PUNJA BANK
CENTR BANK
So it seems like a Do or Die Monday on cards. Shadow of the candle looks neutral as of now.
Disclaimer: The above information is provided for educational purpose, analysis and paper trading only. Please don't treat this as a buy or sell recommendation for the stock or index. The Techno-Funda analysis is based on data that is more than 3 months old. Supports and Resistances are determined by historic past peaks and Valley in the chart. Many other indicators and patterns like EMA, RSI, MACD, Volumes, Fibonacci, parallel channel etc. use historic data which is 3 months or older cyclical points. There is no guarantee they will work in future as markets are highly volatile and swings in prices are also due to macro and micro factors based on actions taken by the company as well as region and global events. Equity investment is subject to risks. I or my clients or family members might have positions in the stocks that we mention in our educational posts. We will not be responsible for any Profit or loss that may occur due to any financial decision taken based on any data provided in this message. Do consult your investment advisor before taking any financial decisions. Stop losses should be an important part of any investment in equity.
#Nifty - Pivot Point: 25031.63Date: 18-07-2025
#Nifty Current Price: 25025
Pivot Point: 25031.63 Support: 24794.06 Resistance: 25270.32
#NiftyUpside Targets:
Target 1: 25376.92
Target 2: 25483.53
Target 3: 25652.99
Target 4: 25822.45
#NiftyDownside Targets:
Target 1: 24686.89
Target 2: 24579.73
Target 3: 24410.26
Target 4: 24240.80
#TradingView #Stocks #Equities #StockMarket #Investing #Trading #Nifty
#TechnicalAnalysis #StockCharts #Finance

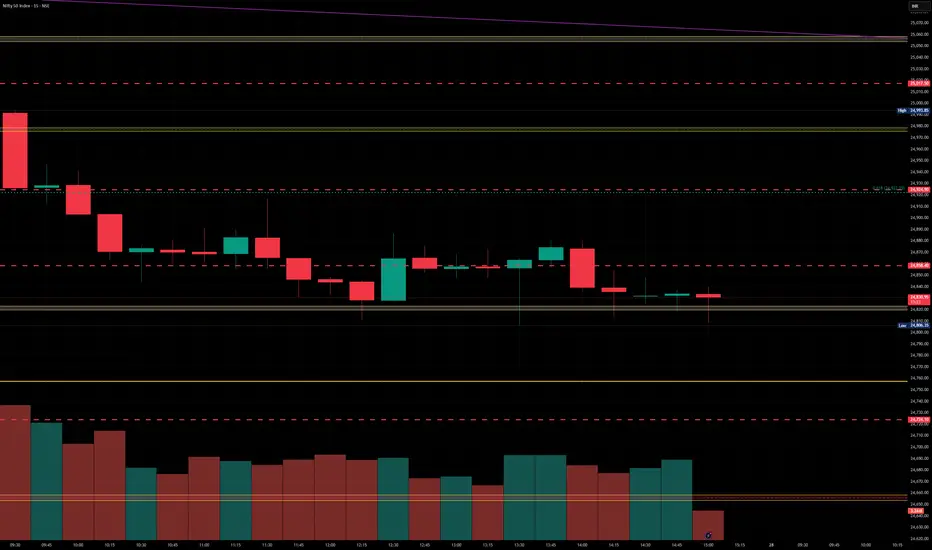
Nifty levels - July 25, 2025Nifty support and resistance levels are valuable tools for making informed trading decisions, specifically when combined with the analysis of 5-minute timeframe candlesticks and VWAP. By closely monitoring these levels and observing the price movements within this timeframe, traders can enhance the accuracy of their entry and exit points. It is important to bear in mind that support and resistance levels are not fixed, and they can change over time as market conditions evolve.
The dashed lines on the chart indicate the reaction levels, serving as additional points of significance to consider. Furthermore, take note of the response at the levels of the High, Low, and Close values from the day prior.
We hope you find this information beneficial in your trading endeavors.
* If you found the idea appealing, kindly tap the Boost icon located below the chart. We encourage you to share your thoughts and comments regarding it.
Wishing you success in your trading activities!
Nifty levels - Jul 23, 2025Nifty support and resistance levels are valuable tools for making informed trading decisions, specifically when combined with the analysis of 5-minute timeframe candlesticks and VWAP. By closely monitoring these levels and observing the price movements within this timeframe, traders can enhance the accuracy of their entry and exit points. It is important to bear in mind that support and resistance levels are not fixed, and they can change over time as market conditions evolve.
The dashed lines on the chart indicate the reaction levels, serving as additional points of significance to consider. Furthermore, take note of the response at the levels of the High, Low, and Close values from the day prior.
We hope you find this information beneficial in your trading endeavors.
* If you found the idea appealing, kindly tap the Boost icon located below the chart. We encourage you to share your thoughts and comments regarding it.
Wishing you success in your trading activities!

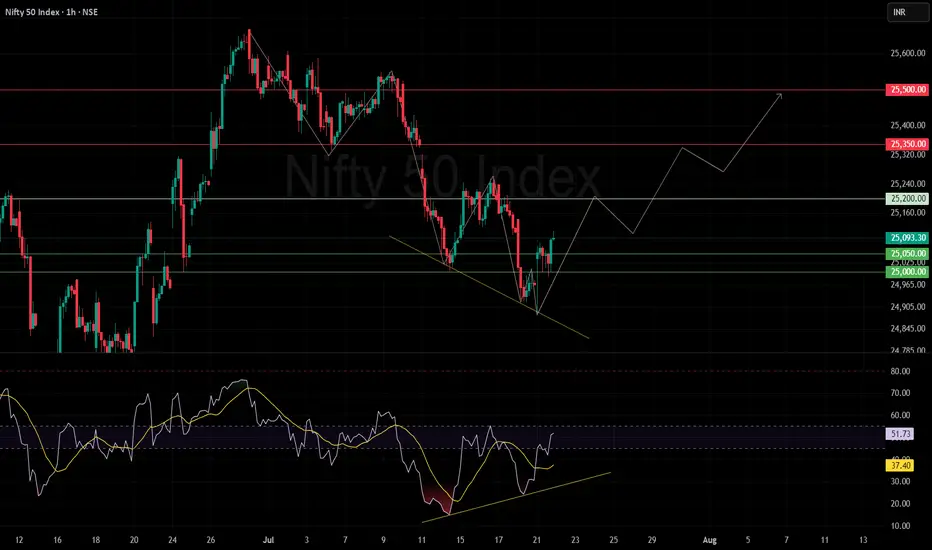
Nifty bounced with a liquidity grab.Market Action Overview
Breakdown Below 25,000: The Nifty 50 index recently dipped below the psychologically significant level of 25,000, a move that likely triggered stop-loss orders and drew out short-sellers.
Liquidity Grab: This action can be interpreted as a classic "liquidity grab," where the market briefly breaks a key support, absorbs sell-side liquidity, and shakes out weak hands before reversing direction.
Quick Rebound: Following the breakdown, the index swiftly reclaimed the 25,000 mark, signaling a strong buy-side response and potential exhaustion of selling pressure.
Recent Trend: The index recently rebounded from a downward phase, forming a lower low before bouncing from a support zone.
Support Levels: Key supports are visible at 25,000 and 25,050.
Resistance Levels: Notable overhead resistances are at 25,200, 25,350, and 25,500.
Potential Path & Projections
The indicated projection outlines a potential upward journey:
A base formation near current levels.
Possible upward move toward 25,200.
If sustained, a further rally toward the resistance levels of 25,350 and then 25,500.
The chart suggests a zig-zag correction/consolidation before each resistance break, implying healthy pullbacks amid the upward path.
Trendlines & Patterns
Falling Wedge Breakout: The downtrend appears to be capped by a descending trendline which has just been breached to the upside—a potentially bullish signal.
Short-Term Recovery: An optimistic bias is presented by the "inverted V" or "W-shaped" price action, hinting at accumulating strength.
RSI Pattern: The RSI is climbing from its recent lows and maintains an upward trendline also showing positive divergence with price, supporting a bullish outlook.
Momentum: If the RSI sustains above 50, momentum could stay positive; a move above 60 might trigger increased buying.
Key Takeaways
Short-Term Bias: Bullish, given breakout patterns and the upward RSI momentum.
Critical Levels to Watch:
Support: 25,000
Resistance: 25,200, 25,350, 25,500
Confirmation Needed: Watch for price acceptance above 25,200 for further bullish momentum. Failure to hold above 25,000 may invalidate the positive setup.
Conclusion
Indicators point to a potential short-term recovery for the Nifty 50, provided support holds and RSI maintains or extends its upward trajectory. Resistance breakouts above 25,200 could open the door to higher targets, but as always, traders should monitor for reversals near mapped resistance zones.
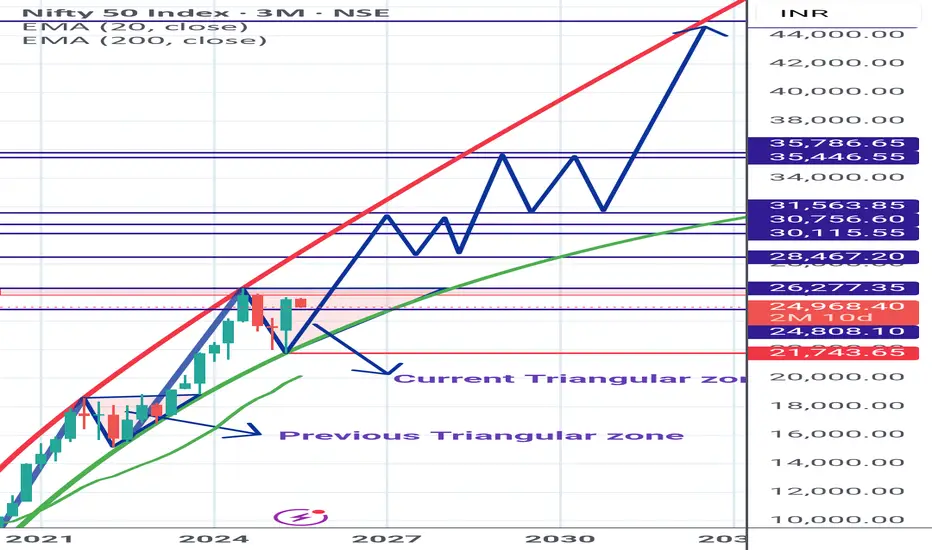
Nifty Spot Longterm View *Nifty Spot* Chart for members Reference.
Currently trading in Parabolic trend and inside Triangular zone.
On closing above the triangular zone, big rally to Begin.
Shared *My Study* based on chart pattern.
Kindly do your analysis from your side too.
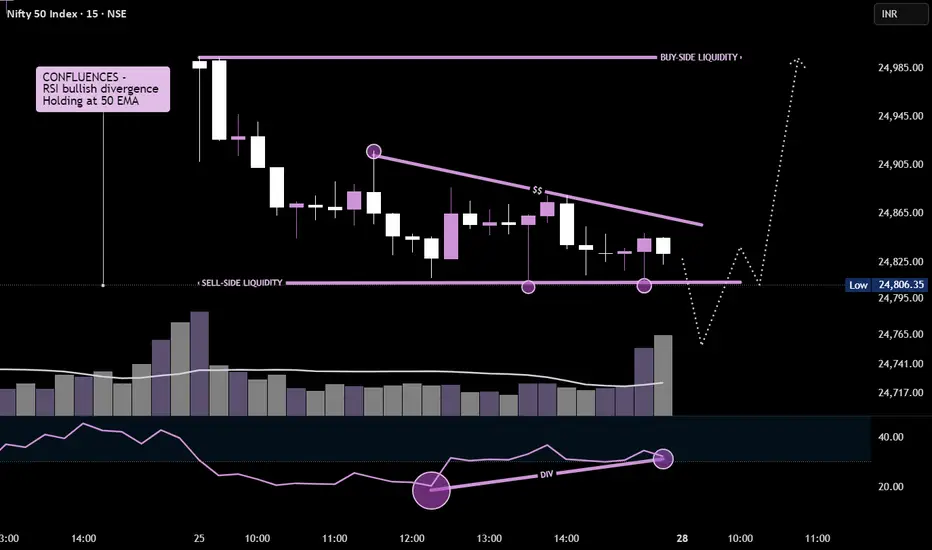
NIFTY50 - 15MIN Potential reversal brewingPrice is forming a falling wedge pattern with clear bullish RSI divergence, signaling potential reversal.
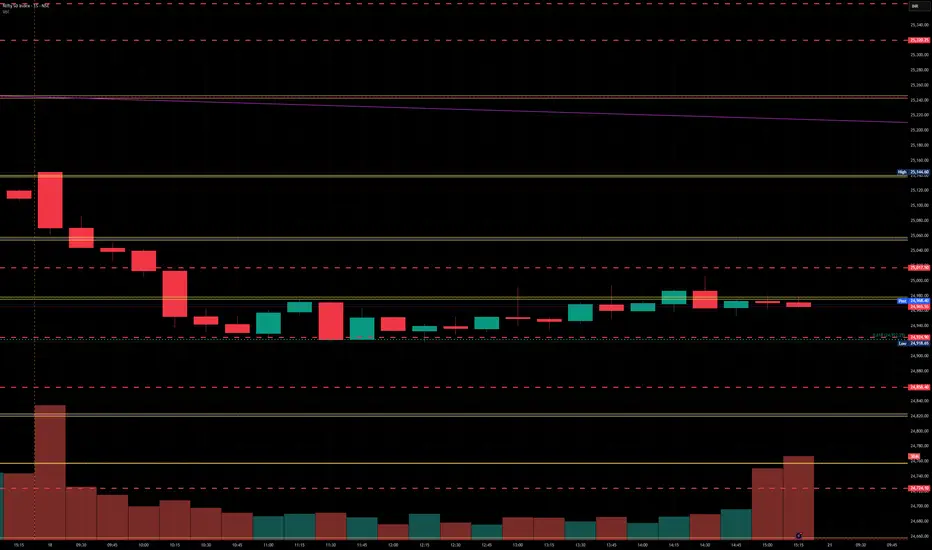
Nifty levels - Jul 28, 2025Nifty support and resistance levels are valuable tools for making informed trading decisions, specifically when combined with the analysis of 5-minute timeframe candlesticks and VWAP. By closely monitoring these levels and observing the price movements within this timeframe, traders can enhance the accuracy of their entry and exit points. It is important to bear in mind that support and resistance levels are not fixed, and they can change over time as market conditions evolve.
The dashed lines on the chart indicate the reaction levels, serving as additional points of significance to consider. Furthermore, take note of the response at the levels of the High, Low, and Close values from the day prior.
We hope you find this information beneficial in your trading endeavors.
* If you found the idea appealing, kindly tap the Boost icon located below the chart. We encourage you to share your thoughts and comments regarding it.
Wishing you success in your trading activities!
Nifty levels - Jul 24, 2025Nifty support and resistance levels are valuable tools for making informed trading decisions, specifically when combined with the analysis of 5-minute timeframe candlesticks and VWAP. By closely monitoring these levels and observing the price movements within this timeframe, traders can enhance the accuracy of their entry and exit points. It is important to bear in mind that support and resistance levels are not fixed, and they can change over time as market conditions evolve.
The dashed lines on the chart indicate the reaction levels, serving as additional points of significance to consider. Furthermore, take note of the response at the levels of the High, Low, and Close values from the day prior.
We hope you find this information beneficial in your trading endeavors.
* If you found the idea appealing, kindly tap the Boost icon located below the chart. We encourage you to share your thoughts and comments regarding it.
Wishing you success in your trading activities!
Nifty has broken Hoz support, Trendline & Rising Triangle.Nifty has broken Hoz support, Trendline & Rising Triangle. It may fall to liquidity support level of 24400, before resuming its upward trajectory.

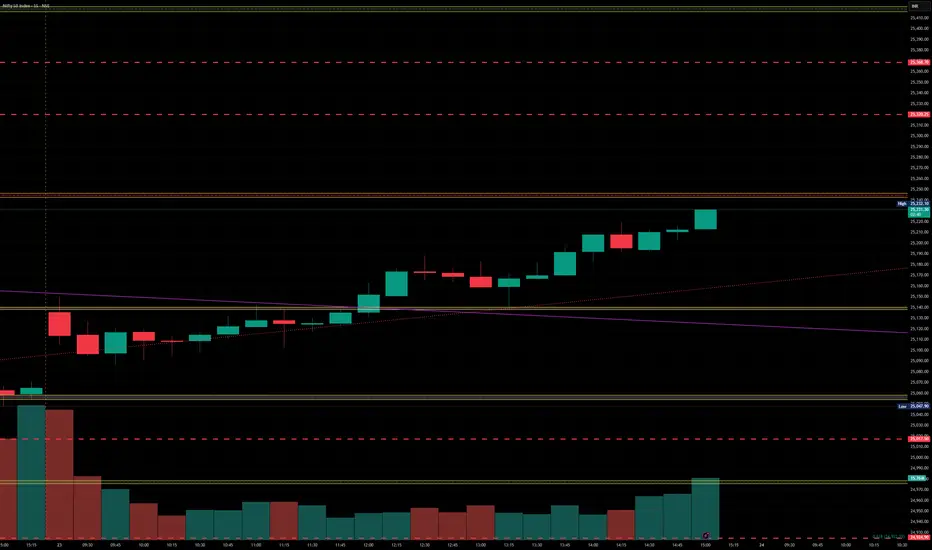
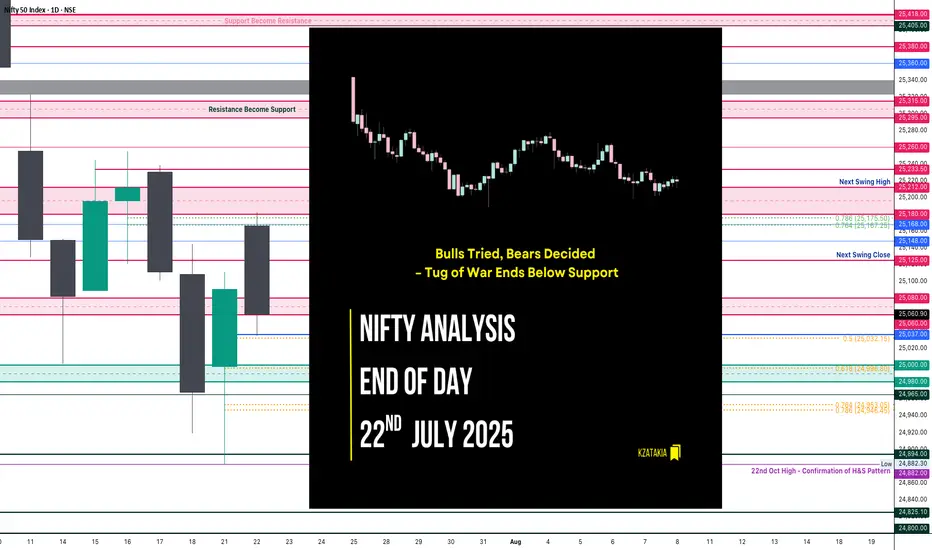
Nifty Analysis EOD – July 22, 2025 – Tuesday🟢 Nifty Analysis EOD – July 22, 2025 – Tuesday 🔴
"Bulls Tried, Bears Decided – Tug of War Ends Below Support"
Nifty opened with an 88-point gap-up, continuing the bullish sentiment, right at the resistance zone of 25,180 ~ 25,212. However, the market opened at the high (OH) and quickly slipped around 100 points to form the Initial Balance (IB). After a brief bounce back to the mean, it faced resistance, leading to a breakdown of IB and further losses of 77 points.
A supportive bounce emerged near 25,060 ~ 25,080, but the price was pushed down again by PDH + VWAP + R1. The day closed below PDC and under the support zone at 25,065, showing bearish dominance despite a volatile tug-of-war between bulls and bears.
Today’s low tested the 0.5 Fibonacci retracement level (from yesterday’s low to today’s high). If this is truly a retracement, 25K must hold in upcoming sessions, and bulls will need to reclaim 25,200 to regain their grip.
🕯 5 Min Time Frame Chart with Intraday Levels
🕯 Daily Time Frame Chart with Intraday Levels
📊 Daily Candle Breakdown
Open: 25,166.65
High: 25,182.00
Low: 25,035.55
Close: 25,060.90
Change: −29.80 (−0.12%)
Candle Structure:
Real Body: Red (−105.75 pts) → Decent bearish body
Upper Wick: 15.35 pts → Small
Lower Wick: 25.35 pts → Moderate
Interpretation:
Price opened strong but faced selling near 25,180, leading to a steady drop throughout the session. The lower wick shows some buying attempt near 25,035, but the close below open signals bears dominated.
Candle Type:
Bearish candle with moderate lower wick – resembles a Bearish Engulfing setup after a green candle, suggesting profit-booking or fresh selling.
Key Insight:
Sellers defending 25,180–25,200 firmly
Holding above 25,030–25,050 is critical; breaking this could retest 24,950–25,000
Bulls must reclaim 25,120–25,150 for momentum revival
🛡 5 Min Intraday Chart
⚔️ Gladiator Strategy Update
ATR: 182.32
IB Range: 92.6 → Medium
Market Structure: Balanced
Trades Triggered:
10:45 AM – Short Trade → Trailing SL Hit (1:0.8)
12:45 PM – Long Trade → SL Hit
📌 Support & Resistance Levels
Resistance:
25,080 ~ 25,060
25,125
25,168
25,180 ~ 25,212
Support:
25,037
25,000 ~ 24,980
24,965
24,894 ~ 24,882
24,825
24,800 ~ 24,768
🧠 Final Thoughts:
"Markets often dance between zones of power — where bulls flex and bears press. It's not chaos, it's the choreography of sentiment."
The 25,000–25,212 zone continues to be the battlefield. Let’s see who seizes the upper hand tomorrow.
✏️ Disclaimer:
This is just my personal viewpoint. Always consult your financial advisor before taking any action.
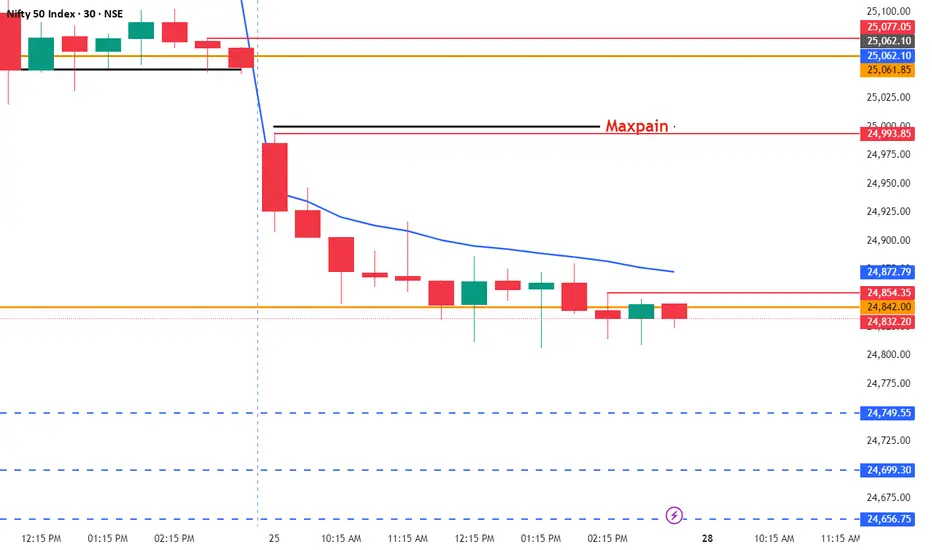
Monday Gap down ProbabilityAs market sentiments are negative where smallcap and midcap tumbles possible gap down after weekend , positive bias after breaking 25062 level till then market showing bearish movement
Nifty levels - Jul 21, 2025Nifty support and resistance levels are valuable tools for making informed trading decisions, specifically when combined with the analysis of 5-minute timeframe candlesticks and VWAP. By closely monitoring these levels and observing the price movements within this timeframe, traders can enhance the accuracy of their entry and exit points. It is important to bear in mind that support and resistance levels are not fixed, and they can change over time as market conditions evolve.
The dashed lines on the chart indicate the reaction levels, serving as additional points of significance to consider. Furthermore, take note of the response at the levels of the High, Low, and Close values from the day prior.
We hope you find this information beneficial in your trading endeavors.
* If you found the idea appealing, kindly tap the Boost icon located below the chart. We encourage you to share your thoughts and comments regarding it.
Wishing you success in your trading activities!
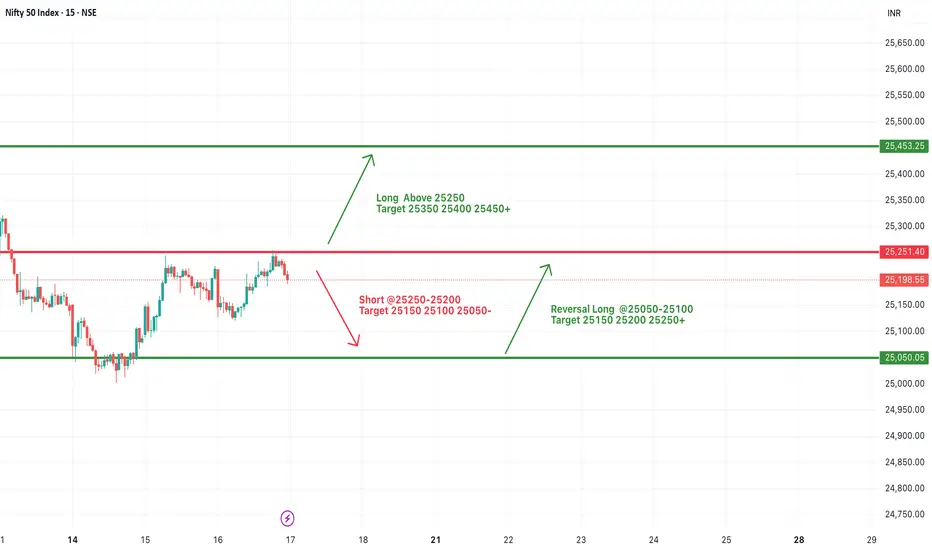
#NIFTY Intraday Support and Resistance Levels - 17/07/2025Opening Expectation: Slight Gap-Up Around 25200
Nifty is likely to open slightly gap-up near the 25200 level, showing early signs of strength. If the index manages to sustain above the 25250 level, we may see a continuation of the upward momentum with targets around 25350, 25400, and 25450+. This zone marks the upper resistance, and a breakout with strong volume could push prices into a bullish trend for the session.
On the other hand, if Nifty faces rejection around 25250–25200 and begins to slide, a short opportunity opens up with downside targets at 25150, 25100, and 25050. Sustained weakness below these levels could intensify selling pressure. However, in case the index reverses and bounces from the 25050–25100 zone, a quick intraday long trade can be considered toward 25150, 25200, and 25250+.
Today’s bias remains slightly positive, but the session may remain volatile between key levels. Traders should focus on price action around the 25250 resistance and use trailing stop losses with strict risk control.
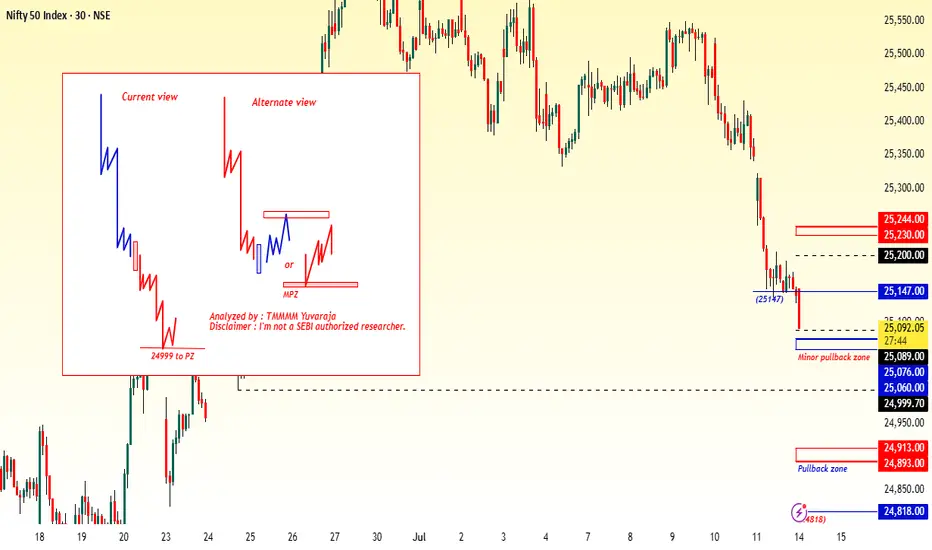
#Nifty directions and levels for July 14th:Good morning, Friends! 🌞
Here are the market directions and levels for July 14th:
The global market continues to maintain a moderately bearish sentiment, and our local market is also reflecting the same tone.
So, what can we expect today?
Current View:
Structurally, there has been strong selling pressure. So, if the market consolidates or breaks the support with a solid candle, we can expect the correction to continue.
Alternate View:
On the other hand, if the market finds support near the immediate support level or if the initial move takes a pullback, we can expect a maximum 38% to 50% pullback in the minor swing.
Even if that happens, the trend may still remain bearish in the lower time frame. So, if the market starts to reject around the 38% Fibonacci level on the upside, we can expect the downtrend to resume.
In simple terms, if a pullback occurs, we may see a range-bound market.
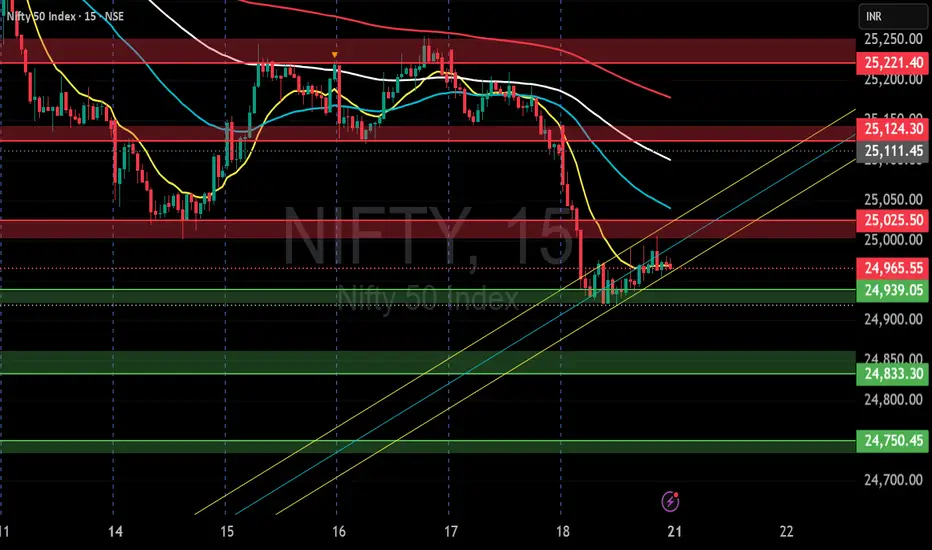
NIFTY S/R for 21/7/25Support and Resistance Levels:
Support Levels: These are price points (green line/shade) where a downward trend may be halted due to a concentration of buying interest. Imagine them as a safety net where buyers step in, preventing further decline.
Resistance Levels: Conversely, resistance levels (red line/shade) are where upward trends might stall due to increased selling interest. They act like a ceiling where sellers come in to push prices down.
Breakouts:
Bullish Breakout: When the price moves above resistance, it often indicates strong buying interest and the potential for a continued uptrend. Traders may view this as a signal to buy or hold.
Bearish Breakout: When the price falls below support, it can signal strong selling interest and the potential for a continued downtrend. Traders might see this as a cue to sell or avoid buying.
MA Ribbon (EMA 20, EMA 50, EMA 100, EMA 200) :
Above EMA: If the stock price is above the EMA, it suggests a potential uptrend or bullish momentum.
Below EMA: If the stock price is below the EMA, it indicates a potential downtrend or bearish momentum.
Trendline: A trendline is a straight line drawn on a chart to represent the general direction of a data point set.
Uptrend Line: Drawn by connecting the lows in an upward trend. Indicates that the price is moving higher over time. Acts as a support level, where prices tend to bounce upward.
Downtrend Line: Drawn by connecting the highs in a downward trend. Indicates that the price is moving lower over time. It acts as a resistance level, where prices tend to drop.
Disclaimer:
I am not a SEBI registered. The information provided here is for learning purposes only and should not be interpreted as financial advice. Consider the broader market context and consult with a qualified financial advisor before making investment decisions.
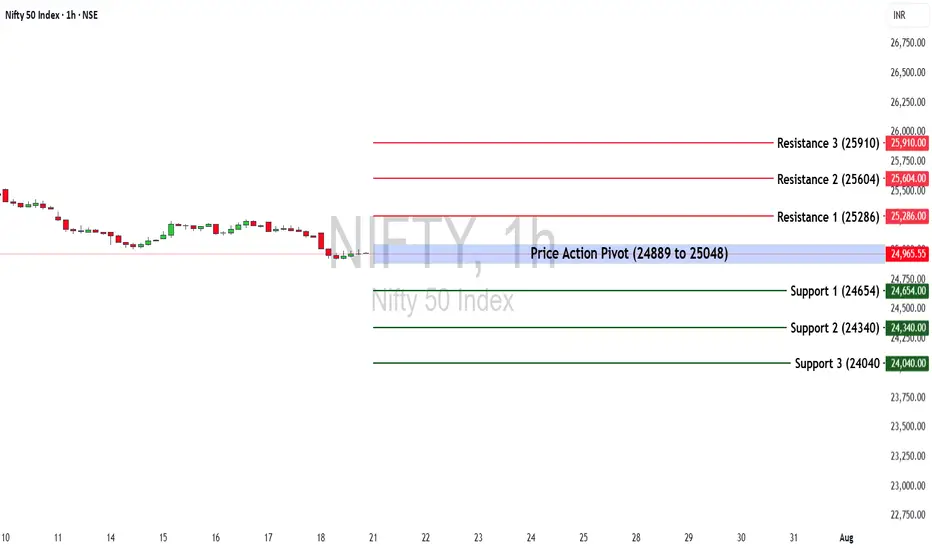
Nifty 50 at a Turning Point? Key Levels & Market Outlook AheadThe Nifty 50 ended the week at 25,149.85, posting a loss of -1.22%.
🔹 Key Levels for the Upcoming Week
📌 Price Action Pivot Zone:
24,889 to 25,048 – This is a crucial range to monitor for potential trend reversals or continuation. A breakout or breakdown from this zone can set the tone for the week.
🔻 Support Levels:
S1: 24,654
S2: 24,340
S3: 24,040
🔺 Resistance Levels:
R1: 25,286
R2: 25,604
R3: 25,910
📈 Market Outlook
✅ Bullish Scenario:
A sustained move above 25,048 (top of the pivot zone) may invite buying interest. If momentum continues, the index could test R1 (25,286) and possibly extend towards R2 (25,604) and R3 (25,910).
❌ Bearish Scenario:
Failure to hold the pivot zone and a breakdown below 24,889 could trigger further downside. The index may slide towards S1 (24,654) and deeper supports at S2 (24,340) and S3 (24,040).
Disclaimer: lnkd.in
Nifty Closes Below 25,000 — What Lies Ahead?The Indian market's recent uptrend appears to be losing momentum, as the benchmark Nifty index extended its decline for the third consecutive week, ending just below the important 25,000 mark.
This pullback has been largely driven by weakness in the Financial and IT sectors, with major players like NSE:TCS , NSE:HCLTECH , and NSE:AXISBANK posting disappointing earnings.
From a technical perspective, the index is now approaching a key support zone near 24,900. A decisive break below this level could open the door for a further slide towards 24,500.
Open Interest (OI) data reinforces this view, with the 25,000–24,900 zone seeing the highest put writing, marking it as an immediate support area. On the upside, strong call writing at 25,100 and 25,200 on Friday suggests these levels will act as immediate resistance.
Given the current structure, the outlook for the coming week remains neutral to bearish.
Traders are advised to stay cautious, manage risk effectively, and keep a close watch on these crucial levels.

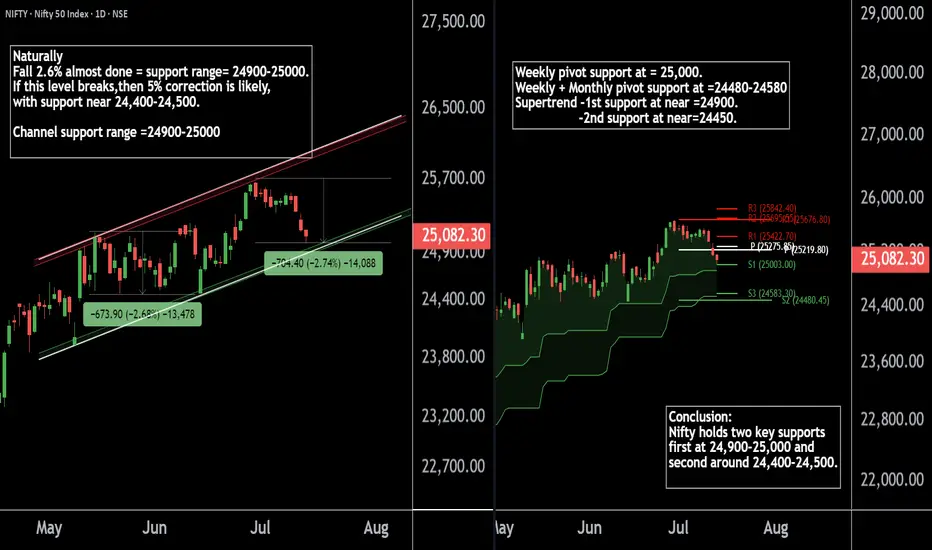
Nifty50's Key Level !! Keep an eye on these levels.Here are two Nifty charts, both on the daily timeframe.
Current Correction:
Nifty has naturally corrected by 2.7%, currently trading in the 24,900-25,000 range.
Weekly Pivot:
The weekly pivot support is positioned at 25,000, providing immediate support.
Support Levels:
First Support: 24,900-25,000 zone.
Second Support: If this level breaks, Nifty may see a 5% correction, with the next support around 24,400-24,500.
If this level sustain we may see higher prices in Nifty 50.
Thank You !!
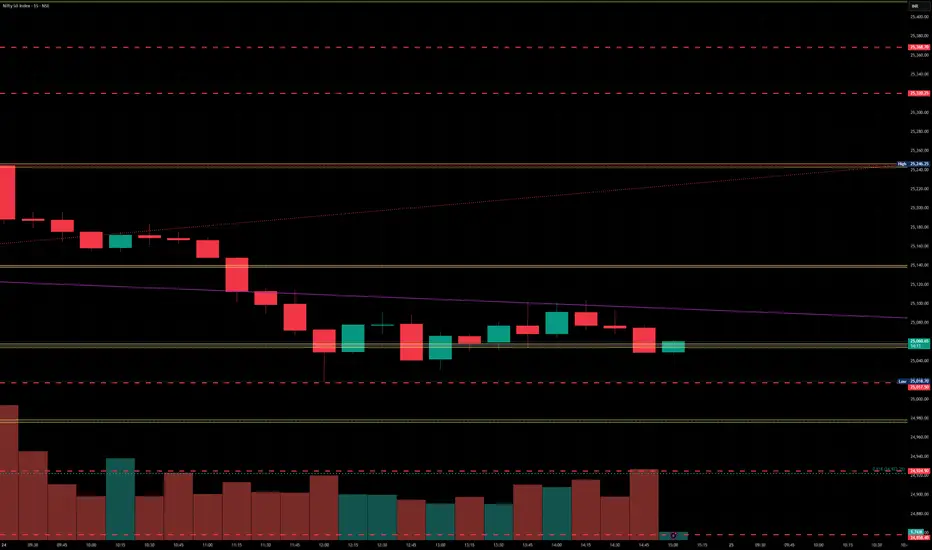
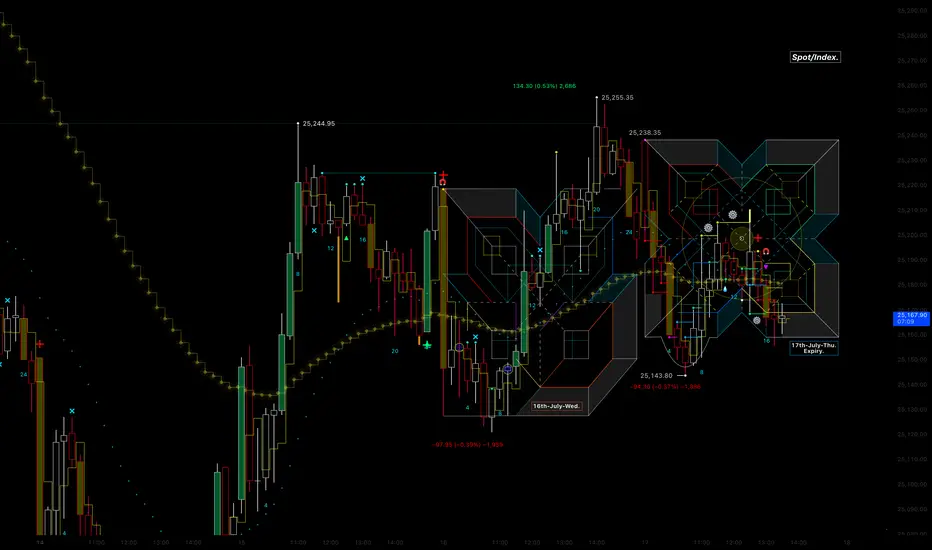
17th-July-Thu. Expiry day projection Hello Everyone
This is the projection Grid for the Expiry day Index chart/Spot (not futures)
as you can see the day started with morning drive for hour and half
good price action ,yesterday i got steamrolled and stop hit
then after 1/4 day @10:45 it put in the low and we played the reversal back up
note there was a fake news about Trumph firing Jerome powel FeD chair
turned out to be fake however needed a catalyst to take all the stops on daily timeframe
and pick it back up in to fairvalue after they take everybody out with fake news
its the game they like to play as "they" want to buy low and sell high.
little late to publish
enjoy the grid and safety first
NIFTY 24740: Smart Money Signals Bearish Move IncomingThe directional bias is clear – bearish – and I'm currently waiting for a precise setup to present itself. Based on the Smart Money Concept, we could be looking at a potential short opportunity around the 24740 zone.
📍 Once the setup is confirmed, I’ll be sharing the exact entry and stop-loss levels with you.
Stay tuned – patience here is key. Let the market come to us.
