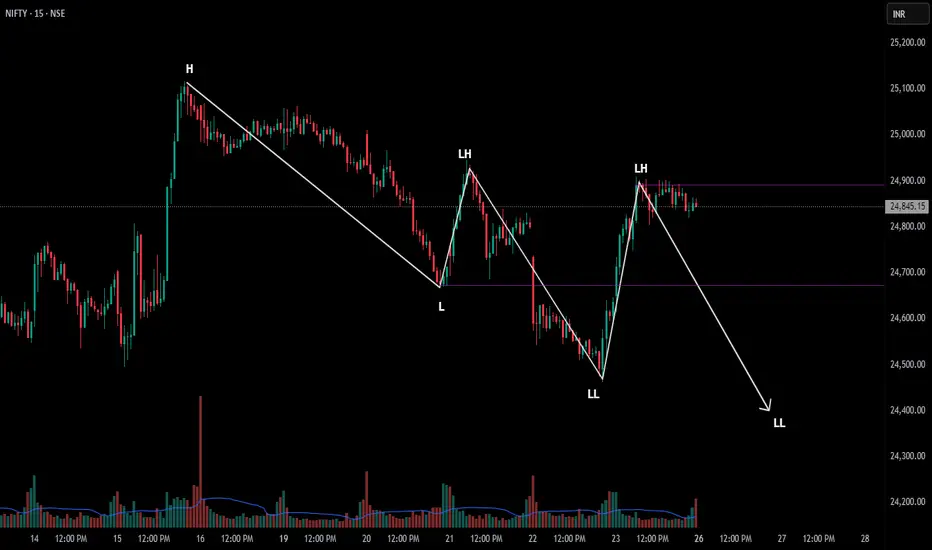
Nifty Spot – 15 Min Chart Analysis:
The current recent market structure is showing Lower Highs (LH) and Lower Lows (LL) — indicating a downtrend.
However, if price moves up first and taps the 25,000 level, it will break the previous high and form a Higher High (HH).
This would signal a Change of Character (CHoCH) or Market Structure Shift (MSS).
If that happens, the trend bias could shift to the upside, and it would be better to wait for a pullback and look for a long entry.
NIFTY trade ideas
Nifty range bound in 24500-25250Nifty range bound in 24500-25250
For confirmed Long entry wait for 25250 to break for targets above 26K.
Any rejection from 25250 must be a short opportunity.
This is our analysis not a BUY or SELL call. Thanks for reading.

NIFTY : Trading levels and plan for 26-May-2025📊 Nifty Trading Plan – 26-May-2025
Timeframe: 15 Min | Reference Spot Price: 24,845
Gap Opening Threshold: 100+ Points
🚀 Gap-Up Opening (Above 24,974) – 100+ Points
If Nifty opens above the Opening Resistance level of 24,974, it enters a critical resistance zone that may trigger two-sided moves. The area between 25,195 – 25,294 is marked as the Profit Booking Zone / Last Intraday Resistance .
🟥 This zone has historically seen supply, and sharp up-moves may get trapped without strength in broader participation.
✅ Plan of Action:
– Avoid initiating long trades immediately post gap-up unless price shows strong bullish candles above 25,195.
– For intraday buying, wait for a clean 15-min candle close above 25,294 with strength in heavyweights.
– Ideal entry would be on a retest of the 25,195–25,294 zone if price holds.
– Reversal patterns (like Shooting Star / Bearish Engulfing) near 25,195 – 25,294 can offer sell-on-rise opportunities toward 24,974, then 24,845.
– Watch for volume confirmation – avoid shorting just because price is high.
🎓 Educational Note: Gap-ups into strong resistance zones require caution. Momentum without volume and market-wide confirmation often leads to failed breakouts. Let structure confirm before jumping in.
📈 Flat Opening (Between 24,790 – 24,974)
This places Nifty inside the No Trade Zone defined between 24,790 – 24,974.
🟧 This range is uncertain – the index may move sideways with choppy price action and lack of conviction from buyers or sellers.
✅ Plan of Action:
– Stay on the sidelines in the first 15–30 mins.
– Only consider long trades if price breaks and sustains above 24,974, then aim for 25,195 – 25,294.
– For short trades, wait for a clean breakdown below 24,790 with a bearish candle close to ride down to 24,684 and then 24,558.
– Risk reward is best outside this zone, not inside. Patience is key.
🎓 Educational Note: Flat openings in mid-range zones often cause emotional trades. Use this time to assess volume trends, sectoral strength, and structure. Most clean entries happen post-10:15 AM.
📉 Gap-Down Opening (Below 24,684) – 100+ Points
A gap-down below 24,684 pushes Nifty near its immediate supports at 24,558 (Last Intraday Support) and 24,250 – 24,190 (Buyer’s Zone).
🟩 This is a sensitive area where smart money may attempt reversals, especially near 24,250 – 24,190.
✅ Plan of Action:
– Watch for reversal signs (Hammer, Bullish Engulfing) around 24,558 and especially in the Buyer’s Support Zone: 24,250 – 24,190.
– If price finds footing and sustains above 24,558, reversal trades can be initiated with a target back to 24,684 – 24,790.
– A strong breakdown below 24,190 would confirm bearishness – in that case, avoid catching falling knives.
– Only go short below 24,190 on breakdown candle with next target open toward swing lows.
🎓 Educational Note: Gap-downs into major demand areas offer some of the best R:R setups—but only if there's evidence of absorption and reversal structure. Never go long just because price is “low”.
🛡️ Options Trading – Risk Management Tips
✅ Use slightly In-the-Money (ITM) options for better delta movement and less time decay.
✅ Avoid trading in No Trade Zones; theta will eat up your premiums.
✅ Follow the 1–2% capital risk rule – don’t over-leverage in anticipation of a breakout.
✅ Always define your stop loss using the underlying spot level, not just option premium.
✅ Book partial profits once price moves in favor and trail SL for the rest.
✅ If you hit 2 stop-losses in a row, take a break and re-assess the trend.
✅ Monitor OI data and sectoral strength—don’t blindly follow index candles.
📌 Summary & Conclusion
🔹 No Trade Zone: 24,790 – 24,974
🔹 Profit Booking / Resistance Zone: 25,195 – 25,294
🔹 Opening Supports: 24,684 & 24,558
🔹 Strong Buyer’s Support: 24,250 – 24,190
📈 For Gap-Ups, avoid early longs into resistance zones unless breakout is confirmed.
📉 For Gap-Downs, prepare for potential reversal from Buyer’s Support Zone.
🕒 In Flat Openings, wait 15–30 mins to avoid whipsaws inside No Trade Zone.
⚖️ Best trades occur outside the No Trade Zone with price + structure + volume alignment.
⚠️ Disclaimer:
I am not a SEBI-registered analyst. This trading plan is purely for educational purposes. Please conduct your own analysis or consult a SEBI-registered advisor before taking trades.

NIFTY🧾 Updated Trade Plan
🔹 ENTRY 1: Momentum Buy near Daily Demand
Parameter Value
Entry 24,767
Stop Loss 24,180
Risk 587 pts
Target 30,471
RR Ratio ~1:5.2
Context At Daily Demand DMIP, but inside Weekly Supply → BUT IS ALREADY SWAP SO RISK IS MINIMAL
🔹 ENTRY 2: Precision Re-entry at Lower Daily Demand Edge
Parameter Value
Entry 24,164
Stop Loss 23,935
Risk 229 pts
Target 30,961
RR Ratio ~1:6.8
Context Lower edge of Daily DMIP + close to Weekly Short Trail (23,601) — Ideal pullback buy zone.
✅ Key Observations & Strategy
Criteria Assessment
MTF Demand Support ✅ Strong across all TFs
GANN Support Active ✅ Above 23,641
Weekly Supply Pressure ⚠️ Moderate
Entry 1 Risk (24,767) ⚠️ High – near resistance
Entry 2 Risk (24,164) ✅ Lower risk & strong RR
Ideal Strategy Scale in via Entry 2; trail aggressively if Entry 1 is taken
📌 Suggested Execution Plan
Aggressive Traders:
Enter at 24,767
SL: 24,180
Keep tight trail near 25,100–25,300
Positional / Safer Traders:
Wait for pullback to 24,164
SL: 23,935
Excellent RR; aligns with GANN long trail zone
Avoid Shorts unless price closes below 23,601, breaking structure + GANN support.
📊 NIFTY Multi-Timeframe Demand Zones
Timeframe Price Action Proximal Distal Average Trade Zone
Yearly Rally-Base-Rally 18,887 15,183 17,035 ✅ BUY
Half-Yearly Rally-Rally 21,801 18,837 20,319 ✅ BUY
Quarterly BUFL RBR 22,526 21,137 21,832 ✅ BUY
Monthly RBR 23,110 21,137 22,124 ✅ BUY
Weekly Demand DMIP 22,180 21,710 21,945 ✅ BUY
Weekly Supply SOE Engulfed 24,589 24,054 24,322 ⚠️ Supply
Daily Demand DMIP (LHS) 24,767 24,535 24,651 ✅ BUY
✅ Overall trend: MTF Bullish
⚠️ Current zone is within Weekly Supply — may cause temporary resistance.
🧮 GANN Key Levels
Signal Type Proximal Distal Average Action
Stay Long Above 23,870 23,412 23,641 ✅ Active
Stay Short Below 23,400 23,641 23,521 ❌ Not active
Current Short Trail 23,601 – – Below this = short bias
✅ Current price > 23,641 = GANN supports long trades.

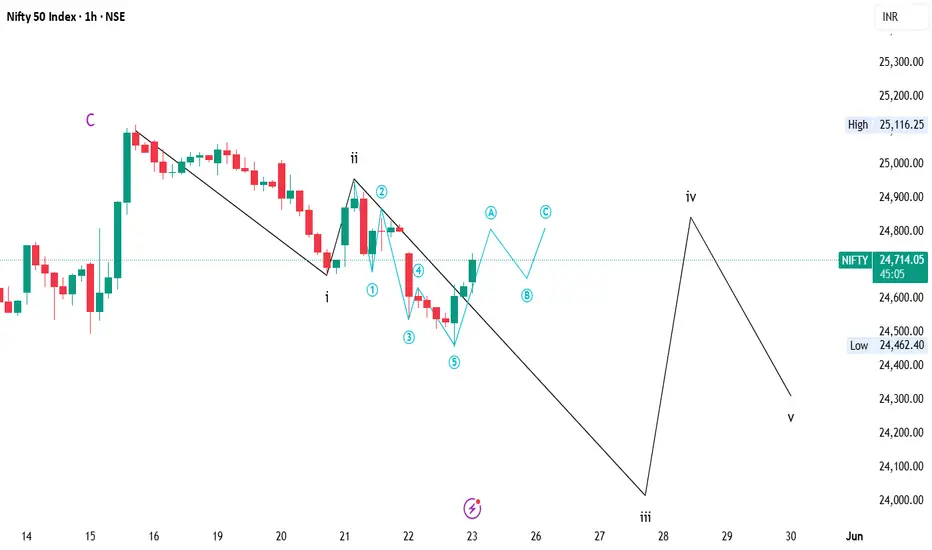
NIFTY50.....New high's, then correction?Hello Traders,
The week started at 25,058 — the week's high — and has declined since then. It bottomed out at around 24,462. This move probably ended wave w (pink), or it could have been the entire wave iv (blue).
Chart analysis:
If it was all of wave iv (blue) the next move will be up to a new high in the coming week. However, a drop around the 24789 range could be possible. If thereafter a wave v (green) ends, a target area is @ 24970.50! If so to come, one target range is around the 25081 level. Here a wave v(green) of ((i)) (pink) ends! While the last move look like a "triangle" 2 in progress, it is my favorite pattern. But note! The last move, possible wave w (pink) has ended below the wave a low (not shown). That means "danger for the bears"!
The bears need to watch the chart closely! If this move, though unexpected, was all of the pattern, the door should be open to new corrective lows in the coming week. Here, one price target is around the 24506 area. That would just correct a 0.618, but still possible! Another target is around 24260 area. Here wave y=w!
Anyway! The targets have been set for the coming week, and we will see and watch the chart closely! Good luck to all traders!
Have a great week.....
Ruebennase
Please ask or comment as appropriate.
Trade on this analysis at your own risk.

Weekly Market Wrap: Nifty & S&P 500 Outlook The Nifty closed the week at 24,853, down 166 points from the previous week's close. It traded within a range of 25,062 (high) and 24,462 (low) — perfectly aligning with our forecasted zone of 24,450 – 25,600. On the weekly chart, the index formed an inside candle pattern, signaling consolidation.
Positives: Despite the dip, Nifty continues to hold above the critical support level of 23,800, keeping the medium-term bullish structure intact.
Key Levels to Watch for Next Week:
High/Low to mark: 25,116 – 24,378
Breakout above 25,116 can lead to tests of 25,329 and 25,500 (resistance zones).
Breakdown below 24,378 could retest 23,800 and 23,600.
A weekly close below 23,800 could spell trouble for bulls, opening doors for deeper correction towards 22,800 and 22,100.
Trend Analysis:
Monthly Timeframe: Bearish
Daily Timeframe: Turned Bearish
Weekly Timeframe: Still Bullish
Conclusion: Stay cautious below 24,378 — volatility may rise if this level is breached.
S&P 500 Weekly Snapshot:
The S&P 500 ended the week at 5,802, down 156 points. Once again, it faced stiff resistance around the 5,980 mark — a historically significant level where the index began its downward move in March 2025.
Geopolitical Impact: Markets remain jittery amid escalating global trade tensions and Trump’s tariff war, likely keeping volatility high over the next 2–3 weeks.
Key Support Zones:
Immediate support at 5,700
Close below 5,700 may trigger declines to 5,551, 5,458 (key Fibonacci support), and 5,392
Bullish Breakout Scenario:
Sustained close above 6,000 is required to resume bullish momentum
Upside targets: 6,013, 6,082, 6,147 (All-Time High), and potentially 6,225
Final Takeaway:
Both Nifty and S&P 500 are at critical junctures. With technical patterns pointing to mixed signals and geopolitical events adding fuel to volatility, traders should stay alert and focus on key breakout and breakdown levels.


Nifty50 – Wave IV Unfolding Within the Grand SupercycleFrom the Grand Supercycle perspective on the monthly chart, we can observe a consistent pattern — every major a-b-c corrective phase has unfolded as a form of flat correction before the next rally. Based on this historical rhythm, and the current market structure, I believe we are still in the process of completing Wave V of the Grand Supercycle.
This long-term view is overlayed on the chart to help contextualize what’s happening now.
Zooming In – The Weekly Breakdown Within Wave IV and V:
Within this broader Grand Supercycle, the weekly chart captures a five-wave subdivision between Supercycle’s Wave IV and the yet-to-be-completed Wave V.
Wave III has completed after achieving a 100% projection of Wave I from Wave II , respecting classic Fibonacci symmetry.
After the Wave III high, we’ve entered a correction phase , where sub-wave b is currently unfolding.
Flat Correction in Play?
For the current move to qualify as a Flat correction:
Wave b must retrace at least 90% of Wave a .
This requirement is crucial to maintain the “Flat” identity of the structure.
Depending on the nature of the flat:
If it’s a Regular Flat or Expanding Flat, Wave c must break below the bottom of the rising parallel channe l, and end below the low of Wave a .
If it’s a Running Flat , Wave c can stay above Wave a’s low, and price may remain within or near the channel’s lower boundary.
Also, as per EW guidelines, Wave c must unfold in 5 waves — which will be the next key structure to monitor.
Where Are We Now?
As long as Wave b is progressing toward 90% retracement , the near-term bias remains bullish.
But once Wave b completes, the market may enter Wave c, which could result in a deeper correction — either towards the lower end of the channel or even below, depending on which flat structure plays out.
What Next?
This unfolding Wave c will likely complete Wave IV within the Grand Supercycle, setting the stage for the final upward move — Wave V of both the internal 5-wave structure and the Grand Supercycle itself.
Disclaimer: This is not a buy or sell recommendation. The analysis shared is purely my personal view for educational purposes only.

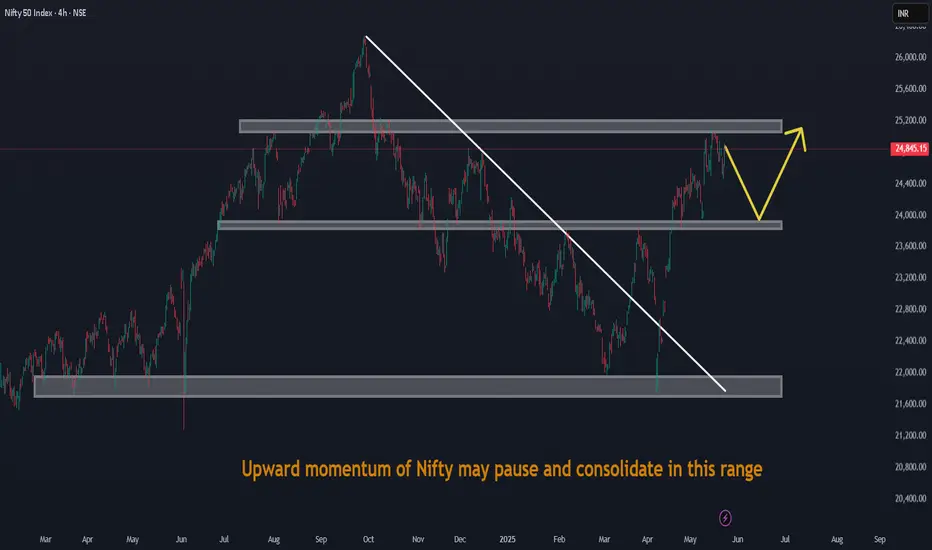
Upward momentum of Nifty may pause and consolidate in this rangeUpward momentum of Nifty may pause and consolidate in this range
Simple Dow Theory Says Nifty Is Gonna Go Up From Here- Nifty has been making an uptrend recently after a double bottom and bull counter attack on
7th April
- A bullish trade has been going on since 17 April based on this trend change
- Target for this double bottom trade is 25,774

Ripe to Go DownGap resistance at 25600.
Hitting resistance line from October 2023.
Sharp rising wedge formation.
RSI divergence, especially in hourly chart.
Gap at 20400 hasn't been filled.
I expect NIFTY to go down all the way to 20000.

nifty is ready tomove above 25223NIfty done its downside journey now it is ready to move above 25223 in next week it will move above that, so wait watch and observe

Nifty levels - May 26, 2025Nifty support and resistance levels are valuable tools for making informed trading decisions, specifically when combined with the analysis of 5-minute timeframe candlesticks and VWAP. By closely monitoring these levels and observing the price movements within this timeframe, traders can enhance the accuracy of their entry and exit points. It is important to bear in mind that support and resistance levels are not fixed, and they can change over time as market conditions evolve.
The dashed lines on the chart indicate the reaction levels, serving as additional points of significance to consider. Furthermore, take note of the response at the levels of the High, Low, and Close values from the day prior.
We hope you find this information beneficial in your trading endeavors.
* If you found the idea appealing, kindly tap the Boost icon located below the chart. We encourage you to share your thoughts and comments regarding it.
Wishing you success in your trading activities!

Nifty trend directionNifty 24609 has resistance at 24865 and support at 24345.Fii's have sold around 12000 contracts.we expect nifty will be moved higher to add more shorts and dropped down.

NIFTY Possible Short Setup – Eye on 24,631 SupportNIFTY formed multiple reversal signals and is now showing signs of weakness after rejecting near 24,825. Volume is high at the top zone, indicating possible distribution.
Current price : 24,789
Expected move: Pullback towards 24,727 and possibly to 24,631 (strong support)
If price holds at 24,631, potential bounce is expected.
Trade Plan :
Entry (Short): Below 24,780
Target 1: 24,727
Target 2: 24,631
Stop Loss: Above 24,820
If support holds, watch for bullish reversal setups.

Nifty May Touch 25,500 and the FALL......NIfty may go to collect pending stoploss and orders resting above 25000 and after trapping bulls and bears together it may fall to level 24700 within a month.

Nifty trend directionNifty 24813 has resistance at 24896 and support at 24564,24411.last 2 days fii were selling contracts and yesterday they have bought few for covering. We expect nifty will be bring further down to more cover.

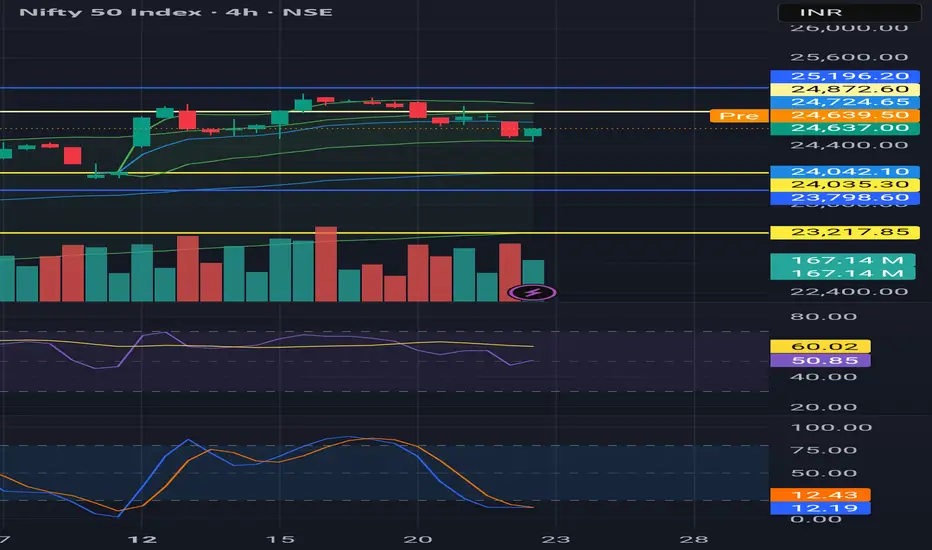
Nifty 50 AnalysisNifty 50 showing signs of short-term exhaustion after a strong dip. RSI hovering near 50 and Stochastic in oversold zone hint at a possible relief bounce. Crucial support zone: 24,600–24,500. If broken, 24,035 and 23,798 levels are next. Stay cautious—trend is still weak until a clear reversal forms. #NiftyAnalysis #StockMarketIndia
#NIFTY Intraday Support and Resistance Levels - 23/05/2025Today, a flat opening is expected in Nifty. If after opening Nifty starts trading and sustains below the 24700–24650 zone, a short trade can be considered with downside targets of 24600, 24550, and 24500.
Further weakness may be seen if Nifty breaks below the 24450 level, opening the way for extended downside targets at 24350, 24300, and 24250.
On the upside, if Nifty sustains above 24750, a long position can be initiated. This may lead to bullish movement toward 24850, 24900, and 24950+ levels. However, 24950 will act as a key resistance, and reversal is possible near this zone.

23 May Nifty50 trading zone #Nifty50 #option trading
99% working trading plan
👉Gap up open 24683 above & 15m hold after positive trade target 24860, 24980
👉Gap up open 24683 below 15 m not break upside after nigetive trade target 24480, 24330
👉Gap down open 24480 above 15m hold after positive trade target 24683, 24860
👉Gap down open 24480 below 15 m not break upside after nigetive trade target 24330, 24170
Trade plan for education purpose I'm not responsible your trade
More education follow & support me

NIFTY 50 KEY LEVELS FOR 23/05/2025// The core idea behind this indicator was sparked by a simple but powerful clue:
// 👉 "If you get one level, you get all levels."
// From that point onward, everything—the logic, calculation method, and application—has been developed independently through my own analysis and experience.
// I am not a seller, and no one taught me this system. This method is a result of my own effort and refinement.
///////////////////// Explanation /////////////////////
// This trading system is designed to eliminate blind trades by offering confirmation-based entry and exit points.
///////////////////// Entry/Exit Strategy /////////////////////
// - Use the BLACK line for long trades, and the RED line for short trades, in line with confirmation from your trading plan.
// - Stop Loss:
// - For long trades: below the RED line.
// - For short trades: above the BLACK line.
// - Take Profit:
// - For long trades: target the next RED line above.
// - For short trades: target the next BLACK line below.
///////////////////// Recommended Timeframe /////////////////////
// Use on a 5-minute chart for best results.
///////////////////// Disclaimer /////////////////////
// This setup is shared purely for educational purposes.
// I am not responsible for any gains or losses that may result from its use.
// Always use your own judgment and risk management.

Nifty Analysis EOD – May 22, 2025 – Thursday🟢 Nifty Analysis EOD – May 22, 2025 – Thursday 🔴
Nifty weekly expiry, shocking climax...!
📉 Nifty Summary:
A 66-point gap-down set the stage, followed by a quick 196-point slide within the first 20 minutes, bottoming out at 24,541.60. From here, the index attempted a bounce but faced stiff resistance at the 24,625 ~ 24,640 zone—not once, but twice. This zone flipped polarity and began acting as resistance instead of support.
The third breakdown at 12:45 PM finally breached the day’s low, taking Nifty to a new bottom of 24,509.10, and then further to 24,462.40 by 2:35 PM. But just when it looked like the bulls were done for, the market made a shocking expiry bounce, recovering sharply to close at 24,637, back inside the crucial 24,625 ~ 24,640 zone.
🛡 5 Min Chart with levels
🔄 The day’s character was mostly range-bound post the initial fall, with a 90-point band until the IB Low was broken. The fall lacked strong conviction—signs of both bulls and bears trying to dominate but failing to sustain.
The final hour’s rebound was the real drama—profit booking, fresh buying, and expiry short covering all collided to cause a spike that caught many off-guard. A classic expiry move—some traders hurt, some became heroes.
📌 Yesterday’s Note Reference:
"Below 24640–24625, weakness may extend down towards: → 24500 → 24460."
✅ Market played by the script, touched 24500, and 24460 got hit too.
📉 Is the retracement run finished?
Technically, YES.
A bold call, but unless global headwinds reappear, today’s low must sustain.
If it doesn’t, watch for the 24,330 ~ 24,365 zone as the last guard. Breach that? Gap-fillers may run wild down to 24,160 ~ 24,008.
Not a trade plan—just technical facts. Let's see what the tape reveals next.
🛡 5 Min Intraday Chart
🥷 Gladiator Strategy Update
Strategy Parameters
ATR: 327.22
IB Range: 195.90 → Medium IB
Market Structure: Imbalanced
Trade Highlights
✅ 1st Long Trigger: 12:45 PM – Target Achieved (R:R = 1:1)
💼 Total Trades: 1
🕯 Daily Time Frame Chart
📊 Support & Resistance Levels
🔺 Resistance Zones:
• 24,768 ~ 24,820
• 24,660
• 24,640 ~ 24,625
• 24,882
• 24,920
• 24,980 ~ 25,000
• 25,062 ~ 25,070
🔻 Support Zones:
• 24,590
• 24,530 ~ 24,480
• 24,460
🧠 Final Thoughts
"Markets don’t trap you; your lack of preparation does."
Today was a pure example of expiry surprise—respect the zones, follow the structure, and keep adapting.
✏️ Disclaimer ✏️
This is just my personal viewpoint. Always consult your financial advisor before taking any action.
