Nifty May 2nd Week AnalysisNifty can remain very positive for the upcoming week post easing global and geopolitical tensions and ceasefire across the globe . On the upside, it will be important to see if Nifty is able to maintain its position at 24450 and 24850, as these are quite resistance levels. But if Nifty manages to cross these levels, then we can expect a strong short covering up to 25000+ .
****** ALL LEVELS ARE MARKED IN THE CHART POSTED ******
NIFTY trade ideas

NIFTY50.....Not done to the downside!Hello Traders,
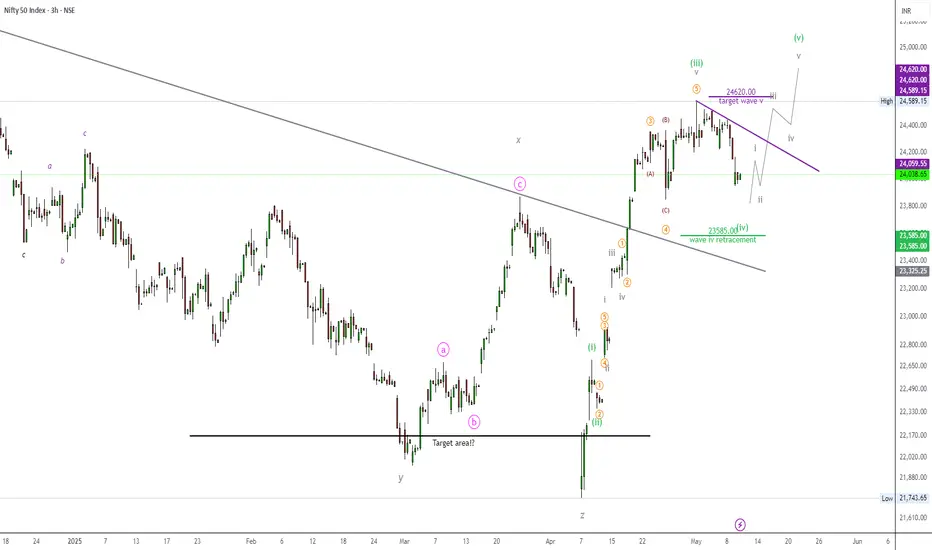
the NIFTY50 has failed to reache my stated target area @ 24620 points and declined to 24038 during Friday's session! This was not expected, but still happened! So, the open target is also available @ 23585 points at the downside within a wave 4.
Chart analysis.
The decline within a wave 4 is not over yet! One open target is valid around the 23585 area in the coming week.
If N50 will achieve this target range, the door is open to a new high above 24620 point as. Probably within a range of about 24875 to 24792 points. Here, a wave (v) should be ending.
Keep in mind, that a wave 4 of any degree, never touch the wave 1 high. So, a wave 4 would be eliminated @ 22697 points.
It is also possible, that the wave 4 should morph into a triangle. While this pattern is still the most unlikely pattern in a wave 4, we should not deal with that!
Anyway! I have visualized the coming wave 5 with my target areas.
One first sign for a wave 5 that started is when the purple trend line push above the 243xx range, depending on when and if it will be achieved!
So friends, that's it for today. We will see, how N50 will morph in the coming week.
An update will follow after new chart pattern develop.
Have a great Sunday.....
Ruebennase
Please ask or comment as appropriate.
Trade on this analysis at your own risk.
Nifty 50 Daily Chart Analysis – May 10, 2025Nifty showed strong resilience in the face of initial geopolitical tensions, with bulls managing to push the index higher despite macro uncertainties. This signaled underlying strength and suggested that the market wasn’t ready to roll over just yet.
However, looking at the current structure, the recent price action hints that bullish momentum might be losing steam. The index faced selling pressure after attempting new highs, and the price has started to retrace.
🚩 Key Level to Watch: March High
The March high now becomes a critical decision point. As long as Nifty sustains above this level, the broader bullish structure technically remains intact. But—and this is key—a decisive close below the March high followed by sustained price action beneath it could trigger a deeper correction.
📉 If that breakdown happens, we could see:
A gap fill play unfold
A possible move toward the demand zone near 23,000
And if sentiment worsens, a retest of the “election candle” low near 21,200 could be on the table
🎯 Conclusion: Bulls are clearly getting tired. Momentum is fading. March high = make-or-break level. Below that, the path of least resistance might shift downward, and the market could slip into a corrective phase—possibly until election-related clarity emerges.

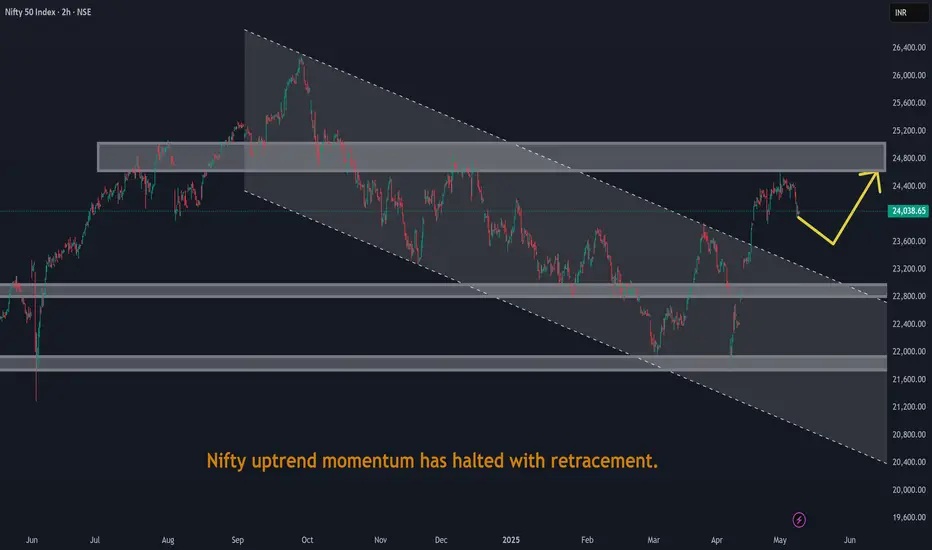
Nifty uptrend momentum has halted with retracement.Nifty uptrend momentum has halted with retracement due to recent market panic sentiments from war.
Weekly Market Wrap: Nifty Dips 340 Points Amid Global TensionsThis week, the Nifty 50 ended on a cautious note, closing at 24,008, down 340 points from the previous week's close. The index traded within a tight range, hitting a high of 24,526 and a low of 23,935—well within my anticipated levels of 24,900 to 23,800.
Silver Lining: Despite ongoing geopolitical tensions and negative news flow—including war-related developments—bulls managed to defend the critical psychological support of 24,000. That’s a sign of resilience in an otherwise shaky environment.
What’s Ahead?
For the upcoming week, expect high volatility. I see Nifty moving between 24,600 and 23,200. A weekly close below 23,800 could spell trouble for bulls, potentially opening the door for a drop toward major support zones at 23,200 and 23,000.
Technical Outlook:
Monthly & Daily Timeframes: Weak
Weekly Timeframe: Still bullish
So, while long-term charts show vulnerability, the weekly trend gives hope. I'm staying cautiously bullish—but will only turn aggressive once the monthly chart flips positive. Until then, it’s time to stay vigilant, not impulsive.
Global Cues: S&P 500 Holding Up Amid Uncertainty
The S&P 500 closed at 5,659, just 30 points down from the previous week, forming a doji candle—a clear sign of indecision. As long as the index holds above 5,532, there's no major cause for concern.
Bearish Trigger: Below 5,532, expect downside pressure toward 5,458 and 5,392, which could spill over into already fragile emerging markets like India.
Bullish Breakout: Above 5,770, bulls gain momentum, with potential upside targets of 5,821, 5,850, and 5,900. A rally here could bring relief to global equities, including Indian markets.

Nifty Trend directionNifty 24008 has support at 23846 while trend decider is 24113
If breakout and sustained could move to 24360
FII's have negative holding in future contracts and 1 Lac PUT OI skew compare to Calls OI.
Volatality is at 20
On the above facts We expect Nifty will be move down further .

Nifty Analysis EOD - May 9, 2025 - Thursday🟢 Nifty Analysis EOD - May 9, 2025 - Thursday 🔴
🧨 Gap Down, Rebound & a Triangle Trap – Bulls Show Spine Amid Chaos
Opening Mood:
Overnight panic from geopolitical tensions shook the market’s foundation—but the bulls weren’t ready to surrender just yet.
🧭 Nifty Summary:
Gift Nifty had plunged to 23,760 late last night on news of escalating conflict—marking a 445-point fall. However, as the night wore on without further developments, markets began to stabilize. At the open, Nifty registered a gap-down of 338 points at 23,935, but the first 5-minute candle showed strength, racing to fill the gap.
After a brief attempt to break the Previous Day’s Low (PDL), Nifty failed to hold below and slid back to its origin. The rest of the day was a tug-of-war with sharp two-sided moves, eventually forming a descending triangle pattern—a sign of compression and directional indecision.
🕯️ Daily Candle Breakdown:
Today’s Candle: Wide-range doji with upper wick—signs of volatility and hesitation
Close: 24,008 (▲ Positive)
Key Observations:
✅ Above 24,000 Psychological Mark
✅ Held Support Zone: 24,000 ~ 23,950
✅ Above Recent Swing Low: 23,847.85
❌ Slightly Below Previous Week’s Low: 24,054.05
❌ Below Previous Swing Close: 24,036
What It Implies:
Buyers are stepping in at key supports, but conviction is still lacking. The market remains reactive to global cues, especially Mission Sindoor ones.
⚔️ Gladiator Strategy Update
Strategy Parameters:
ATR: 291.20
IB Range: 204.00 (Large IB)
Market Structure: ImBalanced
Trade Highlights:
Total Trades: 1
✅ Long Trigger @ 10:10 AM → Target 1:1.5 Achieved
📈 Intraday Walk (5-Min View):
Strong gap-fill in the first candle signaled bullish intent
Failed breakdown below PDL trapped weak shorts
Descending triangle emerged as price compressed
Market closed near resistance but above key support—neutral to slightly bullish tone
🔮 What’s Next?
This market is walking a tightrope between sentiment and structure. On one hand, technical levels are being respected—but on the other, global uncertainty is keeping participants hesitant.
“This is a news-driven market. Delivery trades are best avoided. Stay nimble, trade the levels, and protect capital. Remember, sometimes staying out is a profitable strategy.”
🔍 Support & Resistance Levels
🔼 Resistance Zones:
24,036 ~ 24,044
24,150 ~ 24,165
24,188 ~ 24,240
24,290
24,330 ~ 24,365
24,400 ~ 24,420
🔽 Support Zones:
24,000 ~ 23,950
23,935
23,890 ~ 23,870
23,848
23,820
23,710 ~ 23,660
📌 Final Thoughts:
“Structure is key. When levels work, respect them. When they break, adapt.”
In a market full of noise, discipline and level-based action is your edge.
✏️ Disclaimer
This is just my personal viewpoint. Always consult your financial advisor before taking any action.


So finally Nifty recedes a bit due to Indo-Pak tensions.Finally Nifty today receded a bit due to Indo-Pak tensions and war like situation/war between Indo-Pak. The support levels for Nifty now remains at 23924, 23809 important (Father line support of hourly chart), 23676 important mid channel support if this support is broken bears can drag Nifty further down to 23462, 23279, 22771 and finally 22579 which is the channel bottom support. If this level is broken there can be further free fall. Resistances on the upper side remain at 24111, 24247 (Mother Line resistance on the hourly chart), 24443, 24634 and 24892 (Channel top resistance). Situation remains fluid due to the Geo-Political situation no support can be very strong support as a lot can happen during the week end and no resistance can be a solid resistance if few things move in the anticipated direction.
Disclaimer:The above information is provided for educational purpose, analysis and paper trading only. Please don't treat this as a buy or sell recommendation for the stock or index. The Techno-Funda analysis is based on data that is more than 3 months old. Supports and Resistances are determined by historic past peaks and Valley in the chart. Many other indicators and patterns like EMA, RSI, MACD, Volumes, Fibonacci, parallel channel etc. use historic data. There is no guarantee they will work in future as markets are highly volatile and swings in prices are also due to macro and micro factors based on actions taken by the company as well as region and global events. Equity investment is subject to risks. I or my clients or family members might have positions in the stocks that we mention in our educational posts. We will not be responsible for any Profit or loss that may occur due to any financial decision taken based on any data provided in this message. Do consult your investment advisor before taking any financial decisions. Stop losses should be an important part of any investment in equity.

Nifty levels - May 12, 2025Nifty support and resistance levels are valuable tools for making informed trading decisions, specifically when combined with the analysis of 5-minute timeframe candlesticks and VWAP. By closely monitoring these levels and observing the price movements within this timeframe, traders can enhance the accuracy of their entry and exit points. It is important to bear in mind that support and resistance levels are not fixed, and they can change over time as market conditions evolve.
The dashed lines on the chart indicate the reaction levels, serving as additional points of significance to consider. Furthermore, take note of the response at the levels of the High, Low, and Close values from the day prior.
We hope you find this information beneficial in your trading endeavors.
* If you found the idea appealing, kindly tap the Boost icon located below the chart. We encourage you to share your thoughts and comments regarding it.
Wishing you success in your trading activities!

Nifty Trend directionNifty 23976 has slipped support 24085 . Technical target is at 23514. FII's have 1 lakh PUTS skew than Calls and we believe that could be a reason for Nifty traded down to offset the skew.
Above 24045 could be considered for short entry
Call PUT
8-May 2.43L 2.79L
07 May -7,304 -18,548
6-May 40,525 90,159
05 May -77,244 -1.22L
2-May -1.2L -52,037
Net 78,977 176,574

Nifty (Spot) Range playI expect Nifty to remain in the 24150-23750 range. This is a low-volume area and price will stay here.
Negation levels will be 24250 and 23600.

#NIFTY Intraday Support and Resistance Levels - 09/05/2025Gap down opening expected in nifty. After opening if nifty starts trading below 23950 level then possible further downside upto 23750. Any upside movement can possible if nifty sustain above 24000 level. Upside 24200-24250 zone act as a strong resistance for today's session. Any upside rally can reversal from this level.

No BREAKDOWN! Yet to decide the trend! As we can see despite the break it managed to close inside the structure and hence still the indecision remains in view as till it sustains either side of the structure, no directional move can be expected but gaps can be created due to war like situation leading to sluggishness in the market so plan your trades accordingly and keep watching

"Nifty 50 Chart Turns Cautious: Downside Risk Builds"1. **Rising Wedge Breakdown:**
* The index had been trading in a **rising wedge** pattern (purple converging lines).
* A **bearish breakdown** has occurred, suggesting potential for further downside.
* The price broke below the lower trendline with strong red candles and rising volume, validating the bearish move.
2. **Bear Flag Breakdown:**
* A smaller **bear flag** or **descending channel** pattern within the wedge broke down as well, reinforcing bearish sentiment.
3. **Support Zone Tested:**
* Price is currently hovering around a critical **horizontal support zone** between **24,081 – 24,240**, marked with black lines.
* The index is sitting just above this zone, and a clean break below could accelerate selling.
4. **Long-Term Uptrend Line:**
* A longer-term ascending trendline lies just below the current price (\~24,050 area).
* This could act as **last-resort dynamic support** before a larger correction.
---
* **Immediate Resistance**:
* 24,240 – Minor horizontal resistance
* 24,400 – Former support now turned resistance
* **Immediate Support**:
* 24,081 – Horizontal support
* 23,900–24,000 zone – Next key demand area
* 23,700 – Long-term trendline & psychological support
---
**Volume Analysis:**
* Recent volume spike on red candles indicates **stronger participation from sellers**.
* Bearish momentum is likely to continue unless volume dries up and bullish candles appear at support.

Will NIFTY50 fall?Regarding NIFTY 50 Index
my expectation was that after a small growth, the g-wave from the diametric will be completed, then the price correction will start and the reason for it can be anything, definitely if the correction starts, the reason will be the war between India and Pakistan.
Normal:
The correction can continue up to the range of 23209-23456 and after spending the required time, start moving up. If this range is broken, the correction can end in the range of 22300-22700.
Pessimistic:
If the end of the wave-(D) is broken strongly, the upward movement that was formed from 21740 to 24593 will be considered as an X-wave and the wave-(D) will turn into a double pattern. Although the upward movement that formed from 21740 to 24593 does not have all the conditions of the X-wave, but when the market is not normal, we need to be a little flexible in our analysis.
What will be the second pattern of the double combination?
Usually, after the diametrics, the second pattern tends to be a neutral triangle or a contracting triangle or a reverse contracting triangle. But I will not comment on it now and wait for a few waves of the second pattern to form, then we can predict the pattern with more probability.
Good luck
NEoWave Chart

Nifty Market view and trade plan * I explain weekly chart, in explanation I explained from last four months but actually it was from last four weeks.
So Nifty price action shows - Slight down to consolidation bias
Market has trapped lower low formation so 23500/23600 will act as strong demand zone
Major constituent of Nifty
1. Finnifty - Consolidatiing after hitting all time high so, down to sideways for short term ( one to four week)
2. Nifty IT - Slight down and consolidation
3. Nifty oil and Gas - Down this previous demand zone of 10750
4. Nifty Auto - Follows almost Nifty and Nifty oil and gas structure so down to side ways
5. Nifty FMCG - At the bottom of consolidation so down chance are high
Over all sideways to down bias

Nifty levels - May 09, 2025Nifty support and resistance levels are valuable tools for making informed trading decisions, specifically when combined with the analysis of 5-minute timeframe candlesticks and VWAP. By closely monitoring these levels and observing the price movements within this timeframe, traders can enhance the accuracy of their entry and exit points. It is important to bear in mind that support and resistance levels are not fixed, and they can change over time as market conditions evolve.
The dashed lines on the chart indicate the reaction levels, serving as additional points of significance to consider. Furthermore, take note of the response at the levels of the High, Low, and Close values from the day prior.
We hope you find this information beneficial in your trading endeavors.
* If you found the idea appealing, kindly tap the Boost icon located below the chart. We encourage you to share your thoughts and comments regarding it.
Wishing you success in your trading activities!

Nifty Will move voilentlyNifty will show voilent moves soon , Ill go Long straddle ATM , which includes buying ATM call and put both..

Nifty preparing itself for Big Momentum Today 8may 2025 Nifty traded in just tiny range even on expiry Day. so, what will be next Move?
it is ready for bearish momentum ?
First reason: I have noticed multiple weakness through Wick which is representing by arow on chart.
Second reason: whenever market traded in narrow range (around 8-10 hourly candle) in past few days it gave breakdown represented drawing 4 yellow area see on chart.

#NIFTY Intraday Support and Resistance Levels - 08/05/2025Flat opening expected in index. After opening it will face major resistance at 24500 level. If reversal from this level can give downside movement upto 24250 support level. Strong upside rally only expected if nifty starts trading and sustain above 24500 level. Currently nifty consolidating in between range of 24250-24450 levels.

Nifty at major resistance Nifty 24414 - suggests Nifty is at major resistance and resistance from trend 1 and 2 . Nifty has support at 22230. Expected to be bullish only above 22480.

NIFTY still in structure! As we can see NIFTY is still in tight range and hence unless this structure is broken either side, no directional rally can be expected so plan your trades accordingly and keep watching till breakout happens either side l.
