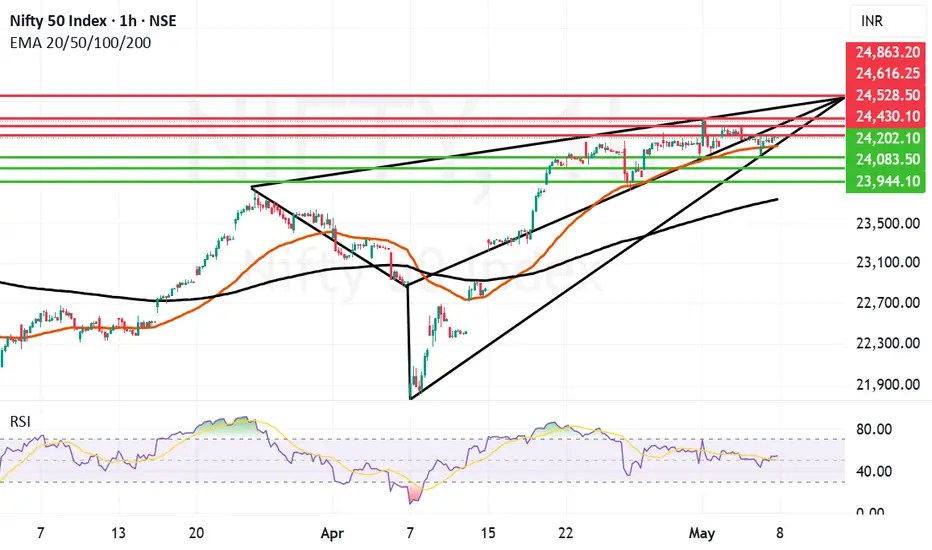
Very Strong performance by Nifty to close in Positive todayDespite the fear of escalation of tensions at Indo-Pak border and Indian carrying out Operation Sindoor Nifty closed in Green today. This signifies the strength of Indian market, India as an Economy and India as a country. Very few would have imagined that Indian markets will close in Green today when the market begun early morning. The situation still remains fluid/dynamic and explosive. so still investors should keep stop losses and trailing stop losses in place.
Supports for Nifty remain at: 24315 (Strong Mother line for hourly chart), 24202, 24083, 23944 and 23754 (Strong Father Line support). Below 23754 Bears can take control of the market and drag it towards 23K.
Resistances For Nifty remain at: 24430, 24528, 24616 and 24863. Closing above 24863 can empower Bulls in a big way to Pull Index towards 25K+ levels.
Disclaimer: The above information is provided for educational purpose, analysis and paper trading only. Please don't treat this as a buy or sell recommendation for the stock or index. The Techno-Funda analysis is based on data that is more than 3 months old. Supports and Resistances are determined by historic past peaks and Valley in the chart. Many other indicators and patterns like EMA, RSI, MACD, Volumes, Fibonacci, parallel channel etc. use historic data which is 3 months or older cyclical points. There is no guarantee they will work in future as markets are highly volatile and swings in prices are also due to macro and micro factors based on actions taken by the company as well as region and global events. Equity investment is subject to risks. I or my clients or family members might have positions in the stocks that we mention in our educational posts. We will not be responsible for any Profit or loss that may occur due to any financial decision taken based on any data provided in this message. Do consult your investment advisor before taking any financial decisions. Stop losses should be an important part of any investment in equity.
NIFTY trade ideas
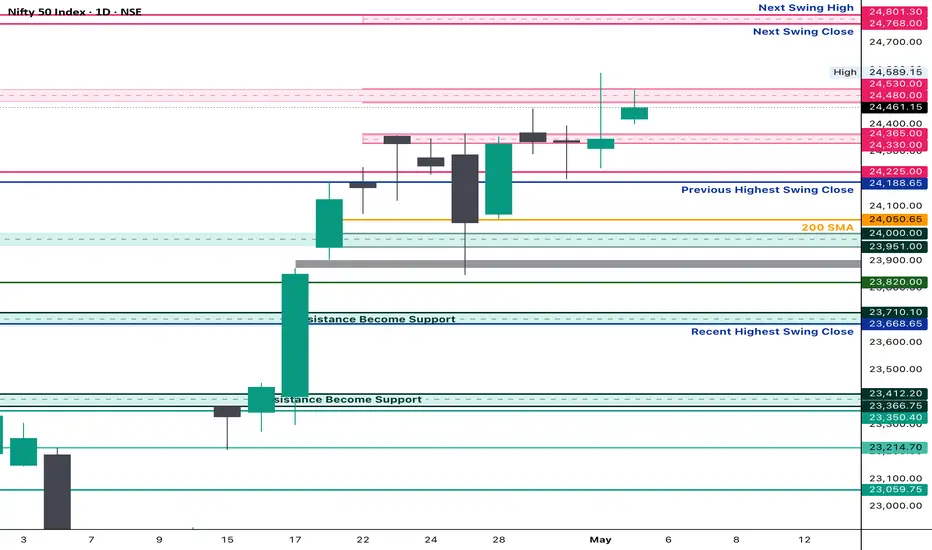
Nifty levels - May 08, 2025Nifty support and resistance levels are valuable tools for making informed trading decisions, specifically when combined with the analysis of 5-minute timeframe candlesticks and VWAP. By closely monitoring these levels and observing the price movements within this timeframe, traders can enhance the accuracy of their entry and exit points. It is important to bear in mind that support and resistance levels are not fixed, and they can change over time as market conditions evolve.
The dashed lines on the chart indicate the reaction levels, serving as additional points of significance to consider. Furthermore, take note of the response at the levels of the High, Low, and Close values from the day prior.
We hope you find this information beneficial in your trading endeavors.
* If you found the idea appealing, kindly tap the Boost icon located below the chart. We encourage you to share your thoughts and comments regarding it.
Wishing you success in your trading activities!

#NIFTY Intraday Support and Resistance Levels - 07/05/2025Today will be slightly gap down opening expected in nifty. After opening if nifty sustain above 24250 level then expected consolidated movements in index in between 24250-24450 level. Major downside expected in case nifty gives breakdown of support level and starts trading below 24200. This downside rally can goes upto 24000 level.

#NIFTY 50 Supply ZoneA Supply Zone in the NIFTY 50 indicates a price level where selling pressure historically increases, often leading to a reversal or pullback. Traders identify these zones using previous resistance levels, rejection candles, or high-volume selling areas.

Nifty Breakdown or Spring ?Nifty 24379 has showing a breakdown from symmetrical triangle pattern in 15 min chart. Will it turn out to be a 'spring'. symmetrical triangle pattern is indecisive. A break above 24454 will turn Nifty bullish and below 24349 it will be bearish.

"Nifty 50 Eyes Breakout from Key Support Zone"**Support Zone (Red Rectangle)**:
* Strong support between ₹24,290 – ₹24,340.
* Multiple price bounces have occurred here, indicating demand presence.
**Resistance Levels**:
* **Immediate resistance**: ₹24,409.65 (horizontal red line)
* **Next resistance**: ₹24,494.45
**Support Levels**:
* **Immediate support**: ₹24,290
* **Next support**: ₹24,240.65
**RSI (Relative Strength Index) – 14 Period**
* RSI is at **36.25**, near the oversold region.
* Indicates the index may be poised for a short-term bounce.
* Positive RSI divergence is not yet confirmed but should be monitored.
---
**Bullish Scenario**:
* A breakout above the black descending trendline (\~₹24,360) with volume can lead to:
* First target: ₹24,409.65
* Second target: ₹24,494.45
* Supported by wedge breakout and RSI recovery.
**Bearish Scenario**:
* Breakdown below ₹24,290 zone can trigger a fall to:
* First target: ₹24,240.65
* Second target: Lower bound of ascending channel (\~₹24,060)

Nifty ready for correction / pullbackNifty has recently made a higher high on daily chart
After making higher high, now it has made a clear bearish market structure which might lead to a correction to make higher low on daily chart
Possible trade entry and stoploss shown in the chart, adjust according to position of market price tomorrow morning

Will BEARISHNESS CONTINUE..?As we can see NIFTY couldn’t sustain itself above the neckline and fell below leading to a directional downtrend throughout the day as we analysed in our previous post! Now that NIFTY is maintaining itself below the given zone, it is likely to remain bearish unless it manages to close above the neckline so plan your trades accordingly.

NIFTY Wait for a breakout: When the price crosses above the trendline, it could be a bullish signal.
Monitor for a breakdown: If the price breaks below the trendline, it could be a bearish signal.
If you find this helpful and want more FREE forecasts in TradingView, Hit the 'BOOST' button
Drop some feedback in the comments below! (e.g., What did you find most useful?
How can we improve?)
Your support is appreciated!
Now, it's your turn!
Be sure to leave a comment; let us know how you see this opportunity and forecast.
Have a successful week
DISCLAIMER: I am NOT a SEBI registered advisor or a financial adviser. All the views are for educational purpose only

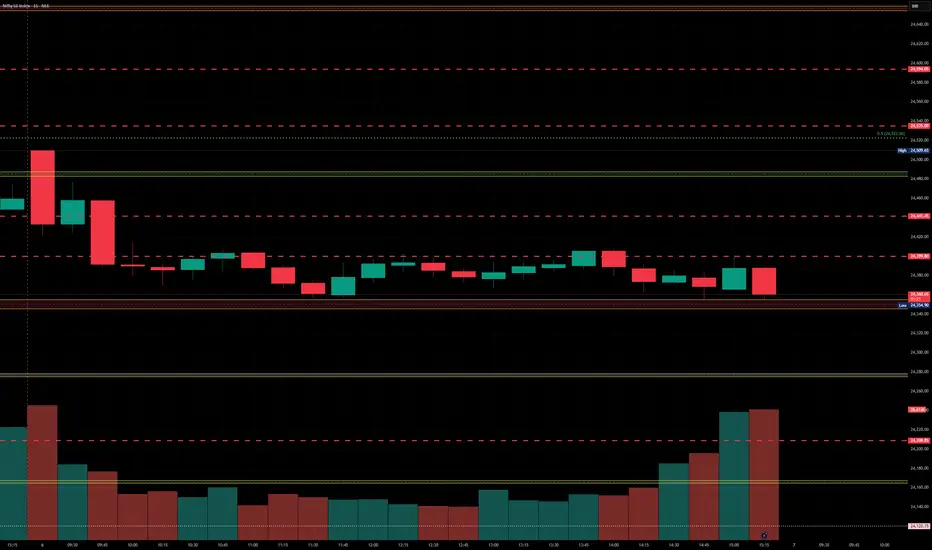
Nifty Analysis EOD - May 6, 2025 - Tuesday🟢Nifty Analysis EOD - May 6, 2025 - Tuesday 🔴
📌 Opening Mood:
A deceptive start near resistance—buyers had a moment, but bears owned the day.
📊 Nifty Summary:
Nifty opened at 24,509, precisely at the psychological and structural resistance zone. The first candle itself (O=H) reflected immediate selling pressure, and the index slid quickly, dropping 140+ points in the first hour. It tested the support zone around 24,330 ~ 24,365, which had earlier acted as resistance—a polarity zone now holding as support.
Despite multiple attempts, Nifty couldn’t break back above the upper consolidation band (around 24,400–24,410). For most of the day, it traded in a tight 40–50 point range and eventually settled near the lower end of that range at 24,379.60, while intraday close came in at 24,331.80.
⏱ Intraday Walk (5-min Time Frame Highlights):
🔻 First hour: Quick 140-point drop straight into support
🔄 10:30 AM–2:50 PM: Multiple bounce-back attempts failed at 24,400 and 24350
🧊 3:00 PM–3:30 PM: High volatility zone, test both sides of the range and the day ends with a new low.
🔒 Close: Near day’s low—weak handoff for next session
🧭 Daily Candle Breakdown
📌 Today’s Candle Type: Strong Bearish Candle
📖 Know How of Candle Type:
This candle type signals strong seller dominance. The real body is wide with almost no upper wick, implying bears controlled the day from start to end. Appears frequently after a failed attempt to break resistance.
📌 Today’s OHLC:
Open: 24,500.75
High: 24,509.65
Low: 24,331.80
Close: 24,379.60
Change: –81.55 (–0.33%)
📐 Candle Structure:
🔹 Real Body: 121.15 points → Strong Red Body (Bearish Control)
🔹 Upper Wick: 8.90 points → No meaningful buying (Daily TF, Intraday No Wick)
🔹 Lower Wick: 47.80 points → Slight pullback, but bears still dominate(Daily TF)
📌 Interpretation:
Bears were in control from the opening tick
The candle sits near the bottom of the day’s range
Comes after a bullish candle at resistance → Potential short-term reversal signal
Watch for confirmation below 24,330 to trigger an extended downside
⚔️ Gladiator Strategy Update
📌 Strategy Parameters:
ATR: 290.90
IB Range: 129.85
IB Category: Medium IB
Market Structure: Balanced
📌 Trade Highlights:
🔹 Trade Count: 1
✅ Long Trigger @ 11:25 AM → Minor profit as Trade Time Exit Trigger
🔮 What’s Next?
🟥 Short bias: Only below 24,330 with conviction
🟩 Long bias: Only if the price crosses and sustains above 24,460 ~ 24,490
⚠️ Between these levels: Avoid directional bets. Look for scalping setups only.
🔍 Support & Resistance Levels
📌 Resistance Zones:
24,400 ~ 24,420 (Immediate hurdle)
24,480 ~ 24,530 (Key zone with 24,500 psychological level)
24,590
24760~24,800
📌 Support Zones:
24,365 ~ 24,330 (Immediate support)
24,290
24,245 ~ 24,240
24,188
24,050
24,000 ~ 23,950
23,820
23,710 ~ 23,660
🧠 Final Thoughts
"In tight ranges, patience is not just a virtue—it’s a strategy. Let the levels do the talking."
✏️ Disclaimer
This is just my personal viewpoint. Always consult your financial advisor before taking any action.

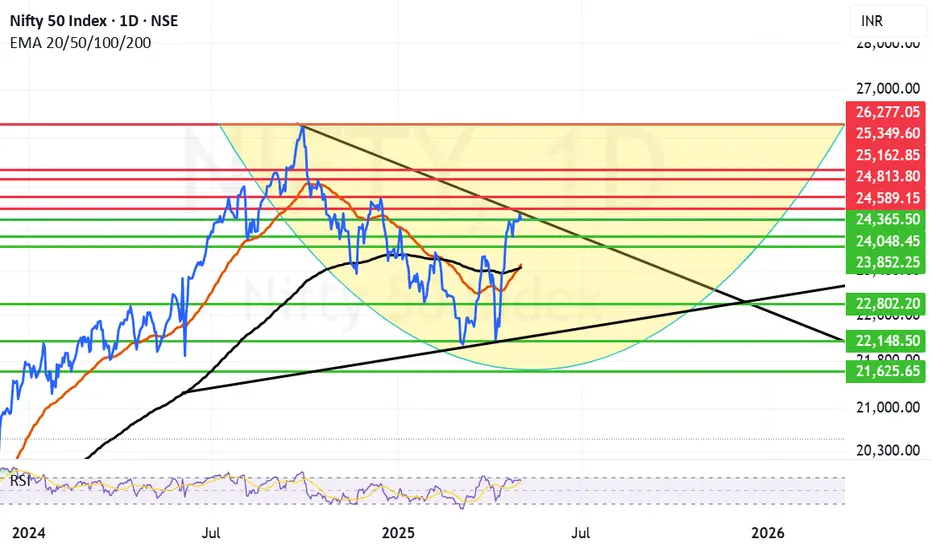
24589 proving to be a difficult resistance to conquerNifty once again tried to sustain the levels above 24500 but again faced resistance and pulled back. Amidst the drums of Ind-Pak war beating and ongoing tariff war the investors are afraid to take seriously long positions. Also we will have a US Fed rate decision coming up which is also adding to the investor anxiety. Mid and Small cap took the maximum brunt today due to all these factors. The Nifty resistance at 24589 is proving very difficult to be conquered with all the noise going around. Nifty resistance levels remain at 24509 and 24589 if we get a closing above 24589 Nifty can easily move for war 24813, and 25162. Supports for Nifty on the down side are at 24365, 24048, 23852 and the zone between 23515 (Mother line) and 23461 (Father line). If we get a closing below 23461, Nifty can again fall to the levels of 22802, 22148 or even 21625. (That is in adverse geo-political developments). A lot right now depends on Macro factors affecting the index and overall situation on Geo-Political front.
Disclaimer: The above information is provided for educational purpose, analysis and paper trading only. Please don't treat this as a buy or sell recommendation for the stock or index. The Techno-Funda analysis is based on data that is more than 3 months old. Supports and Resistances are determined by historic past peaks and Valley in the chart. Many other indicators and patterns like EMA, RSI, MACD, Volumes, Fibonacci, parallel channel etc. use historic data which is 3 months or older cyclical points. There is no guarantee they will work in future as markets are highly volatile and swings in prices are also due to macro and micro factors based on actions taken by the company as well as region and global events. Equity investment is subject to risks. I or my clients or family members might have positions in the stocks that we mention in our educational posts. We will not be responsible for any Profit or loss that may occur due to any financial decision taken based on any data provided in this message. Do consult your investment advisor before taking any financial decisions. Stop losses should be an important part of any investment in equity.
Nifty levels - May 07, 2025Nifty support and resistance levels are valuable tools for making informed trading decisions, specifically when combined with the analysis of 5-minute timeframe candlesticks and VWAP. By closely monitoring these levels and observing the price movements within this timeframe, traders can enhance the accuracy of their entry and exit points. It is important to bear in mind that support and resistance levels are not fixed, and they can change over time as market conditions evolve.
The dashed lines on the chart indicate the reaction levels, serving as additional points of significance to consider. Furthermore, take note of the response at the levels of the High, Low, and Close values from the day prior.
We hope you find this information beneficial in your trading endeavors.
* If you found the idea appealing, kindly tap the Boost icon located below the chart. We encourage you to share your thoughts and comments regarding it.
Wishing you success in your trading activities!
Nifty HS pattern intraday chartNifty 24396 is showing HS pattern in intraday 15 min chart. Possibility to move to 472

Nifty 50 Short Setup | FVG + EMA | Entry: 24388🧠 Description:
This is a short trade setup on the Nifty 50 Index (15-minute chart) based on a confluence of key indicators and price action patterns.
🔍 Setup Overview:
The price broke below a minor consolidation zone after rejecting the Fair Value Gap (FVG) and the dynamic EMA resistance.
The bearish bias is confirmed by the structure and a clear lower-high formation, indicating short-term weakness.
📌 Trade Details:
Entry Price: ₹24,388.55
Stop Loss: ₹24,501.75 (above recent swing high and FVG rejection zone)
Target 1: ₹24,246.65
Target 2: ₹24,104.75
Target 3: ₹23,962.85
These targets align with previous demand zones and EMA support areas on higher timeframes.
📊 Indicators Used:
Fair Value Gaps (FVG) to identify supply zones.
Exponential Moving Average (EMA) as a dynamic resistance.
Multi-timeframe screener (bottom-right) confirms bearish pressure across multiple timeframes — strong bearish momentum visible on 5m to 1h charts.
🧩 Trade Logic:
The FVG rejection and price trading below the EMA band suggest weakness. The entry was taken after a confirmation candle closed below the EMA cloud, with low buying volume. Targets are conservative and mapped according to volume gaps and previous consolidation zones.
🔔 Risk-Reward Consideration:
The setup offers a healthy reward-to-risk ratio (~3:1) if price reaches the final target.
📈 Let me know your thoughts or feedback. This is a purely technical setup — no news or macro fundamentals are factored in.

NIFTY Future Marked on chart...And its good News.I did the count of Neo waves on the Nifty...I have marked the larger cycle and the tgt by 2029 is around 37000...If all 5 waves are completed..right now we are in the 5th wave of the 3rd wave ..Please refer to chart....Also the Indian demographics support this..So please enter your favorate frontline blue chip stocks and sit tight...Please feel free to challenge this chart..I would be happy

#NIFTY Intraday Support and Resistance Levels - 06/05/2025Flat opening in nifty in consolidation zone of 24450-24500 level. After opening any side breakout can gives strong rally in nifty. If nifty starts trading and sustain above 24500 level then expected upside rally upto 24750+ level in today's session. Downside below 24450 level there will be further downside possible upto the 24250 support level.

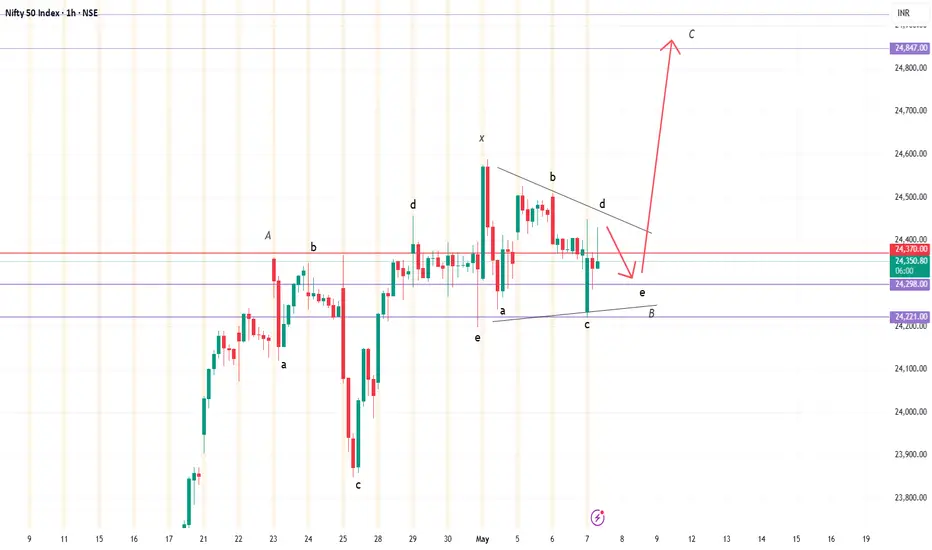
Nifty Impulsive Sequence Approaching Its EndThe Nifty Index has staged a notable recovery after a selloff that began on September 27, 2024, from a high of 21,748.65. We label this decline as wave (II), and the index has since turned upward. However, to confirm that the correction is over and avoid a potential double correction, the index must break above its previous peak of 26,277.35. The rally from the wave (II) low is expected to unfold as a five-wave impulse structure, a pattern commonly analyzed in Elliott Wave theory.
Starting from the wave (II) low, the first wave (wave 1) peaked at 22,697.2, followed by a pullback in wave 2 that bottomed at 22,353.25. The index then surged in wave 3, which itself subdivided into a smaller impulsive structure. Within wave 3, the first sub-wave ((i)) reached 23,372.75, followed by a dip in wave ((ii)) to 23,273.05. The third sub-wave ((iii)) climbed to 24,242.6, with a brief pullback in wave ((iv)) to 24,126.95. The final sub-wave ((v)) concluded at 24,359.3, completing wave 3. A subsequent wave 4 pullback found support at 23,847.85.
Currently, the index may achieve a few more highs, but the rally from the April 7, 2025, low appears mature and could soon face a three-wave correction. As long as the key support at 21,748.65 holds, any near-term pullbacks should find support in a 3, 7, or 11-swing pattern, setting the stage for further upside.

Nifty EOD Analysis – May 3, 2025 Monday🟢 Nifty EOD Analysis – May 3, 2025 Monday🔴
A positive open... but no follow-through. Still stuck in consolidation.
📊 Nifty Summary
Nifty opened with a gap up of 72 points at 24,420, marking the first open above 24,365 in the last 7 sessions — a positive sign. However, the enthusiasm lacked momentum. Price struggled to cross the resistance at 24,526, and the index drifted back toward the mean, trading the entire day between the initial balance (IB) range and hovering around VWAP.
🔹 Intraday Movement: Just 125 points, the smallest in the last 12 sessions — a clear sign of contraction.
🔹 Closing: 24461 closing is the first closing above 24365 in the last 7 sessions.
🔹 Structure: Daily candle formed an Inside Bar, signaling potential energy buildup.
📌 Strategy Forward: Stay alert for an expansion move from this coil — contraction often precedes sharp action.
📌 5 Min Time FrameChart
📌 Daily Time FrameChart
🕯️ Daily Time Frame Chart & Candle Breakdown
🔍 Today’s Candle Type: Spinning Top with a long upper wick
Candle Definition:
A Spinning Top reflects market indecision — both bulls and bears attempted moves, but neither gained dominance. A long upper wick with a narrow body often signals failed bullish momentum or fading enthusiasm.
📌 Today’s OHLC:
Open: 24,419.50
High: 24,526.40
Low: 24,400.65
Close: 24,461.15
Change: +114.45 (+0.47%)
🧱 Candle Structure:
🔹 Real Body:
🟢 Green candle with a modest body →
24,461.15 – 24,419.50 = 41.65 pts
🔹 Upper Wick:
24,526.40 – 24,461.15 = 65.25 pts
🔹 Lower Wick:
24,419.50 – 24,400.65 = 18.85 pts
📖 Candle’s Interpretation:
Despite a strong open and attempt to push higher, the resistance at 24,526 capped the move. The long upper wick shows that buyers lacked follow-through strength, and the close back near the middle of the range indicates a market still stuck in balance.
📉 The Inside Bar + Narrow Range combo is a potential signal for volatility ahead — traders should watch closely for a breakout from this range.
⚔️ Gladiator Strategy Update
📊 Strategy Parameters:
ATR: 303.46
IB Range: 110.65 pts
IB Category: Medium IB
Market Structure: Balanced
📌 Trade Highlights:
Trade Count: 0
❌ No Trigger generated by the system — a no-trade day.
🧠 Note: In contraction phases, it’s common to get fewer setups. Patience is key.
🔮 What’s Next?
Markets are coiling tightly, and an expansion move is likely around the corner. As long as price holds above the 24,330–24,360 band, bulls have hope — but conviction is needed above 24,540.
🧱 Support & Resistance Levels
🔺 Resistance Zones:
24,480 ~ 24,540 (Includes psychological level: 24,500)
24,590 (PDH – Immediate hurdle)
24,800
🔻 Support Zones:
24,400 (CDL)
24,330 ~ 24,360
24,190 ~ 24,225 (Immediate Support)
24,120
24,050
24,000 ~ 23,950
23,820
23,710 ~ 23,660
23,500
23,410 ~ 23,370
23,215
✏️ Disclaimer
This is just my personal viewpoint. Always consult your financial advisor before taking any action.
Nifty May Series ExpectedNifty Last close as expected zone 24471.30
Expected inspite of INDO-PAK pressure
Possibility upmoves slow n steadily as per marked range/
Profit booking or similar correction due to indo pak cannot be avoided
as per marked gap filling zone active till then

Nifty Trend directionNifty 24461 - Has resistance at 24687 and support at 24330.
Has given wedge pattern.
Trend decider will be 24480.

Sustaining above the NECKLINE!! As we can see NIFTY is sustaining itself above the neckline of inverted head and shoulders pattern which make it in a very diabolical place as any closing below the neckline could lead to massive fall but continuous sustainment above the given neckline could show further upmove so plan your trades accordingly and keep watching everyone.

"Nifty 50 at a Crossroads: Rising Wedge Signals Breakout or Brea* A **rising wedge** pattern is clearly forming, marked by two upward sloping blue trendlines.
* Inside this wedge:
* Multiple **price swings** (higher highs and higher lows) are visible.
* Recent breakout attempts are marked with zig-zag arrows showing potential breakout direction
📈 **Bullish Signals:**
1. **Strong Uptrend:**
* A sustained rally from \~23,000 up to the current levels (\~24,500) indicates strong bullish momentum.
2. **Breakout Potential:**
* Price is attempting to break out above the rising wedge pattern.
* Immediate **bullish target zone** is around **24,596 to 24,754**, marked with a green "Target" label.
3. **Volume Surge:**
* Recent bullish candles are supported by increased volume, suggesting real interest in the breakout.
📉 **Bearish Risks:**
1. **Rising Wedge Risk:**
* Rising wedge patterns often lead to **bearish breakdowns**.
* If the support of the wedge is broken, the **first downside target** is marked at **24,369**, and **next support** at **24,291**.
2. **Volume Divergence:**
* Although there's some volume on bullish moves, the consistency is lacking compared to the strong rally before April 23.
**Key Price Levels:**
| 24,754.90 | Resistance | Upper range of rising wedge (target) |
| 24,596.40 | Resistance | First bullish target zone |
| 24,520.00 | Minor Resistance | Recent swing high |
| 24,369.45 | Support | First bearish target if wedge breaks |
| 24,291.25 | Key Support | Critical support, below wedge trendline |
| 23,786.80 | Strong Support | Previous consolidation breakout zone |
**Conclusion:**
* The Nifty is in a **tight rising wedge**, typically a **bearish** reversal pattern. However, if bulls can push past **24,520–24,596**, it may invalidate the pattern and open further upside.
* Until a confirmed breakout or breakdown occurs, traders should remain cautious and wait for **volume-backed confirmation**.
