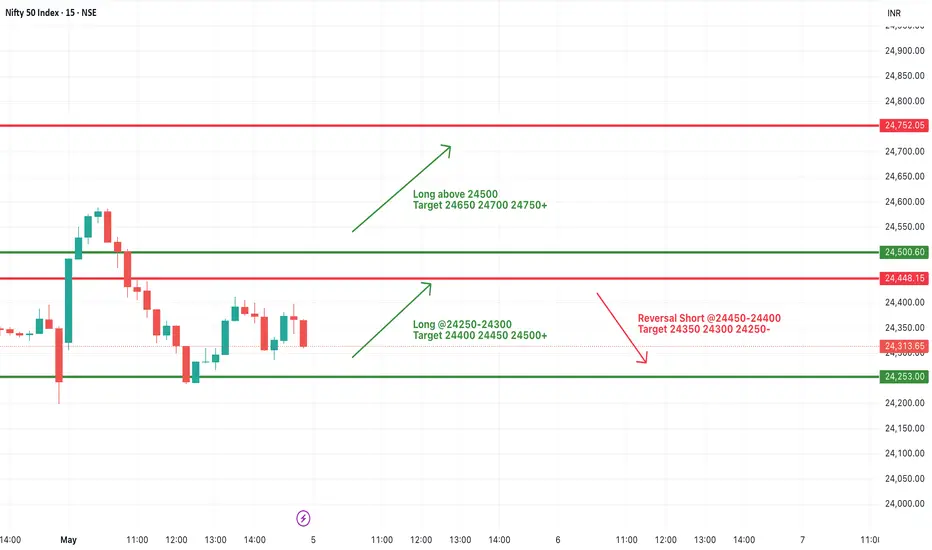
#NIFTY Intraday Support and Resistance Levels - 05/05/2025Gap up opening in nifty. Expected opening near 24450 level. After opening if nifty starts trading and sustain above 24500 level then possible strong upside rally in index upto 24750+ level in today's session. Downside 24250 level will act as a strong support for today session. Any major downside only expected below this support level.
NIFTY trade ideas
Nifty 50 If you find this helpful and want more FREE forecasts in TradingView, Hit the 'BOOST' button
Drop some feedback in the comments below! (e.g., What did you find most useful?
How can we improve?)
Your support is appreciated!
Now, it's your turn!
Be sure to leave a comment; let us know how you see this opportunity and forecast.
Have a successful week
DISCLAIMER: I am NOT a SEBI registered advisor or a financial adviser. All the views are for educational purpose only

Nifty Important Fibonacci levels from previous month closeNifty Important levels for May 2025 from previous Month close price


NIFTY50.....Buying panic all around!
Hello Traders,
the NIFTY50 has extended my cited price area to ~24620 range. It was exactly @ 24589.15 points!
Here, a wave iii (blue) ended!
Chart analysis:
If this was all of waves (5) of iii (blue), the next move could be a wave iv (blue) to around the range of 23709 to 23845.15 zone! This one should morph into an a-b-c correction, or a triangle. While triangles are the most often failed chart patterns during a wave iv of any degree is, we will focus on the a-b-c correction!
So, one higher high is still missing, but I guess the next high will be just a wave ((i)) of v (blue) with more highs to come!
As I am in a hurry, only a short update today. I'll try to publish another update by Wednesday.
Have a great Sunday.....
Ruebennase
Please ask or comment as appropriate.
Trade on this analysis at your own risk.

"Auto Support & Resistance + Fixed Range Volume Profile + Techni"Auto S&R + Volume Profile + Tech Ratings combines multi-timeframe technical signals with automatically plotted support and resistance levels. It features:
Dynamic volume-based breakout detection
Fixed Range Volume Profile with Point of Control
Pivot-based auto support/resistance levels
Multi-timeframe technical rating summary
Ideal for intraday and positional traders looking for strong confluence zones and trend confirmation."

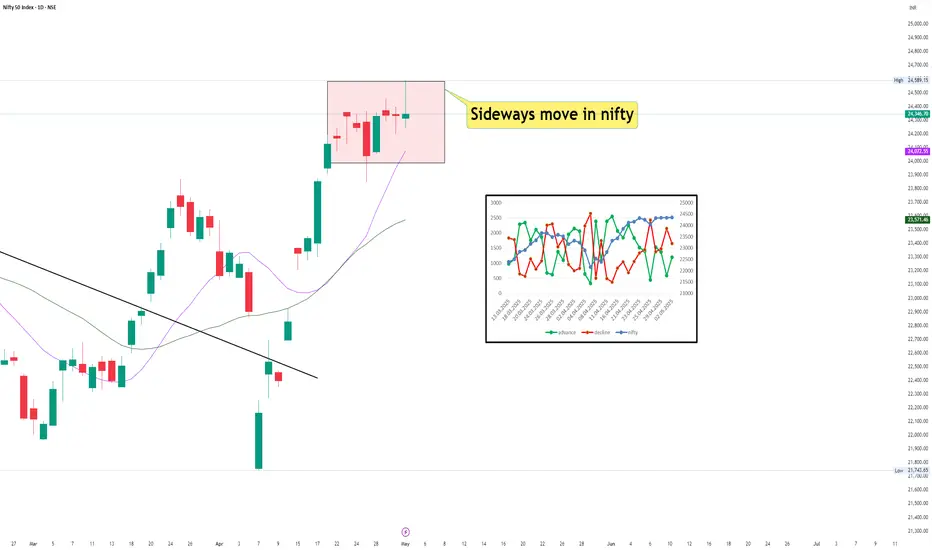
Caution time in niftyFrom few days market is going sideways in direction while number of declining stocks in market have surpassed the number of advancing stocks which shows us the underlying selling in stocks. This shows underlying weakness in stock market. This may change in future but currently need to be cautious in market. Tighten your stoplosses or trade with low position size.
Weekly Market Wrap Nifty, Mid & Small Caps, and S&P 500 OutlookNifty ended the week on a strong bullish note, closing at 24,346, up by 307 points from the previous week. The index traded within a tight range, hitting a high of 24,589 and a low of 24,054, aligning perfectly with my projected range of 24,650–23,400.
📌 Key Technical Levels to Watch:
Nifty closed just below a crucial Fibonacci resistance at 24,414.
A daily close above 24,414 next week could open the door for a sharp move towards the next major resistance at 24,770.
While my system suggests a broader range of 24,900–23,800, I personally hope for a healthy consolidation to cool off some momentum—paving the way for a stronger, faster rally in the coming weeks.
Caution Zone:
A break below 23,800 might signal the return of bears, potentially dragging the index down to test critical support at 23,200/23,100.
Midcap & Smallcap Watch:
I’ve received a lot of queries about Midcap and Smallcap indices, and here’s the honest truth—they remain in a 'no-trade' zone. Despite Nifty's strength, the rally hasn’t lifted most Mid & Small Cap stocks.
👉 Investors holding quality, fundamentally strong stocks in these segments should stay calm, but avoid high PE or overvalued stocks until we get a clear monthly buy signal on the charts.
🌍 Global Markets – S&P 500 Analysis:
The S&P 500 closed the week at 5,686, just above the strong Fibonacci level of 5,637. Sustaining above this level could lead to a rally toward 5,770/5,821. However, a failure to hold this support might trigger a 2–3% pullback, which could ripple across global markets, including India.
📣 Bottom Line:
Nifty bulls need a close above 24,414 to push higher.
Mid & Small Cap space remains tricky—stay selective.
Watch global cues, especially from the US, for broader market direction.
Stay nimble, stay informed. ✅

NIFTY Analysis for 5th MayIn M15 chart we can see market is bullish as recently candles have created BOS (Break Of Structure). So, we have to find buying opportunity. Now how can we get the long entry? For that we have to wait for a while to make the proper structure of candles.
If the price sweep the IDM (X) (Inducement) level 24197 and form any rejection candle, we can take the entry here or else we have to wait until the market hit the demand zone.
In conclusion, Demand zone entry is much safer than the previous entry.

Nifty May 1st Week AnalysisNifty is looking positive for the upcoming week, and we can expect highs of 23850-900+ if Nifty manages to close above 24550 on a daily basis. Downside risk will become more prominent if Nifty closes before 24250 on a daily candle. All levels are marked in the chart posted.

How I traded Nifty and Bank Nifty on 2-05-2025This is meaningful and descriptive analysis of how I trade indices Based on the concepts of Swings , LH and HL The backbone of this trading strategy is trend following Hope you guys learnt something out of this Ping me if you need more help with strategy

Nifty trend directionNifty as we have been posting is struggling to pass through 24349 on daily close basis. In chart it has given a raising wedge pattern with Resistance at 24547 and support at 24343

Nifty EOD Analysis – May 2, 2025 - Friday🟢 Nifty EOD Analysis – May 2, 2025 (Friday)🔴
Another day... tug-of-war between buyers and sellers
📊 Nifty Summary
Another one-day tug-of-war between buyers and sellers. As usual, morning momentum — driven by buyers and short-covering — pushed the index into a bullish zone. However, profit booking and seller dominance dragged it back down, ultimately parking Nifty again in the 24,330 ~ 24,365 zone — now the 4th straight session closing within this narrow range.
Nifty opened on a bullish note at 24,311 and launched into a swift rally, breaching multiple resistance zones and clocking a new high at 24,589 within the first hour. However, the enthusiasm faded quickly. Sellers stepped in aggressively, and all the major support levels crumbled one by one. What started as a breakout turned into a breakdown.
The index drifted lower and spent the rest of the session stuck in a narrow zone of 24,330–24,365 — now for the fourth session in a row! The close at 24,346 reflects indecision and caution ahead of next week’s events.
📌 5 Min Time FrameChart
🕔 Intraday 5-Min Chart (Price Walkthrough)
🔹 Opened at 24,311 and rallied sharply to 24,589 — breaching multiple resistance zones.
🔹 Sellers took control and dragged the index back below 24,400.
🔹 Breakdown through all major support levels including PDH, CPR, and CDL.
🔹 Post-lunch session remained directionless between 24,330–24,365.
🔹 Fourth consecutive close inside this compression zone.
📌 75 Min Time FrameChart
⏱️ Intraday 75-Min Time Frame Chart
📐 First two candles formed a bullish setup, but the third candle completely reversed the gains, forming an Inside Bar breakdown trap. The remaining candles failed to break out of the previous range, with momentum fading.
⚠️ A breakout (or breakdown) from this compression is now imminent — keep your eyes on the next session for direction.
📌 Daily Time FrameChart
🕯️ Daily Time Frame Chart & Candle Breakdown
📈 Today’s Candle Type: Spinning Top with long upper wick
🟢 Open: 24,311.90
🔺 High: 24,589.15
🔻 Low: 24,238.50
🔚 Close: 24,346.70
📊 Change: +12.50 (+0.05%)
🧠 Know Your Candle:
A Spinning Top reflects market indecision — the long wicks show strong attempts by both bulls and bears, but neither managed to dominate.
Upper Shadow: 242.45 pts → Strong selling from highs
Lower Shadow: 73.40 pts → Mild buying near lows
Real Body: 34.80 pts → Modest positive close
🔍 Interpretation:
Despite an early morning breakout, the close back in the congestion zone signals a lack of directional strength. The long upper wick reflects failure to hold higher ground — bias slightly tilting bearish unless this zone is broken with conviction.
⚔️ Gladiator Strategy Update
📌 Strategy Parameters:
ATR: 317.21
IB Range: 270.30
IB Category: Medium IB
Market Structure: Balanced
📊 Trade Summary:
✅ 1st Trade (Long): Triggered at 9:25 – Target Achieved (1:2 RR)
❌ 2nd Trade (Short): Triggered at 12:25 – SL Hit
🔮 What’s Next?
The bias remains neutral to slightly bearish. Despite a strong upside in the first hour, the repeated failure to sustain above 24,400 and four closes within 24,330–24,365 suggest exhaustion.
A breakout from this tight coil should give a clear move — wait for confirmation.
📌 Support & Resistance Levels
🔺 Resistance:
24,330 ~ 24,360 (Immediate hurdle)
24,400 (PDH)
24,457
24,480 ~ 24,540
24,589 (CDH)
24760 ~ 24,800
🔻 Support:
24,190 ~ 24,225
24,120
24,050
24,000 ~ 23,950
23,820
23,710 ~ 23,660
23,500
23,410 ~ 23,370
23,215
💬 Final Thoughts
“Range traps continue to fool both sides — momentum without conviction is just noise.”
Watch the compression zone — a genuine breakout or closing above 24,365 or breakdown below 24,225 could bring clarity. Until then, trade light and watch levels.
✏️ Disclaimer
This is just my personal viewpoint. Always consult your financial advisor before taking any action.

ema crossover and bollinger bandsoverlay of two exponential averages and bollinger bands with the signal trigger being crossover of emas.

Nifty has broken Channal resistance and now in uptrendNifty has broken Channal resistance and now in uptrend

Still in structure! Yet to break! As we can see despite the strong upmove in first half, it couldn’t close above the given structure hence we can still wait for the proper breakout and sustainment above the given structure for unidirectional move so plan your trades accordingly and keep watching everyone.

"Clean Swing Buy/Sell Labels"This custom indicator identifies swing highs and swing lows to display Buy and Sell signals directly on the chart. 🎯
📊 Key Features:
Customizable Buy/Sell label size 🏷️
Adjustable swing length and percentage move for accurate signals ⚡
Fixed Creator Info at the bottom right for attribution 🌟
💡 Perfect for:
Traders looking for clean and straightforward signals without clutter.
Customizable to fit your charting style!
🔗 Created by: @vasanthvk_13
📈 Code: Clean Swing Buy/Sell Labels (Pine Script)
💬 Feedback is appreciated!

Nifty eyeing Trendline breakout amidst uncertainty. Amidst uncertainty on Geo-Political front Nifty gave up 242 points it had gained earlier in the day. Also it bounced 108 points from the day's low to close 12 points in positive at 24346.7 in a highly volatile Friday.
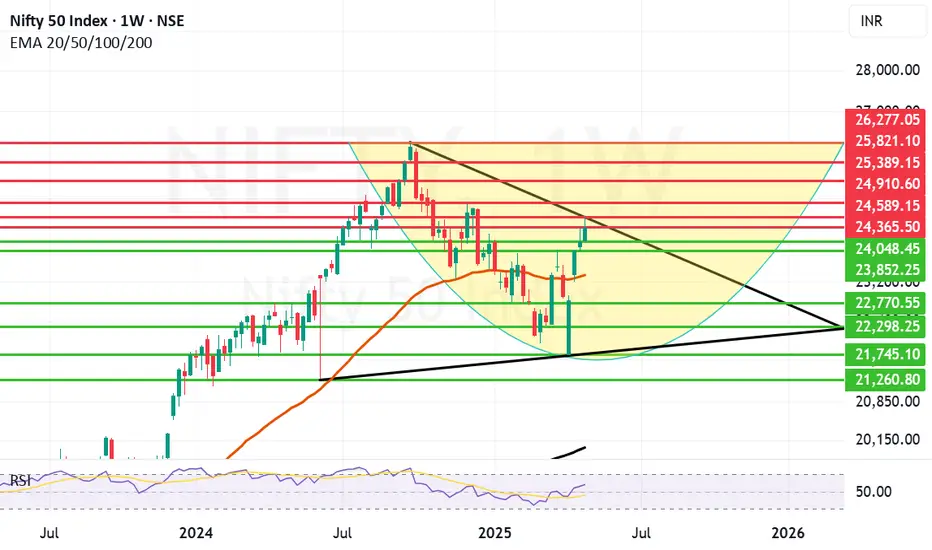
Reliance remains start of the week after posting stellar results earlier in the week. The Trendline resistance zone between 24365 and 24589 remains difficult to conquer for Nifty. Once we get a closing above 24589 can the bulls try to pull Nifty further up towards 24910 and 25K+ levels.
Incase the trend line resistance is not crossed successfully the support for Nifty remains at 24048, 23852 and 23343. As of now it looks that the level of 23343 which is the Mother line of Weekly candle chart (strong Support) can be breached only if there is flare up of incidents on the Border or elsewhere.
The situation at Indo-Pak Border remains delicate and tense that might be one reason why investors did not carry long positions into the weekend and Nifty lost most of it's gains.
Right now a lot depends on what happens between the 2 nations and surrounding region. Investment in large cap companies remains the safest option looking at the uncertainty. Even in the case of flare-up at the border these companies will be the first to bounce back after situation normalises.
Disclaimer: The above information is provided for educational purpose, analysis and paper trading only. Please don't treat this as a buy or sell recommendation for the stock or index. The Techno-Funda analysis is based on data that is more than 3 months old. Supports and Resistances are determined by historic past peaks and Valley in the chart. Many other indicators and patterns like EMA, RSI, MACD, Volumes, Fibonacci, parallel channel etc. use historic data which is 3 months or older cyclical points. There is no guarantee they will work in future as markets are highly volatile and swings in prices are also due to macro and micro factors based on actions taken by the company as well as region and global events. Equity investment is subject to risks. I or my clients or family members might have positions in the stocks that we mention in our educational posts. We will not be responsible for any Profit or loss that may occur due to any financial decision taken based on any data provided in this message. Do consult your investment advisor before taking any financial decisions. Stop losses should be an important part of any investment in equity.
Nifty levels - May 05, 2025Nifty support and resistance levels are valuable tools for making informed trading decisions, specifically when combined with the analysis of 5-minute timeframe candlesticks and VWAP. By closely monitoring these levels and observing the price movements within this timeframe, traders can enhance the accuracy of their entry and exit points. It is important to bear in mind that support and resistance levels are not fixed, and they can change over time as market conditions evolve.
The dashed lines on the chart indicate the reaction levels, serving as additional points of significance to consider. Furthermore, take note of the response at the levels of the High, Low, and Close values from the day prior.
We hope you find this information beneficial in your trading endeavors.
* If you found the idea appealing, kindly tap the Boost icon located below the chart. We encourage you to share your thoughts and comments regarding it.
Wishing you success in your trading activities!

Diametric pattern in B-wave ?Diametric pattern in B-wave ?
faster retracement upside (C-wave) will confirm.

NIFTY Index View - May 02, 2025The index has been moving sideways since last few days this week but has moved upwards with fine volume as we had analyzed on Tuesday (April 29th).
The index still looks strong enough to continue the trend further upwards.

Nifty 50 technical analysis of the day Chart Observation:
Price recently swept Buy-side Liquidity (BSL) near 24,320–24,350 zone.
After the liquidity grab, a sharp rejection confirms institutional sell-side activity.
Market structure is turning bearish as price breaks below minor support near 24,250.
Key SMC Levels:
BSL zone (Trap Zone): 24,320–24,350 (Liquidity grab completed)
Break of Structure (BoS): Below 24,250 confirms bearish bias.
Next Target - Sell-side Liquidity (SSL): 24,100 then 23,950–23,900 zone.
Fair Value Gap (FVG): 24,270–24,300 (can be retested as resistance)
---
Trade Setup:
Entry: On pullback to 24,270–24,300 (FVG / bearish OB zone)
Stop Loss: Above 24,360 (above liquidity sweep)
Target 1: 24,100 (nearest SSL)
Target 2: 23,950–23,900 (deeper SSL zone)
---
SMC Logic: After sweeping liquidity from buy-side traders, Smart Money is likely shifting to the sell-side to trap late buyers. The impulsive bearish candle confirms order flow shift.
Bias: Bearish
Strategy: Sell the pullback into premium zone

#NIFTY Intraday Support and Resistance Levels - 02/05/2025Gap up opening expected in nifty near 24450 level. Currently nifty consolidating in the range of 24250-24500 level. After opening if nifty gives breakout and start trading above 24500 level then possible strong upside rally towards the 24750+ level in today's session. 24250 level will act as a strong support for today's session. Any major downside only expected if nifty starts trading below 24200 level. Below 24200 level downside can goes upto 24000 level.
