#NIFTY Intraday Support and Resistance Levels - 29/04/2025Gap up opening expected in nifty near 24450 level. After opening if nifty starts trading and sustain above 24500 level then possible strong upside rally towards the 24750+ level in today's session. Any downside or reversal expected near 24450 level. Downside 24250 level will act as a strong support for today's session.
NIFTY trade ideas

NIFTY: Impulse formationNifty is rising in an impulsive manner of which 4th wave is already concluded at 23847 zone and currently trading under wave-5. This shall take the index towards 24875 zone where wave-5 becomes equal to wave-1.

Forming INVERTED H&S pattern in smaller time frame! As we can see NIFTY recovered strongly influenced by RIL result but we are still weak below the supply zone hence unless the high is broken every rise can be sold unless the high the broken then a strong uptrend can se been in NIFTY as it can be seen forming an inverted head and shoulders pattern and its neckline has been tested multiple times now hence any closing above the given structure could show unidirectional rally so plan your trades accordingly and keep watching.

Nifty Elliott wave update for 29april Tuesday onwardsIn this Video I have explained Elliott wave analysis of Nifty on 3hour, 15 min chart and 5min chart in detail to conclude what are the possible scenarios possible in Nifty index from 29april Tuesday onwards.... Kindly watch full video for detail understanding. It will help you to understand how to use Elliott wave theory practically on charts.
Thank you for watching....

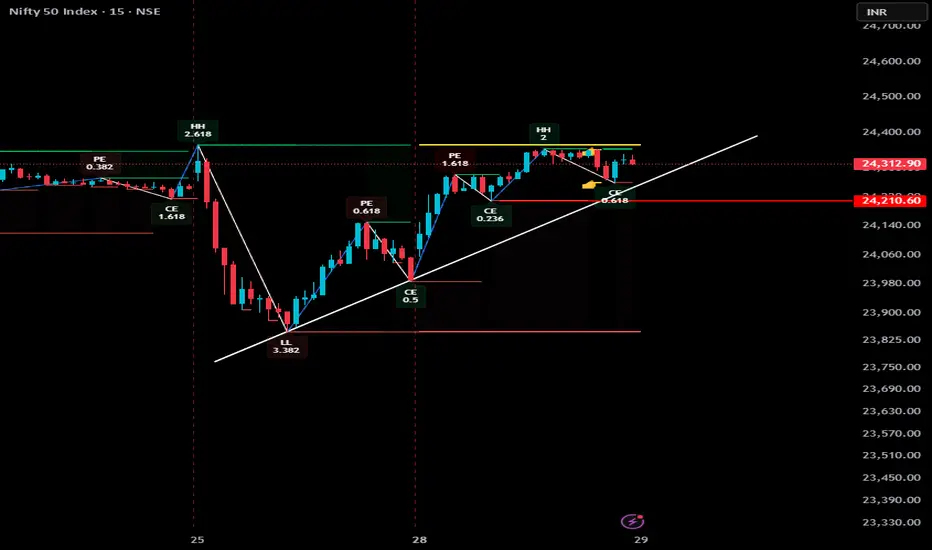
Nifty break 24210 or @ brekout Many traders were expecting a market fall — a small correction in Nifty — but as usual, it moved towards Friday’s high.
On the chart, strong support is seen around 24,210.
If 24,210 breaks, a good retracement can be expected.
If today’s high is broken, the next level could be around 24,600.
Nifty on the verge of Trendline Breakout. There is a major possibility of a Trendline Breakout amidst the rumblings on conflict with enemy nations. The main reason for Market rally today was Superb results posted by Reliance and a rally in PSU, Capital goods and defense related stocks. A lot of stocks that were oversold in the knee-jerk reaction on Friday also tried to catch-up. As the situation on the border remains tense we can have a sudden major decline as a reaction to the Geo-Political proceedings. Thus investors are asked to remains cautious and not to carry heavy derivative positions overnight. Even in the eventuality of a war actually happening one think of remaining invested in companies that can bounce back faster once the situation de-escalates.
Major Supports for Nifty on daily chart now remain at: 23988, 23708, 23415 (Major Father line support), 23325 (Major Mother Line Support) in case of Mother and Father line failing Bears can drag Nifty further down to 22875, 22142 and 21844.
Major Resistances For Nifty remain at: 24359 (Major Trend line resistance), 24538, 24816 (Is another major resistance on Fibonacci scale), If we get a closing above 24816 Nifty can easily flow towards 25183, 25399 and 25603.
Disclaimer: The above information is provided for educational purpose, analysis and paper trading only. Please don't treat this as a buy or sell recommendation for the stock or index. The Techno-Funda analysis is based on data that is more than 3 months old. Supports and Resistances are determined by historic past peaks and Valley in the chart. Many other indicators and patterns like EMA, RSI, MACD, Volumes, Fibonacci, parallel channel etc. use historic data which is 3 months or older cyclical points. There is no guarantee they will work in future as markets are highly volatile and swings in prices are also due to macro and micro factors based on actions taken by the company as well as region and global events. Equity investment is subject to risks. I or my clients or family members might have positions in the stocks that we mention in our educational posts. We will not be responsible for any Profit or loss that may occur due to any financial decision taken based on any data provided in this message. Do consult your investment advisor before taking any financial decisions. Stop losses should be an important part of any investment in equity.

Nifty V Top ready to explode ?Nifty 24328 has given a V Top Pattern which is a reversal pattern. Neck Line is at 23960.

Nifty 24170-24360 range breakout to provide an directional move.Trend: Moderately bullish.
Trigger point: 24,360 breakout.
Above 24,360: Strong bullish breakout into a fresh zone.
Below 24,170: Caution advised — bias would weaken.
Volatility: Dropping — favoring smoother, more controlled moves rather than choppy swings.
Momentum: Building but needs further confirmation from RSI 21-SMA reversal.

Nifty Analysis EOD - 28th April 2025🟢 Nifty Analysis EOD - 28th April 2025 🔴
Nifty almost retraced 25th April’s fall — Back to Square One... What Next?
📈 Market Summary
Nifty almost retraced 25th April’s fall — Back to Square One... What Next?
As highlighted in previous sessions, the 24,330 ~ 24,360 zone once again proved to be a crucial resistance. Today, along with the past three sessions, we observed Nifty struggling to breach this wall — a fact clearly visible on the 75-minute time frame chart.
Now the big question:
➡️ Tomorrow, can Nifty decisively breach 24,365 and sprint towards 24,500?
Well, time will answer, but we must stay prepared for moves on either side.
Intraday Walk:
Nifty opened with a gap-up above the psychological 24,000 level at 24,070.
With a slow yet steady bullish pace, it hit a high of 24,355.
After touching this critical resistance, it spent almost 2 hours consolidating in the same zone.
Finally, it closed at 24,312, defending most of its intraday gains — a strong show of resilience by the bulls.
🕯 Daily Candle Structure
Today's Candle:
🟢 Strong Bullish Candle (Almost a Marubozu)
Open: 24,070.25
High: 24,355.10
Low: 24,054.05
Close: 24,328.50
Change: +289.15 points (+1.20%)
Key Observations:
The session opened slightly above yesterday’s close and dipped just marginally.
Buyers took charge from the very beginning, consistently pushing the index higher.
Close near the day's high signals robust bullish momentum.
The candle has a tiny lower shadow and minimal upper shadow, indicating persistent buying throughout the day.
What It Implies:
Clear bull dominance.
Willingness among buyers to step up even at higher levels.
If external cues remain supportive, momentum could continue into the next session.
🛡 Gladiator Strategy Update
ATR: 344.11
IB Range: 182.1 (Medium IB)
Market Structure: Balanced
Trade Highlights:
1st Trade: Long Entry triggered at 10:05 AM — SL Hit
2nd Trade: Long Entry triggered at 11:25 AM — 1:2 Target Achieved
Additional Trade (Discretionary Contra): Short Entry at 14:15 PM — 1:1.4 Target Achieved
🧾 Index Performance Snapshot
Nifty 50: +289 Points (+1.20%)
Bank Nifty: +768 Points (+1.41%)
Nifty 500: +254 Points (+1.16%)
Midcap: +870 Points (+1.62%)
Smallcap: +130 Points (+0.78%)
📍 Key Levels to Watch
Resistance Zones:
🔹 24,330 ~ 24,360 (Immediate hurdle)
🔹 24,480 ~ 24,540 (24,500 psychological level inside this zone)
🔹 24,800
Support Zones:
🔹 24,190 ~ 24,225 (Immediate support)
🔹 24,120
🔹 24,050
🔹 24,000 ~ 23,950
🔹 23,820
🔹 23,710 ~ 23,660
🔹 23,500
🔹 23,410 ~ 23,370
🔹 23,215
🎯 Final Thoughts
"Structure is key. When levels work, respect them. When they break, adapt."
The current structure indicates bulls have made a strong comeback, but remember — 24,330 ~ 24,360 remains the battleground. Only a decisive breakout above can ignite a rally towards 24,500+. Otherwise, we stay watchful for possible reversals.
Stay sharp, stay prepared!
✏️ Disclaimer ✏️
This is just my personal viewpoint. Always consult your financial advisor before taking any action.

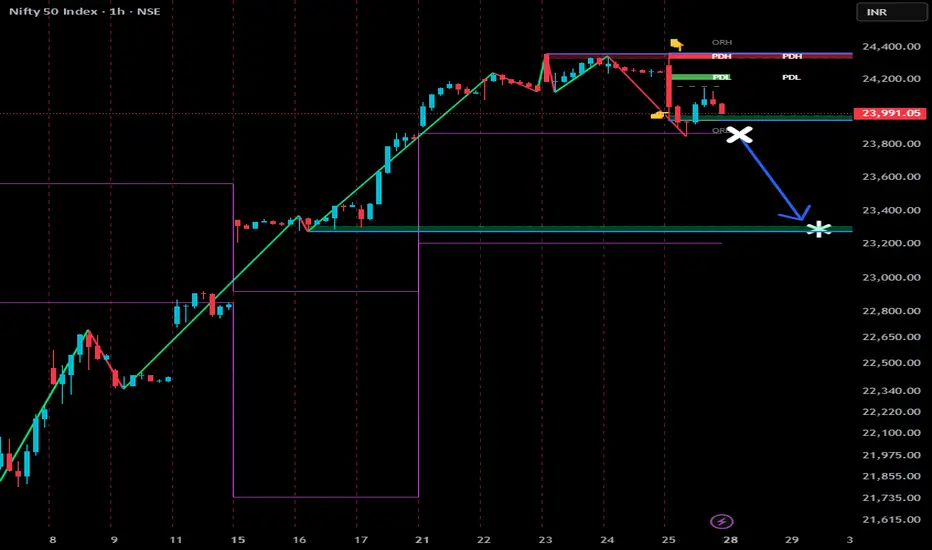
NIFTY 50 - Short-Term AnalysisChart Structure Overview:
Pattern Formation:
NIFTY has completed an Expanding Triangle pattern at the top.
Before starting the Expanding Triangle, a Final Exhaustion Gap was created — typically a strong signal of trend reversal.
Volume Behavior:
During the Expanding Triangle, volume gradually decreased, indicating loss of momentum.
Volume pattern confirms the weakening of the uptrend.
GAP Analysis:
Past continuation gaps have driven the uptrend.
Now, the final gap behaves as an Exhaustion Gap — signaling potential trend reversal.
Expectation: Another confirmation gap to open on the downside to validate the reversal.
Price Expectations:
Target Level Comments
Target 1 23,300 First major support zone
Target 2 22,800 Stronger support zone aligning with previous Fibonacci projections
Immediate downside move expected after a minor bounce/confirmation setup near the current zone (~24,300–24,400).
Technical Key Points:
Expanding Triangle Completed: Market structure topped out.
Exhaustion Gap Formed: Clear early sign of exhaustion.
Volume Decreasing: Confirming distribution phase.
Past GAP Analysis:
Continuation Gaps drove the trend up.
Final GAP now signals a possible major trend change.
Summary:
NIFTY appears to have completed its up-move after forming a final exhaustion gap.
The loss of momentum inside the expanding triangle pattern, coupled with the exhaustion gap at the top, signals that a short-term bearish reversal is highly probable.
In the coming days, once the market confirms the downward structure (especially if a downside gap occurs), a sharp fall toward 23,300 and then 22,800 can be expected.
Short-term trend: 🔻 Bearish below 24,600.
Disclaimer:
This analysis is for educational and information purposes only. Not investment advice. Always trade with strict risk management.

Nifty levels - Apr 29, 2025Nifty support and resistance levels are valuable tools for making informed trading decisions, specifically when combined with the analysis of 5-minute timeframe candlesticks and VWAP. By closely monitoring these levels and observing the price movements within this timeframe, traders can enhance the accuracy of their entry and exit points. It is important to bear in mind that support and resistance levels are not fixed, and they can change over time as market conditions evolve.
The dashed lines on the chart indicate the reaction levels, serving as additional points of significance to consider. Furthermore, take note of the response at the levels of the High, Low, and Close values from the day prior.
We hope you find this information beneficial in your trading endeavors.
* If you found the idea appealing, kindly tap the Boost icon located below the chart. We encourage you to share your thoughts and comments regarding it.
Wishing you success in your trading activities!
Live buying signal in Nifty 24275Live Khareedo (Buying) signal in Nifty at 24275, lets see how long it will go up.
Note: This is not a buy/sell trade call. trade at your own will and analysis. Use stop loss.

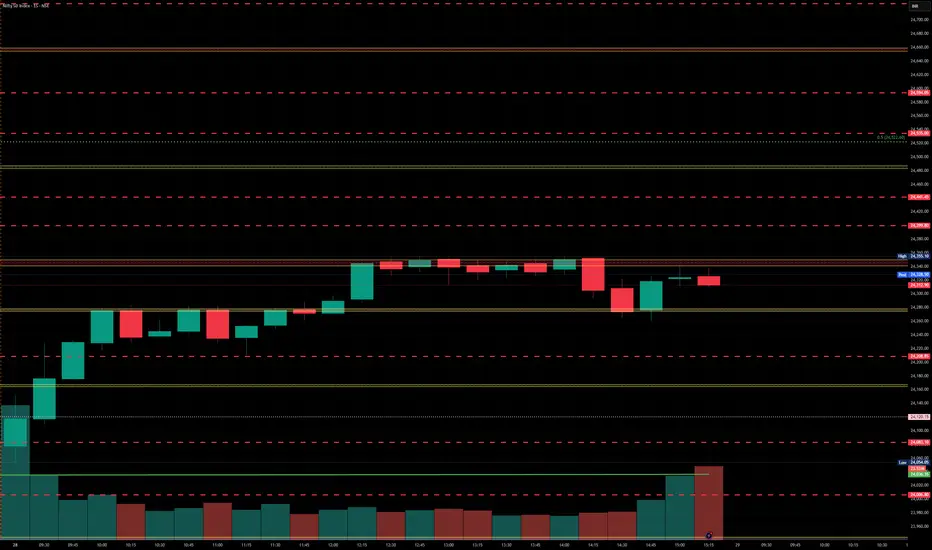
let it be cross & sustained above 24350 leveltoday 28 April market showing strengths after little correction on Friday, yeah ofc market mode is still bullish but see BULLISH LEG 1 mention on chart below avg. traded volume not supporting price same Today BULLISH LEG 2 also have below avg. volume noticed, same you can noticed on 23 April when market was going up below avg. volume before falling , so if nifty really bullish pls let it be cross and sustained above 24350 level

#NIFTY Intraday Support and Resistance Levels - 28/04/2025Nifty will open gap up in today's session. Expected opening near 24200 level. After opening if 24150-24250 zone will act as a consolidation for today's session. Any strong upside rally only expected if nifty starts trading and sustain above 24250 level. Downside movement expected if nifty starts trading below 24150 level. Below this level downside move expected upto 23850 support level in today's session.

NIFTY 50 NIFTY
Nifty chart look bearish go for down side only till 23666 if look for bullish trade then go with small risk.
You may trade your instinct but experience also hold some value so plan your trade smartly.

Weekly candle close is here! Bearishness to start!!?As we can see NIFTY has formed signs of indecisiveness in bigger time frame as we had been waiting for weekly candle close in the structure making it look weak. Now our view just shifts from buying on dips to selling on rise till it closes above the previous high and hence keeping small stop losses we can make new fresh selling positions here for bigger targets so plan your trades accordingly and keep watching everyone.

Nifty Trend directionNifty 24039 has hit the resistsance and shown reversing signals. A drop to 22600 is imminent. If taregt1 unable to hold target 2 would be 21400.

How India's Market performed during war like situtation ?espite facing wars, cross-border tensions, and unexpected shocks, the Indian stock market has consistently demonstrated remarkable resilience.
🔹 Kargil War (May–July 1999)
Index declined 9.3% from 1,084 to 916 but rebounded sharply — hitting 1,201 the next month, and soaring 40%+ by war's end.
🔹 Surgical Strikes (September 2016)
Short-term 1–2% dip, with a deeper 12.9% correction by November 2016. But markets recovered strongly, rallying 22%+ over the next 3 months.
🔹 Cross-border Tensions (February 2019)
Small dip of 1–2%, with Nifty swiftly rebounding from 10,500 levels in February to above 12,100 by June.
📊 The message is clear:
Short-term volatility happens.
Long-term resilience wins.
Stay invested. Stay informed.
Trust the process.

NIFTYNIFTY
MTF Analysis Proximal TradeZone
NIFTYYearly Demand 18887 BUY
NIFTY 6 Month Demand 21801 BUY
NIFTYQtrly Demand BUFL 22526 BUY
NIFTYMonthly Demand 23110 BUY
NIFTYWeekly Demand -DMIP 22180 BUY
NIFTYWeekly SOE 23049 BUY
NIFTYDaily Demand DMIP LHS 22261 BUY
GANN Analysis Average TradeZone
NIFTY LONG & Trail Above 23585 Stay Long
NIFTY SHORT & Trail Below 23300 Stay Short
Currently in Weekly Supply Zone 24720 24450 Short
NIFTY SHORT-Entry 1 24,450
SL 24,720
RISK -270
REWARD -658
Target as per Entry 23,792
Last Demand 23,049
Last Low 22,720
NIFTY LONG Trade Plan
NIFTY LONG-Entry 1 23,049
SL 22,720
RISK 329
REWARD 7,114
Target as per Entry 30,163
Last High 26,277
Last Low 22,720

Nifty 50 Elliot Wave Analysisnifty 50 elliot wave analysis daily time frame chart . price move upside correction Wave A,B or C . Wave A,B or C almost complete and price come down

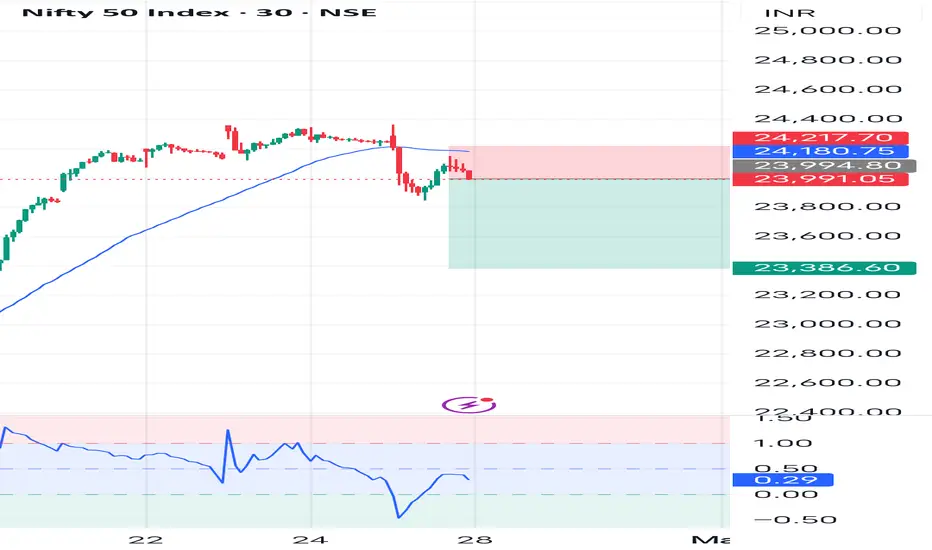
Nifty50 View .....TechnicallyNifty50 Daily Outlook
After a sharp recovery, Nifty50 is showing signs of exhaustion. A sell opportunity may arise near 24000 levels.
Trade Plan:
Sell Entry: Around 24000
Target: 23380
Stoploss: 24220
If Nifty sustains below 24000, a pullback toward 23380 looks likely. Maintain strict stoploss and manage risk carefully!!
Nifty Wkly Market Outlook: Bulls Regain Momentum Amid key brkoutThe Indian benchmark index Nifty 50 ended the week on a strong note, closing at 24,039, marking a robust gain of nearly 200 points from last week's close. During the week, Nifty made a high of 24,365 and a low of 23,847, trading perfectly within the anticipated range of 24,414 – 23,200, as projected in our previous analysis.
Importantly, the index managed to secure a weekly close above the psychological resistance level of 24,000, signaling a possible continuation of bullish momentum. As we head into the next trading week, the bulls are expected to have the upper hand, provided Nifty stays above 23,700. A daily close below 23,700, however, could shift sentiment in favor of the bears, exposing key support zones at 23,400 and 23,200.
Looking ahead, traders and investors should watch for price action within the broader range of 24,650 to 23,400. If the bulls manage to break and sustain above the critical Fibonacci resistance level of 24,414, we could see an upside move toward 24,650 and even 24,770.
On the global front, the S&P 500 index also delivered a strong performance, closing at 5,525, up a significant 250 points from the previous week. As highlighted earlier, the bullish W pattern on the charts has played out well, driving momentum higher.
If the S&P 500 sustains above the key breakout level of 5,551, it could potentially rally further to test resistance at 5,638, 5,670, and 5,715. However, a break below 5,391 may invite selling pressure, dragging the index down to test supports at 5,368, 5,327, or even 5,246, which could trigger a negative ripple effect across global markets.
Key Takeaways:
Nifty bullish above 24,000; watch 24,414 for breakout confirmation.
S&P 500 bullish continuation above 5,551; potential to test 5,715.
Bearish reversal levels to monitor: 23,700 for Nifty and 5,391 for S&P 500.

Nifty towards new ATH or correction mode.Nifty towards new ATH or correction mode.
Nifty Now, what’s next?
If the low of Friday, 25th April is breached, we may witness a deeper correction as indicated on the charts.
Traders should stay cautious and closely monitor the price action around key support levels.
A sustained break below the recent low could trigger further downside, while holding above it might invite fresh buying interest.