Nifty took support at the Mother line and trying to recoverNifty has taken support at the Mother line today and tried to post a recovery. Again proving our Mother, Father and small Child theory correct. To know more about the Mother father and small Child theory of stock market. Read my book THE HAPPY CANDLES WAY TO WEALTH CREATION. Nifty during the day made a low of 25378 and closed the day at 25453. It is not a strong recovery nevertheless the recover of 75 points recovery which makes shadow of the candle neutral to positive. Let us see if Nifty can recovery fully tomorrow or Friday to close the week in positive.
Nifty Supports remain at: 25396 (Mother Line Support which is also near the trend line support at 25378), there there is a support at 25245 and finally mid channel support near 25177. Closing below 25177 will make the Bears more powerful and they can drag the index further down towards Father line support near 25108.
Nifty Resistances remain at: 25470, 25528 (Trend line resistance), 25603 and finally 25679. 25759 seems to be the channel top currently in the hourly parallel channel.
Disclaimer: The above information is provided for educational purpose, analysis and paper trading only. Please don't treat this as a buy or sell recommendation for the stock or index. The Techno-Funda analysis is based on data that is more than 3 months old. Supports and Resistances are determined by historic past peaks and Valley in the chart. Many other indicators and patterns like EMA, RSI, MACD, Volumes, Fibonacci, parallel channel etc. use historic data which is 3 months or older cyclical points. There is no guarantee they will work in future as markets are highly volatile and swings in prices are also due to macro and micro factors based on actions taken by the company as well as region and global events. Equity investment is subject to risks. I or my clients or family members might have positions in the stocks that we mention in our educational posts. We will not be responsible for any Profit or loss that may occur due to any financial decision taken based on any data provided in this message. Do consult your investment advisor before taking any financial decisions. Stop losses should be an important part of any investment in equity.
NIFTY trade ideas

Multi timeframe Pullback reversal entriesThis is very simple but yet effective way of trading. Entry through Multi timeframe analysis. Price riding on MA ( respecting MA levels) and at Pullback - we can enter at reversal in lower time frame once price started riding MA. Though this is very basic - but very effective as this can be applied in timeframe. The sync between higher and lower timeframe for entry. We can exit as per out trade rules - either lower TF MA breach or Higher TF. Entry with proper calculation of Risk Reward only. This is the basic strategy of trend following specially for learners and practicing trading. Even season traders use this. MA period can be arranged as per suitability. Here I have applied 30/50.
This for educational and learning purpose only. Enter trading post proper practice only.
Views are highly welcome.

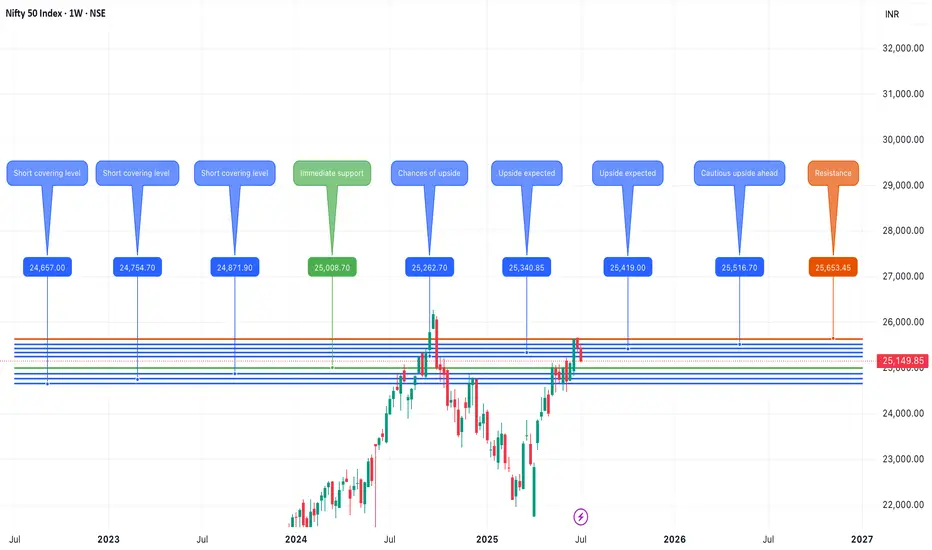
#Nifty - 1500 Points Move Expected?Date: 20-05-2025
#Nifty Current Price: 24683.9
Mid-Point: 24805.35
Upside Targets: 25645.39, 26048.95, 26515.30 and 26981.65
Downside Targets: 23966.86, 23561.75, 23095.40 and 22629.05
Support: 24371.97
Resistance: 25241.83

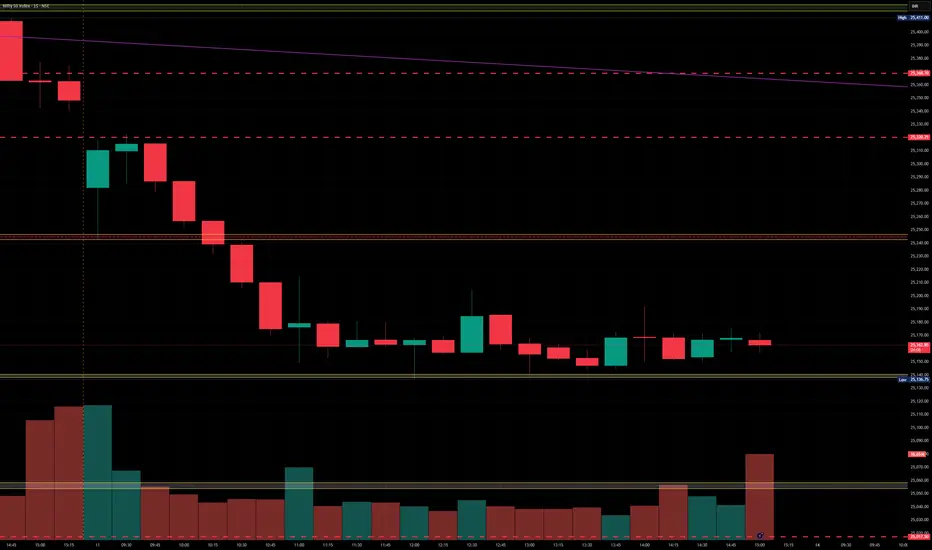
Nifty levels - Jul 02, 2025Nifty support and resistance levels are valuable tools for making informed trading decisions, specifically when combined with the analysis of 5-minute timeframe candlesticks and VWAP. By closely monitoring these levels and observing the price movements within this timeframe, traders can enhance the accuracy of their entry and exit points. It is important to bear in mind that support and resistance levels are not fixed, and they can change over time as market conditions evolve.
The dashed lines on the chart indicate the reaction levels, serving as additional points of significance to consider. Furthermore, take note of the response at the levels of the High, Low, and Close values from the day prior.
We hope you find this information beneficial in your trading endeavors.
* If you found the idea appealing, kindly tap the Boost icon located below the chart. We encourage you to share your thoughts and comments regarding it.
Wishing you success in your trading activities!

Nifty levels - Jul 04, 2025Nifty support and resistance levels are valuable tools for making informed trading decisions, specifically when combined with the analysis of 5-minute timeframe candlesticks and VWAP. By closely monitoring these levels and observing the price movements within this timeframe, traders can enhance the accuracy of their entry and exit points. It is important to bear in mind that support and resistance levels are not fixed, and they can change over time as market conditions evolve.
The dashed lines on the chart indicate the reaction levels, serving as additional points of significance to consider. Furthermore, take note of the response at the levels of the High, Low, and Close values from the day prior.
We hope you find this information beneficial in your trading endeavors.
* If you found the idea appealing, kindly tap the Boost icon located below the chart. We encourage you to share your thoughts and comments regarding it.
Wishing you success in your trading activities!

Nifty is Bearish for next week. But Why ? "Ask me in comments".Nifty is facing resistance at this level for a specific reason. this week it can be bearish and continue to go down side.

#NIFTY Intraday Support and Resistance Levels - 01/07/2025Nifty is expected to open with a slight gap up near the 25,550 level, which lies close to a minor resistance zone. If the index manages to sustain above this region, we may see a continuation of bullish momentum with potential upside levels at 25,600, 25,650, and 25,700. Holding above 25,550 would signal strength, supported by recent recovery attempts from lower levels.
However, if the index fails to hold above 25,550 and starts slipping below 25,450, weakness may creep in. A fall below 25,450 could open the door for downside targets of 25,350, 25,300, and possibly 25,250. Traders should stay cautious around the 25,550–25,600 zone for a clear directional move, with strict stop losses on both sides.

Nifty 50 index chart analysis for tommorrowHere I m sharing of Nifty 50 index chart for 3rd July 2025, in chart you can see many boxes that are indicating of Support and Resistance. if break then you trade buy or sell. you can understand
....

NIFTY is Testing its long term Trend Line.I’ve been keeping an eye on the ‘Watch Out’ area and the trend line that’s being tested. I’ve been following this trend line for a while now, and I’m excited to share some potential scenarios that could unfold in July.
Here are a few things to keep in mind:
1. The 25450 - 25550 range could become a key resistance and support area.
2. If NIFTY successfully retests this trend line and shows some upward movement, the next target could be 26000. In this case, I would recommend buying July 26000 Call options.
3. If NIFTY can’t hold this retest (which is less likely given NSE:NIFTY the current bullish market sentiment), our next watchout zone could be 25000 - 24800.
4. We might even be seeing an all-time high NIFTY soon!
Disclaimer: Please do your own research before investing. This is just my personal opinion, and I don’t force anyone to invest based on my ideas.

NIFTY50.....Next move to ATH!Hello Traders,
The NIFTY50 has shown breake out of the trendchannel vs triangle structure! It has risen to my cited target area @ 25260 to 25300 points and overcome the targets as well!
Another goal!
Chart analysis:
The ATH @ 26277 points will be the next target, and as I wrote many times, this will be not the end of the structure. I will refrain from mentioning any further goals for the time being.
So, the next move should lead N50 to new ATH`s well above the 26277 range. The potential is given for another long-term wave!
On the downside there is, not so much, potential for a corrective move. While the structure doesn't look complete, I think for at maximum downside potential to 23935 area! It should come, but not yet!
More often than not, the diverging trend lines, possibly created by the triangle structure, will be touched again in the next 1-2 weeks! Well, we will see if so to come, and if...we will judge again!
Caused by a busy weekend, this should be all for today!
Have a great week.....
Ruebennase
Please ask or comment as appropriate.
Trade on this analysis at your own risk.

nifty 50 intrady trading ideatoday we got 3 trade and showing you through chart.
how to took?
booked profit on support.

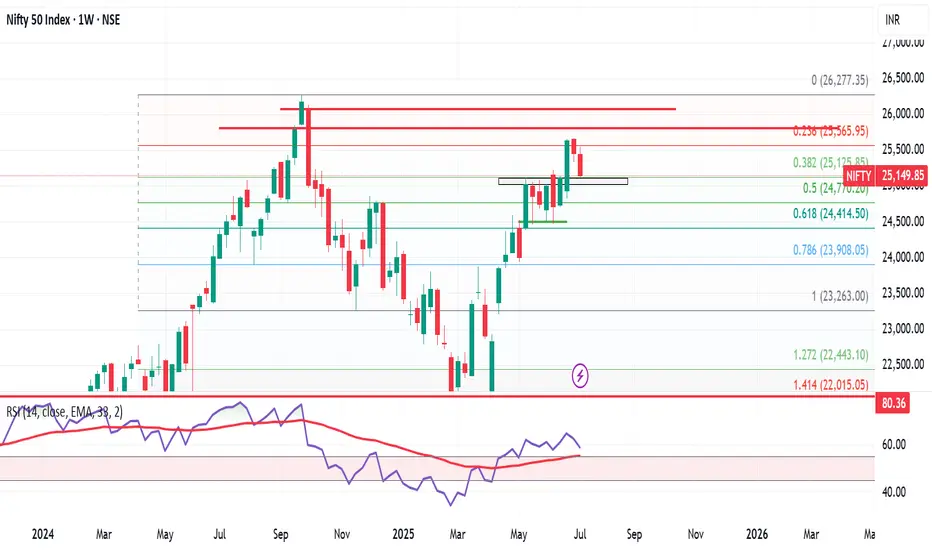
NIFTY Nearing Long-Term Resistance | RSI Divergence + Volume Anc📌 Chart: NIFTY – Monthly TF
I'm observing 3 major signals that could define the next few months for NIFTY:
1️⃣ Price Stretched Far from Anchored Averages (AVs):
Price is trading significantly above all major anchored levels — showing trend strength, but also a high risk of reversion if momentum weakens.
2️⃣ RSI Bearish Divergence Developing:
While NIFTY approaches the 26,000 zone, monthly RSI is diverging — a classic sign of slowing upside strength, often seen at major cycle tops.
3️⃣ Anchored Volume Node at ~17,788:
High volume accumulation took place here before the current rally. If correction begins, this level could act as structural support or a re-entry base.
⏳ My Conclusion:
We may be in the final leg of the current bullish run. 26,000 is a key psychological + technical level. I'm watching for exhaustion signs in July. If divergence plays out, a retest of AVs or volume anchor around 17,788 is not unlikely.
📉 Long-term caution with a plan to hedge or rotate into defensive themes may be wise.
💬 Would love to hear your thoughts — is this the early sign of a cycle top, or just another pause?

#NIFTY Intraday Support and Resistance Levels - 30/06/2025Nifty is expected to open on a flat note near the 25,630 zone. The market has shown strong bullish momentum in recent sessions, and prices are now hovering near the upper resistance band of 25,750. If Nifty manages to break and sustain above the 25,750 level, a fresh upward move can be expected, with targets around 25,850, 25,900, and 25,950+. This could offer good long opportunities, especially above the 25,750–25,770 breakout range.
On the downside, if Nifty faces resistance around 25,750 and starts to reverse from that level, a short opportunity could emerge in the 25,750–25,700 zone. In such a case, reversal targets can be seen at 25,650, 25,600, and 25,550. Support at 25,550 will act as a crucial level to watch.

Market Recap: Nifty Breaks Out After 5 Weeks of Consolidation!The Indian stock market saw a strong bullish move this week, with Nifty 50 closing at 25,637, marking a significant gain of 525 points from the previous week's close. The index made a high of 25,654 and a low of 24,824, finally breaking out of the key resistance zone of 25,000–25,100 after five weeks of sideways consolidation.
This breakout is a critical technical development, signaling renewed strength in the broader market. However, to sustain this momentum and target the all-time high zone of 26,134–26,277, Nifty may need to either:
Consolidate within the previous week's range of 25,650–24,800, or
Retest the breakout level near 25,200 for confirmation.
Failing to do so could make this breakout a false one.
Weekly Outlook for Nifty:
For the coming week, the expected trading range is between 25,200 and 26,150. Price action around these levels will be key to watch.
On a broader sectoral view, out of 14 NSE indices, only Nifty Financial Services is showing relative strength on the monthly chart—a potential red flag for sustained bullish sentiment. When just one sector leads while others lag, it's often a sign to remain cautious.
Strategy Suggestion:
Consider booking partial profits and trailing stop losses on the remaining positions. Until the monthly time frame turns decisively bullish, it's wise to stay alert and manage risk actively.
Global Markets: S&P 500 Breaks Out!
In the U.S., the S&P 500 surged to close at 6,173, successfully breaking above its key resistance level at 6,013. This breakout, if sustained above 6,150 next week, opens up the path toward higher targets: 6,225 / 6,376 / 6,454 / 6,500.
However, traders should remain flexible. If the breakout fails, we could see a pullback to support zones near 6,013 or even 5,899.
Pro Tip:
Be ready to switch trading positions quickly if the breakout doesn’t hold—volatility is still very much in play in both Indian and U.S. markets.

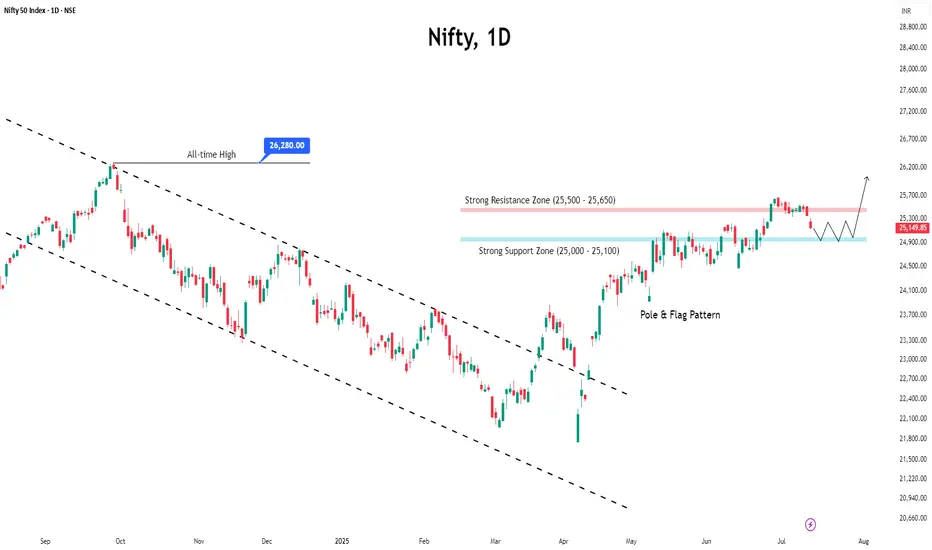
Nifty : Strong Breakout MomentumBreaking out from a 5‑week consolidation, The Nifty ended positively.
Fading geopolitical tensions & Rising FII long-short ratio and futures rollover suggest bullish sentiment.
With key time-based levels and technical thresholds in focus, we could see Nifty scale toward 26,000 📈
📌 There is also a Poll & Flag pattern breakout visible on higher time frame. Which indicates targets towards 27200 / 28000.
These upper range open once Nifty starts sustain above ATH oh Daily & Weekly time frame on medium term

Nifty 500 points upside due in 5 days ??Pattern Type:
The structure is a Diametric pattern (7 legs) labeled A-B-C-D-E-F-G, currently expecting Wave G to unfold.
✅ Wave Details Noted on Chart:
Wave A: Took 5 days and moved ~500 points.
Wave B to E: Forming the characteristic bow-tie shape of a Diametric.
Wave F: Seems to have just completed or is near completion.
Wave G (Forecasted): Expected to mirror Wave A in both price and time (5 days / 500 points), suggesting a potential upward move from current levels.
🧭 Trendline Insights:
A red resistance trendline connects tops (Wave C to Wave E).
A black support trendline spans from the origin to Wave D and likely acts as support for Wave F.
Price is currently near the lower boundary, hinting at a possible reversal point.
💬 Annotations Highlight:
"Nifty ABC: selling target is almost completed" → suggests bearish move has played out.
"Wave G will replicate both price and time" → implies a measured bullish move is anticipated.
The substructure inside E-F is detailed as A1-B1-C1-D1-E1-F1-G1, possibly hinting at an internal smaller diametric or triangle.
🔮 Projection:
A bullish reversal (Wave G) is expected next.
Potential upside: ~500 points over 5 days (same as Wave A).
Support at the trendline and structure suggests this is a critical zone for bounce.
✅ Summary in One Line:
Nifty appears to be completing a Diametric (7-leg) corrective pattern, with Wave G projected next — likely an upward move matching Wave A’s time and magnitude (~500 pts / 5 days), assuming Wave F is now done.

Nifty Dips, Suggests Range-Bound Movement AheadIndian markets ended the week with a decline of nearly one percent, driven by lingering concerns over global tariffs and a weak start to the earnings season.
The 25,500 level has now turned into a strong resistance zone, marked by heavy call writing, while 25,000 continues to act as a solid support level backed by significant put writing.
Given these dynamics, the index is likely to enter a consolidation phase, with upcoming earnings announcements expected to keep sectoral volatility elevated.
Nifty July 3rd Week Analysis Nifty is looking uncertain at the moment , and we can expect a highly volatile week ahead for Nifty. Upside momentum can be trusted only if Nifty crosses and sustains above 25320, and it can continue upside momentum upto 25600-650. On the downside, if Nifty breaches 25050-24950, then we can expect a downtrend upto levels of 24750-650.
Nifty at Make-or-Break Zone: What to Expect Next Week Markets eMarkets ended the week under pressure, with the Nifty 50 closing at 25,149, down 312 points from the previous week. The index traded within a tight band, hitting a high of 25,548 and a low of 25,129 — perfectly respecting the 25,900–25,000 range mentioned in last week’s analysis.
Now, Nifty finds itself at a crucial support level near 25,000. A rebound from this zone could trigger a short-term rally towards 25,500–25,600, which will act as immediate resistance. However, traders should proceed with caution, as the monthly chart remains neutral to bearish, indicating that this could just be a temporary bounce rather than a sustained uptrend.
Looking ahead, expect Nifty to trade within a range of 24,700 to 25,600. A breakdown below 24,700 could open the gates for deeper cuts, while a breakout above 25,600 needs to be backed by strong volume and participation to confirm a trend reversal.
Sector Watch: Reliance Shines Amidst Caution
Among the large caps, Reliance Industries stands out as the only stock showing strength on the monthly chart, while other heavyweights and key sectors continue to lack momentum. This narrow leadership is a red flag for broader market sustainability.
Global Markets: S&P 500 at a Crossroads
Globally, the S&P 500 closed at 6,259, down slightly from last week. What’s more important is the formation of a Doji candle — a classic sign of indecision. A move above 6,300 could lead to upside targets of 6,376 / 6,454 / 6,500, which would likely boost sentiment in global and Indian equities.
However, if the index slips below 6,150, it would mark a failed breakout, potentially triggering a global correction — a risk that Indian markets can't ignore.
Final Word
We’re at a critical juncture. While technicals suggest a potential bounce in Nifty from 25,000, the lack of confirmation on higher timeframes and uncertain global cues call for prudence over aggression.
👉 I’ll be staying out of the market this week. The setup doesn’t offer a favorable risk-reward, and in trading, patience is often the best position.
Let the charts speak. We’ll act accordingly.
Nifty levels - Jul 14, 2025Nifty support and resistance levels are valuable tools for making informed trading decisions, specifically when combined with the analysis of 5-minute timeframe candlesticks and VWAP. By closely monitoring these levels and observing the price movements within this timeframe, traders can enhance the accuracy of their entry and exit points. It is important to bear in mind that support and resistance levels are not fixed, and they can change over time as market conditions evolve.
The dashed lines on the chart indicate the reaction levels, serving as additional points of significance to consider. Furthermore, take note of the response at the levels of the High, Low, and Close values from the day prior.
We hope you find this information beneficial in your trading endeavors.
* If you found the idea appealing, kindly tap the Boost icon located below the chart. We encourage you to share your thoughts and comments regarding it.
Wishing you success in your trading activities!
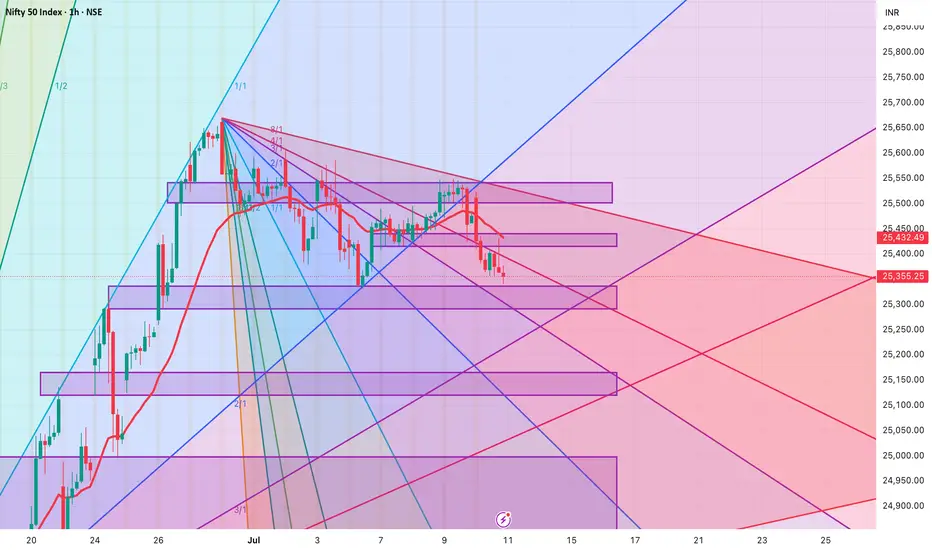
Levels for Nifty - 11 July 20251. Long once 25415 - 25440 is broken for target of 25541 and second target of 25610.
2. Short only after the support zone of 25336 - 25291 is broken for target of 25165 and second target of 25000.
3. No trading zone with be todays range of 25340-25410

Nifty Analysis EOD – July 10, 2025 – Thursday🟢 Nifty Analysis EOD – July 10, 2025 – Thursday 🔴
"False Hopes, True Drop – Bears Tighten Their Grip"
Nifty opened with a mild 50-point gap-up, but within the very first minute, that optimism was crushed. It dropped nearly 100 points, breaching the previous day’s low, and entered the key support zone of 25405–25418, which held briefly for about half an hour.
But this wasn’t a day for bulls.
After a weak attempt to recover from the 25360 support (which held twice intraday), sellers regained momentum, dragged the index further down, and finally closed at the lowest point of the day – 25348.
🔸 Expiry volatility played its part — trapping option buyers and luring them into false reversals.
🔸 However, quick scalpers and intraday short-sellers likely capitalized well.
🔸 The structure was decisively bearish, with no meaningful intraday bounce.
Tomorrow becomes crucial.
Bulls have one last stronghold at the 25300 level.
Bears, already in charge, may extend the damage further if this breaks.
⚠️ Bias Levels:
🟢 Bullish above: 25420
🔴 Bearish below: 25290
⚪ Between = Neutral / Watch Mode
🕯 5 Min Time Frame Chart with Intraday Levels
🕯 Daily Time Frame Chart with Intraday Levels
🕯 Daily Candle Breakdown
Open: 25,511.65
High: 25,524.05
Low: 25,340.45
Close: 25,355.25
Change: −120.85 (−0.47%)
📊 Candle Structure Breakdown
Real Body: 156.40 points – large red candle
Upper Wick: 12.40 points – minimal bullish push
Lower Wick: 14.80 points – bears kept pressure till close
🔍 Interpretation
Bears took over early and never let go
The close at day low shows strong conviction from sellers
Lack of significant wicks → no real fight from bulls
🕯 Candle Type
Bearish Marubozu-style candle – clear sign of dominance by sellers, and potential for continuation if no quick reversal
📌 Key Insight
Market is in a critical zone — hovering above the edge of deeper correction
25300–25290 is the line in the sand
A breakdown below can target 25,200–25,250
Bulls can only regain momentum above 25,420
🛡 5 Min Intraday Chart
⚔️ Gladiator Strategy Update
ATR: 189.49
IB Range: 113.75 → Medium IB
Market Structure: 🟡 Balanced
Trades Triggered
10:52 AM – Short Trade → 🎯 Trail SL Hit (R:R 1:0.38)
📌 Support & Resistance Zones
Resistance Levels
25,380
25,405 ~ 25,418
25,470 ~ 25,480
25,530
25,545 ~ 25,550
Support Levels
25,315 ~ 25,295
25,260
25,212 ~ 25,180
25,125
💭 Final Thoughts
"Expiry days often blur the picture, but today’s price action was sharp. Unless bulls step up quickly, the breakdown may just be getting started."
✏️ Disclaimer
This is just my personal viewpoint. Always consult your financial advisor before taking any action.
