Nifty’s Make-or-Break Zone: Will Bulls Charge or Bears Bite?www.tradingview.com
---
### 🧠 **1. Context at-a-glance**
- Recent bounce from a **Demand Zone (D1 Key Level)** around **21,800**.
- Strong bullish rally into a **Supply Zone (~22,600–22,750)**.
- Price is currently showing **hesitation within this resistance**, with smaller-bodied candles forming → potential reversal signals.
- The oscillator has **crossed bullish** from oversold but is nearing a decision zone.
---
### 🔮 **Future Move Scenarios**
#### 🟥 SCENARIO A: **Rejection from Supply Zone** (Most Likely Short-Term)
- **Why?** Price has hit a resistance with fading momentum and no breakout confirmation.
- **What happens?**
- Price retraces toward **22,200**, potentially even **21,800–21,900**.
- Retest of BOS level possible before the next directional leg.
- **Watch for:** Bearish candle formations (engulfing / long wicks), oscillator stalling below 50.
---
#### 🟩 SCENARIO B: **Bullish Breakout Above 22,750**
- **What confirms it?**
- A strong bullish candle closing above 22,750 with follow-through.
- **Next Targets:**
- 🔼 **23,000** (round level and minor resistance)
- 🔼 **23,300–23,500** (old supply zone)
- Eventually back to **23,750+**
- **Oscillator support:** If the indicator crosses 50+, bullish momentum could sustain.
---
### 📉 Oscillator Hints:
- Still below 50 — **recovery in progress**, not full momentum yet.
- If price rejects and oscillator drops → **Bearish divergence** possibility.
---
### 🧭 **Your Playbook**
| Zone | Action Idea | Trigger to Watch |
|------------------|-------------------------------|----------------------------------|
| 22,600–22,750 | Short / Hedge | Rejection candle, loss of momentum |
| 22,200–22,300 | Potential buy zone (aggressive) | Bullish candle or bounce confirmation |
| Break > 22,750 | Buy on Retest or Momentum | Breakout candle + volume |
| < 21,800 | Bearish continuation | Break of demand zone + close below |
---
NIFTY trade ideas

NIFTY WEDNESDAY ANALYSIS ( NTRADAY) WEEKLY EXPIRY ( 9TH APRIL )Nifty can give a good upside move on Wednesday's weekly expiry session with the condition that it secures 22400 on the downside. On the upside, we can look for levels upto 22880+ if Nifty successfully crosses and sustains above 22650, and stronger momentum is expected if it crosses 22730. All levels are marked in the chart posted .
GUYS, YOU CAN FOLLOW ME ON X FOR DAILY INDEX UPDATES. ID - (@Ishanmathur24 )

Nifty important levels and trade plan for 9th April 2025Nifty important levels and trade plan for 9th April 2025

Nifty 50 Forecast with NEoWave(Update)While many analysts thought that the NIFTY50 correction was over, the index is still moving towards the specified targets. The reason I did not update the index was that we had not yet received confirmations of the end of the correction.
It seems that the minimum target for the NIFTY50 index is the same number as I mentioned earlier and after reaching the target, we will check whether the correction is over or will continue to decline.
The pattern is still diametric and we only changed the position of the labels (c)-(d)-(e). If 23879 is broken strongly, we can say that the NIFTY50 correction is over.
Previous analysis

Nifty levels - Apr 09, 2025Nifty support and resistance levels are valuable tools for making informed trading decisions, specifically when combined with the analysis of 5-minute timeframe candlesticks and VWAP. By closely monitoring these levels and observing the price movements within this timeframe, traders can enhance the accuracy of their entry and exit points. It is important to bear in mind that support and resistance levels are not fixed, and they can change over time as market conditions evolve.
The dashed lines on the chart indicate the reaction levels, serving as additional points of significance to consider. Furthermore, take note of the response at the levels of the High, Low, and Close values from the day prior.
We hope you find this information beneficial in your trading endeavors.
* If you found the idea appealing, kindly tap the Boost icon located below the chart. We encourage you to share your thoughts and comments regarding it.
Wishing you success in your trading activities!

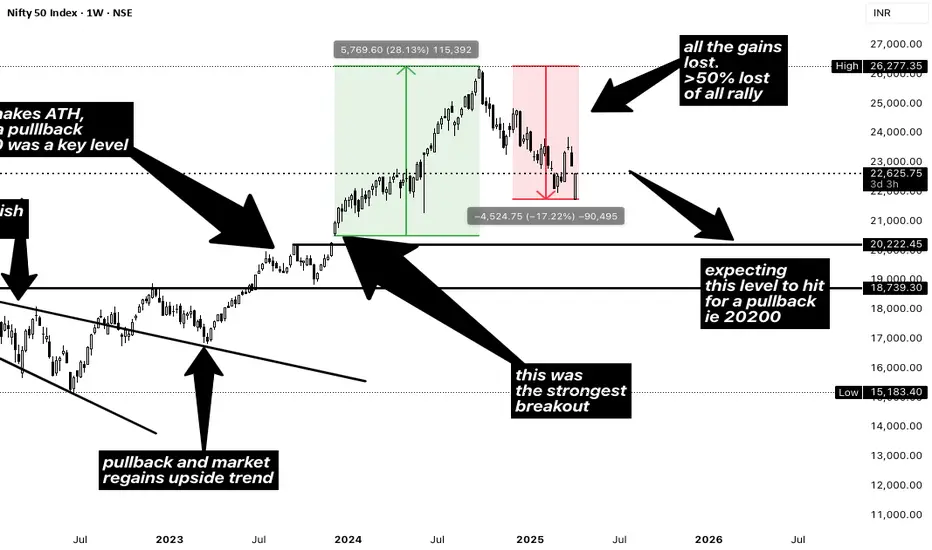
nifty to hit 20200 soon?most of the gains washed out on upside rally, with stong downtrend, nifty might hit for a pullback on this levls.
#NIFTY Intraday Support and Resistance Levels - 08/04/2025Gap up opening in nifty. After opening if nifty sustain above 22500 level then possible upside move upto 22750+ level in opening session. 22750 level will act a strong resistance expected reversal from this level. If nifty starts trading below 22400 then possible sharp downside rally upto 22050 in today's session.

Nifty 50:Nifty 50:
The index has failed to hold our previously mentioned support @ 22300.
A gap of 575 points has also been left down.
What happened?
The previous support @ 21700 was bought in.
Followed by the short covering which also led to the formation of a strong bullish candle.
What next?
We have to wait for the next few days candle to verify the volume and momentum follow up.
The gap could act as a significant resistance, trapping the buyers.
Cheers

22800, the next Stop!What to Watch Next:
Support Test at ₹21,732:
If broken, the next downside could test ~₹21,250 or even ₹20,900 levels.
Pullback to ₹22,800 area:
Likely to act as resistance — good zone to consider shorting again if reversal seen.
Strategy Ideas (Not Financial Advice):
Short-term traders:
Watch for a pullback to short near ₹22,700–22,800.
Stop-loss just above ₹23,000.
Buyers: Wait for consolidation or reversal candle near ₹21,732.

Nifty view after during trump black monday crash - better viewI tried to make BoS and trend line for nifty 50. 2 long demand zones, 2 short term supply zones, 2 short term gaps. Interesting stage to see how next moves will play out.

Nifty view after during trump black monday crashI tried to make BoS and trend line for nifty 50. 2 long demand zones, 2 short term supply zones, 2 short term gaps. Interesting stage to see how next moves will play out.

Nifty weekly Chart view for next 1 year. Where are we heading toThis is just chart version of previous idea. Self explanaotory

TIME to SHOP after 2000 points fall in our favour!!!As we can see NIFTY breached all its mild support and is now trading at most important demand zone and looks like the best time to buy the dip till the low of this broken below for further downfall ! Hence our approach should be changed from selling the rise to BUYING THE DIP keeping todays candle lows closing as stop loss! So plan your trades accordingly and keep watching!

Nifty Trend directionNifty 22161 - As per channel chart pattern, Nifty has not yet bottomed out and We expect another 1000 more points fall down to come. Nifty has closed in positive so possibility to move up further to trap PUT writers and once Nifty below 22335 will confirm the another fall.

Nifty recovers from lows of the day. But not out of danger yet.Nifty as expected suffered heavy losses due to Trump Tariff Tornado which has engulfed the global markets. The good thing which is the silver lining in the cloud was that it recovered from the lows of the day by a lot. The lowest point of today or perhaps the year 2025 so far was 21743 and we closed the day at 22161. Which is about 418 points. However we are not out of the woods yet. We will hopefully see bottom formation later during this week or the next if this lowest point is already not the bottom. The support levels for Nifty remain at 21743, 21289, 20790 and 20320. Resistance for Nifty will be at 22266, 22711, 23083 and 23384. Above 23384 closing Nifty will be back to the bulls territory and we can hope for a recovery towards 24K first and then 25K.
As of now the ball is still in Trump's court as the world sizzles with his Whims and fancies. China is planning a stimulus package for its industry and High level cabinet meeting is going on in India as I write this to counter the effects of Trump Tariff and swift recovery of our economy in addition to minimising the effect of damage.
The best strategy is to wait out the Trump Storm reassess the situation once bottom is formed. Those who have liquidity this is a good oppertunity to go long after bottom fishing.
Disclaimer: The above information is provided for educational purpose, analysis and paper trading only. Please don't treat this as a buy or sell recommendation for the stock or index. The Techno-Funda analysis is based on data that is more than 3 months old. Supports and Resistances are determined by historic past peaks and Valley in the chart. Many other indicators and patterns like EMA, RSI, MACD, Volumes, Fibonacci, parallel channel etc. use historic data which is 3 months or older cyclical points. There is no guarantee they will work in future as markets are highly volatile and swings in prices are also due to macro and micro factors based on actions taken by the company as well as region and global events. Equity investment is subject to risks. I or my clients or family members might have positions in the stocks that we mention in our educational posts. We will not be responsible for any Profit or loss that may occur due to any financial decision taken based on any data provided in this message. Do consult your investment advisor before taking any financial decisions. Stop losses should be an important part of any investment in equity.

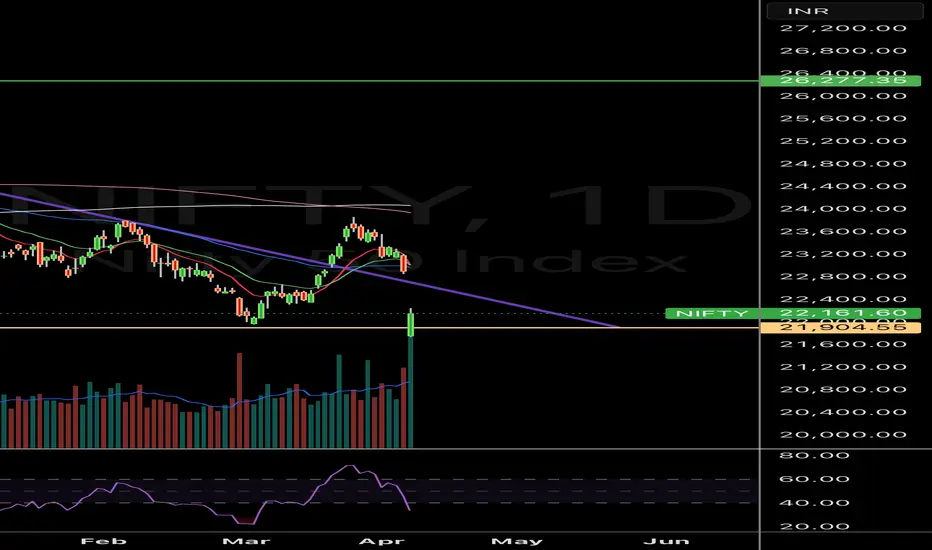
Nifty Daily Chart – Pullback or Panic?Yes, Nifty closed at 22,161 (-742 pts) after a gap-down, but here’s the bullish lens:
• Price still above 21,900 – a major support & previous breakout zone
• Volume spike could indicate capitulation selling – smart money may be absorbing
• RSI nearing oversold – watch for a bounce
• Bullish structure intact as long as 21,900 holds
If buyers step in here, we may see a V-shape recovery.
This zone is where trendlines break… or bounce.
#Nifty #Nifty50 #TechnicalAnalysis #PriceAction #StockMarket #Bullish #NSE
Nifty levels - Apr 08, 2025Nifty support and resistance levels are valuable tools for making informed trading decisions, specifically when combined with the analysis of 5-minute timeframe candlesticks and VWAP. By closely monitoring these levels and observing the price movements within this timeframe, traders can enhance the accuracy of their entry and exit points. It is important to bear in mind that support and resistance levels are not fixed, and they can change over time as market conditions evolve.
The dashed lines on the chart indicate the reaction levels, serving as additional points of significance to consider. Furthermore, take note of the response at the levels of the High, Low, and Close values from the day prior.
We hope you find this information beneficial in your trading endeavors.
* If you found the idea appealing, kindly tap the Boost icon located below the chart. We encourage you to share your thoughts and comments regarding it.
Wishing you success in your trading activities!

NIFTY50.....Here is the crash! Hello Traders,
yesterday, I wrote the following words:
"If not, the index has the possibility to crash to new lows. From my view, I need to see a final "sell-off" in the coming one or two weeks, to clear the market and banish those shaky hands! !"
That is what exactly happened this morning! A CRASH! Shaking off the shaky hands!
The markets are on the verge of being cleaned up! But!!! NOT yet!!!
Chart analysis!
First thing to know. This morning's move and massive gap-down was probably a wave 3. These waves are the most powerful waves during an impulse and (in this case), and they destroy the most gains in some minutes, i.e.hours!
The second possibility is given that we have seen a "V.-turnaround", and the market has seen the low!
To me, the structure is not clear, and I expect one lower low in the coming days ahead below 21743.6!
The most important thing for a trader is, to believe what you see! Not to believe what you like to see!
Following the idea of a wave 3 (which could be done), we should see a wave 4, morph into an a-b-c or a triangle! Keep in mind, that triangles are the most unlikely patterns to see!
Anyway! If so to come, the next hours will show us the pattern, and probably we will get one a-b-c structure! After, i f so to come, new lows are ahead in the following days!
But. If this low was the final low for this crash, the index is able to set the stage and skyrocketing!
For now, there is no fact, to support this idea, and we handle with patient and care!
Don't catch a falling knife!!!
I will follow the market closely and update it constantly!
For now.....have a great week!
Ruebennase
Please ask or comment as appropriate.
Trade on this analysis at your own risk.

8 April Nifty50 important level trading zone #Nifty50
99% working trading plan
C1👉Gap up open 22318 above & 15m hold after positive trade target 22510, 22670,
C2👉Gap up open 22318 below 15 m not break upside after nigetive trade target 22142,
C3👉Gap down open 22142 above 15m hold after positive trade target 22318, 22510
C4👉Gap down open 22142 below 15 m not break upside after nigetive trade target 22078
C5💫big gapdown open 22070 above hold 1st positive trade view
C6💫big Gapup opening 22673 below nigetive trade view
📌For education purpose I'm not responsible your trade
More education following me

Nifty 50 Weekly Analysis: Key Levels & Trend OutlookWeekly Recap:
The Nifty 50 closed the week at 22,904.45, marking a significant decline of -2.61%.
Key Weekly Levels for Next Week
Price Action Pivot Zone:
The crucial zone to watch for any potential reversals or trend continuation is between 22,829 and 22,980
Support & Resistance Levels:
Support Levels:
S1: 22,609
S2: 22,303
S3: 21,928
Resistance Levels:
R1: 23,209
R2: 23,513
R3: 23,870
Market Outlook:
Bullish Scenario: A sustained move above 22,980 could attract buyers, driving Nifty towards R1 at 23,209 and possibly higher.
Bearish Scenario: If 22,829 fails to hold, the market could witness further selling, driving Nifty towards S1 at 22,609 and possibly lower.
Disclaimer: This analysis is for educational purposes only and does not constitute financial advice. Please conduct your own research or consult a financial advisor before making any trading decisions.

inverse head and shoulder-Bullish pattern formation in nifty 50nifty 50 has formed first shoulder and head so far,looks like second shoulder in making ..im bullish on nifty 50..ichimoku future cloud turns green and the candles inside the cloud will go consolidation and the twist occurs at may 5.

7 April important level trading zone update New fresh level upgrade for big gaupdown opening
21890 break than short position
22142 tach not brack 🔼 upside than short position
Ce zone today not working please ignore resion big news

Nifty bloodbath forecasted on Feb 3. WE had forecasted in our Feb3 Posting " BLOOD BATH " IF 23159 BROKEN.
SEE THE BLOOD BATH IN ACTION. CHECK OUR FEB 3 FORECAST IN BELOW LINK
share your comment if You find our analysis good
