Whats Next With Nifty . Understand with Chart . / Nifty AnalysisAs There is Huge News Flow In the Market so, there is Many Gaps ups and Gap downs . But We are still Standing at That place where all This Things Started If You observe that . Now In Firiday Session we Have Open = Law , So This Low is automatic a Strong Demand or Support Till Not Broke we cant Expect a Strong Fall In Nifty . On Upper side we didnt Have Much barriers , There we have a supply at 22200 - 22150 . So the plan is Quite simple we Go with Price due to heavy News Flow . If we broke and sustain above yesterday then we will look for longs Till Upper Supply . If we Breach or Open below friday session low then we will low for shorts till Green zone that is 22350 - 22400 . As simple as That .
Follow For More .
NIFTY trade ideas

NIFTY CHANGING TRAJECTORY?NIFTY Weekly Analysis , uptrend coming?
WAIT AND WATCH THE LEVEL AND ONLY CONSIDER.

NIFTYNIFTY
MTF Analysis
NIFTYYearly Demand 18887
NIFTY 6 Month Demand 21801
NIFTYQtrly Demand BUFL 22526
NIFTYMonthly Demand 23110
NIFTYWeekly SOE 23049
NIFTYDaily Demand DMIP 22261
ENTRY -1 Long 23,049
SL on Weekly Closing 22,720
RISK 329
Target as per Entry 26,000
Last High 26,277
Last Low 21,746
ENTRY -2 Long 22,261
SL on Daily Closing 22,000
RISK 261
Target as per Entry 26,000
Last High 26,277
Last Low 21,746

NIFTY Strategy May Be 99% Wrong - Trade with Extreme Caution!📈 Hourly Chart Technical Analysis
🔸 RSI Cooling Off:
The RSI recently reversed from a scorching 88 on the hourly chart, signaling overbought conditions 🚨. This hints at a possible short-term pullback before the bulls decide their next move 🐂⏳.
🔸 🚧 Resistance Ahead:
📍 23,350 is the key level to watch – it’s a strong resistance zone that’s been tough to crack in the past. A breakout here could light up the index! 💥📊
🔸 🛡️ Support Zones:
📉 22,800 is holding firm as immediate support, backed by solid open interest data – a level the bulls will want to protect.
Nifty Trading Plan Could Miss the Mark – Risk Level: 99%
⚠️ Strategy for Monday – April 14
✅ Above 23,000:
🚀 Bullish bias – Eyes on a move up to 23,350. Consider buying only on strong breakout confirmation. Momentum is key! 🔍📈
🟡 Between 23,000 and 22,800:
🎯 Expect sideways action – a choppy range where scalpers might thrive. Trade light and keep those stop losses tight! 🪙⚖️
🔻 Below 22,800:
🐻 A bearish signal – this opens the door for a drop toward 22,555. Consider short positions only with strict risk control 🎯🛑

NIFTY Weekly Chart AnalysisStage 3 topping? Or new Stage 2 rally incoming?
NIFTY bounces hard off the key support (21,900 zone) after undercutting the base.
• Broke the Stage 4 downtrend (purple line)
• Strong bullish bar with volume
• Price reclaimed 30W MA, RSI rising from oversold
• Next test: 23,300–23,500 zone
• Long-term target: ATH >26,000 if breakout holds
This is where smart money positions.
Accumulation or Distribution? Watch volume next 2 weeks.
#NIFTY #NSE #TechnicalAnalysis #SwingTrading #Stocks

NIFTY WEEK AHEAD - ( APRIL 3RD WEEK )Nifty chart is indicating a chance for upside in the upcoming week . Base for upside is 23000 as it is an important resistance and upon crossing 23000 successfully, we can expect upside momentum to continue upto 234450-560. All levels are marked in the chart posted .

Nifty in the Short Term can try to stage further recovery. After the drastic Trump Tariff war shock Nifty is trying to recover it's lost territory closing at 22828. Right now the Nifty is trapped between Mother and Father lines of its Hourly chart. The supports for Nifty remain at 22761 (Mother Line Support), 22675, 22353 and 21859. Below 21859 Nifty becomes very week again. The resistance for Nifty on the upper side remain at 22924 (Strong Father line Resistance), 23174 (Strong Trend line Resistance), 23384, 23569 and finally 23783. Above 23783 closing Nifty will become very Bullish.

NIFTY50.....Wave a or (i)?Hello Traders,
the NIFTY50 has penetrated my cited target range @ 22161.60 (watch the rectangle), and probably has finished a wave z of a triple correction! If so, the next move should bring N50 ant least to 23689.60–23807. This is the level of a wave x² range.
As to see, at the 1h chart, I have labeled the chart as an impulsive move up to 22923.90. Here, an "Evening-star" has been formed. This is a bearish reversal pattern. It failed above the high of 22923.90 points. So, we have to watch this area.
Observing the indicators, which are always one step behind the real-time price, has left room for more advances.
Anyway! Shorthand there is a chance, that price is close to end an impulsive move, with a wave b/2 to follow. We will follow price closely and update the count at latest i the coming 1–2 sessions.
That's it for a quick note.
Have a great weekend.....
Ruebennase
Please ask or comment as appropriate.
Trade on this analysis at your own risk.

NIFTY50 CHART ANALYSIS Downtrend following the channel. Once channel breakout hold above then we might see market uptrend

Some S/R ranges for 15 minut and dailyRed lines represent for 15 minut candles and it will be a range.and also blue for daily candles. Daily S/R Lines just for a reference.For trading watch 15 minut S/R Lines

Recovery by Nifty, Resistance zone ahead. (Economic commentary)Nifty has given a strong closing amidst global uncertainty. The uncertainty and heavy volatility will remain in the market so traders are requested to be very cautious especially with regards to Futures and Options. Any positive news can trigger a huge upside at the same time any negative news can trigger a huge downside as well.
India is silently staying neutral and trying to chart it's own deal should be seen as a positive view for long term investors. The focus of Indian investors should remain on companies which procure local raw material and supply it locally these will be the safest bets. MET has predicted a normal Monsoon for India with 103% rainfall which can another shot in the arm for Local markets. FMCG, Specialty Chemicals and Fertilizers, Banks and Financial services should be the sectors to focus.
Along with these sectors commodities and Consumption and can also be the theme as these are dark horses which can benefit from volatility. As Crude is sliding down the companies related to energy and those which are dependent on Oil & Gas, Energy for power and raw material can also benefit. The choice of the stocks should be smart at this juncture to reap rewards.
Long term investors should use this opportunity to invest in Blue chips and High Dividend Yield PSUs and other companies if they are sitting on cash. If not you can use these times to reshuffle your portfolios and align them as per the changing needs of the time. Neutral stance from India can even benefit it by getting FDI (Foreign Direct Investment) if Indian Governments plays it's cards smartly. Too much fog, mist and clouds around on global economy currently for investors to get a clear vision of sunrise sectors. Geo-political uncertainties are also blinding and making the objects in front of us look fuzzy. Investors need to keep patience, avoid speculation and let the dust settle. Even after reconsideration of changing global scenarios Indian GDP will still clock 6%+ so do not have much to worry in the long term. This volatility too shall pass and horizon will definitely be visible in the near future.
To know about how to select good companies to invest in read my book THE HAPPY CANDLES WAY TO WEALTH CREATION. It will help you in making solid triumphant decisions during these uncertain times. It teaches you Behavioural Finance, Fundamental Analysis, Technical Analysis, Profit Booking and many such important topics. The book is one of the highest rated in it's category. The book is available in Amazon in Paperback and Kindle version. You can also contact me directly for getting the same.
Nifty supports remain at: 22270, 21743 (Channel Bottom Support), 21281 (52 week Low support), 20745 and 20236. Below 20236 weekly closing the bears can try to Bring Nifty down to 200 Weeks EMA or the FATHER LINE which is at 19893.
Nifty Resistances remain at: 22913, 23249 MOTHER LINE which will be a (Major resistance), 23499 (Strong Trend line resistance), Above 23499 Bulls can become more active and try to Pull Nifty upwards towards 23894, 24334, 24831 and 25419. After we get a monthly closing above 25419 we can think of regaining 26K levels.
Short Term Outlook : Brace for massive volatility.
Medium Term Outlook: Range Bound Nifty.
Long Term Outlook: Still Very Strong.
Disclaimer: The above information is provided for educational purpose, analysis and paper trading only. Please don't treat this as a buy or sell recommendation for the stock or index. The Techno-Funda analysis is based on data that is more than 3 months old. Supports and Resistances are determined by historic past peaks and Valley in the chart. Many other indicators and patterns like EMA, RSI, MACD, Volumes, Fibonacci, parallel channel etc. use historic data which is 3 months or older cyclical points. There is no guarantee they will work in future as markets are highly volatile and swings in prices are also due to macro and micro factors based on actions taken by the company as well as region and global events. Equity investment is subject to risks. I or my clients or family members might have positions in the stocks that we mention in our educational posts. We will not be responsible for any Profit or loss that may occur due to any financial decision taken based on any data provided in this message. Do consult your investment advisor before taking any financial decisions. Stop losses should be an important part of any investment in equity.

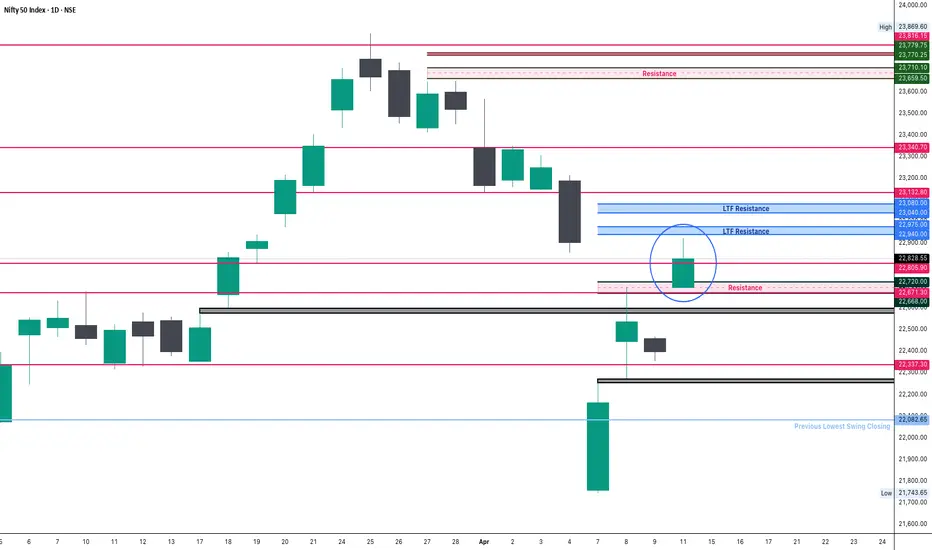
Nifty Analysis EOD - 11th April 2025📌 Background
After yesterday’s holiday, global cues were positive—especially from the US markets. SGX Nifty indicated a strong gap-up. As expected, Nifty opened at 22,695, right around the previous session’s high and within our marked Resistance Zone.
📌 Today’s Price ActionNifty opened with a sharp gap-up, and the Initial Balance (IB) high was formed at 22,875. The price managed to breach the IB high briefly, triggering a trade signal and filling the gap between 4th and 7th April sessions.However, the index failed to sustain above 22,875–22,900. Momentum fizzled out post-breakout, and Nifty retraced toward the opening zone.
🧊 Intraday range was 228 points, out of which 165 points occurred during the IB phase. Most of the move was already baked in early on.
📉 Despite gaining +429 points intraday, Nifty closed at 22,828, slightly below the previous week’s high of 22,857—which hints at a pause or temporary exhaustion.
📌 Technical OutlookNifty is still playing between supply and demand zones. Today’s rejection from above 22,900 and close below the weekly high indicates a need for further strength or a catalyst to push beyond 23,000 convincingly. A clean break above 22,900–23,000 remains key.
📌 Important Levels
🔼 Resistance Zones
22,857 (Weekly High)
22,900–23,040
23,182
23,340
🔽 Support Zones
22,668 (Breakout Zone)
22,337
22,082 (Previous Lowest Swing Close)
🧠 Strategy Going ForwardIf no negative news flow arises, a retest of 23,000–23,040 is likely. Traders should wait for sustained price action above 22,900 for fresh longs.Avoid aggressive shorts unless the price breaks down below 22,668 with momentum.
📋 Quick Recap✅ Gap-up opening on global cues✅ IB High breached and gap filled✅ 228-point range; majority in IB✅ Resistance at 22,900 held firm✅ Closed below weekly high
🧘 Patience is power. Wait for confirmation beyond resistance.
Nifty a closing studyNifty 22828 - Has closed with a HS pattern in 15 minutes chart near resistance of the raising flag bearish pattern . We expect Nifty to drop down to technical target 22540.

Nifty levels - Apr 15, 2025Nifty support and resistance levels are valuable tools for making informed trading decisions, specifically when combined with the analysis of 5-minute timeframe candlesticks and VWAP. By closely monitoring these levels and observing the price movements within this timeframe, traders can enhance the accuracy of their entry and exit points. It is important to bear in mind that support and resistance levels are not fixed, and they can change over time as market conditions evolve.
The dashed lines on the chart indicate the reaction levels, serving as additional points of significance to consider. Furthermore, take note of the response at the levels of the High, Low, and Close values from the day prior.
We hope you find this information beneficial in your trading endeavors.
* If you found the idea appealing, kindly tap the Boost icon located below the chart. We encourage you to share your thoughts and comments regarding it.
Wishing you success in your trading activities!

11 April Nifty50 trading zone update 22918 above positive trade veiw
22828 below nigetive trade view
22788 strong support
22988 strong resistance

#NIFTY Intraday Support and Resistance Levels - 11/04/2025Gap up opening near 23000 level expected in nifty. After opening if nifty starts trading above 23050 level then expected further upside rally upto 23250+ level in opening session. Downside 22800 level will act as a strong support for today's session. Any major downside rally only expected if nifty not sustain above level and starts trading below 22750 level.

NIFTY taking support ! Signs of REVERSAL!!?Following the global cues, the gains has been nullified by today’s fall in global market which can lead to not so strong of a opening but in a broader view NIFTY seems to be taking support at the falling wedge structure which is a potential signs of REVERSAL and strength hence as long as NIFTY maintains itself above the structure, every dip can be bought despite of global volatility so keep watching everyone and plan your trades accordingly.

11 April Nifty50 trading zone #Nifty50
99% working trading plan
👉Gap up open 22660 above & 15m hold after positive trade target 22818, 23118
👉Gap up open 22660 below 15 m not break upside after nigetive trade target 22492
👉Gap down open 22492 above 15m hold after positive trade target 22658, 22810 , 23118
👉Gap down open 22492 below 15 m not break upside after nigetive trade target 22372
💫big gapdown open 22372 above hold 1st positive trade view
💫big Gapup opening 22818 below nigetive trade view
📌For education purpose I'm not responsible your trade
More education following me

Nifty Trend direction Nifty 22399 - A VTOP pattern could be seen in daily chart which is a pull back test of 22671 Support.
As per Bulkowski chart pattern "You can calculate a 38.2% retrace of the move up on the left side of the pattern. If price closes below the computed value, then consider selling" which is at 22870.
Last session Call writers very aggressive and didn't allow to raise Nifty above 22448 Though PUT writers try hard to push up the Nifty. In Fact Call writers were successful pushing down to a low 22340.
As long as Nifty trade below 22528 we shall expect Nifty to go down further to 209395 !!!

"Is Nifty Gearing Up for a Bullish Move?"Nifty 50 Daily Chart Analysis – 10th April 2025
1. Price Trend and Structure:
Nifty recently faced strong resistance near the 24,000–24,200 zone and has since reversed.
The index is moving within a downward sloping channel, confirming a short-term bearish structure.
The pattern shows lower highs and lower lows, signaling continued bearish pressure.
2. Fibonacci Levels:
A key support zone was tested around 21,964, corresponding to the 0.618 Fibonacci retracement level.
If this level fails to hold, the next downside targets could be near 21,500 and then 20,800 (based on Fibonacci extensions).
3. Support and Resistance:
Immediate support: 21,964
Immediate resistance: 22,918 to 22,953 (horizontal level and EMA confluence)
A breakout above 23,000 would be a signal for potential trend reversal or bullish momentum.
4. EMA Stack Strength Meter:
The EMA histogram is turning deep red, indicating bearish alignment of exponential moving averages.
Momentum is clearly negative, with no strong bullish signs yet.
5. ADX Meter Line:
The ADX-based meter shows predominantly red bars.
This indicates rising trend strength, but with the -DI being stronger than +DI, confirming bearish dominance.
Very few green bars suggest limited bullish activity.
Expectations:
As long as Nifty stays below the 22,950–23,000 zone, the bias remains bearish to sideways.
A break below 21,964 could open further downside toward 21,500 or even 20,800.
Sustained recovery and a close above 23,000, along with rising ADX and +DI dominance, would be needed to confirm a bullish reversal.
Key Factors to Monitor:
Price action at the channel support.
Direction of ADX and DI lines.
Volume activity on any potential bounce.

Nifty Analysis & Trade Plan for tomorrow, 11th AprilNifty Analysis & Trade Plan for tomorrow, 11th April

US-China Rift: India's Golden Hour?Heightened trade tensions between the United States and China, characterized by substantial US tariffs on Chinese goods, inadvertently create a favorable environment for India. The significant difference in tariff rates—considerably lower for Indian imports than Chinese ones—positions India as an attractive alternative manufacturing base for corporations seeking to mitigate costs and geopolitical risks when supplying the US market. This tariff advantage presents a unique strategic opening for the Indian economy.
Evidence of this shift is already apparent, with major players like Apple reportedly exploring increased iPhone imports from India and even accelerating shipments ahead of tariff deadlines. This trend extends beyond Apple, as other global electronics manufacturers, including Samsung and potentially even some Chinese firms, evaluate shifting production or export routes through India. Such moves stand to significantly bolster India's "Make in India" initiative and enhance its role within global electronics value chains.
The potential influx of manufacturing activity, investment, and exports translates into substantial tailwinds for India's benchmark Nifty 50 index. Increased economic growth, higher corporate earnings for constituent companies (especially in manufacturing and logistics), greater foreign investment, and positive market sentiment are all likely outcomes. However, realizing this potential requires India to address persistent challenges related to infrastructure, policy stability, and ease of doing business, while also navigating competition from other low-tariff nations and seeking favorable terms in ongoing trade negotiations with the US.

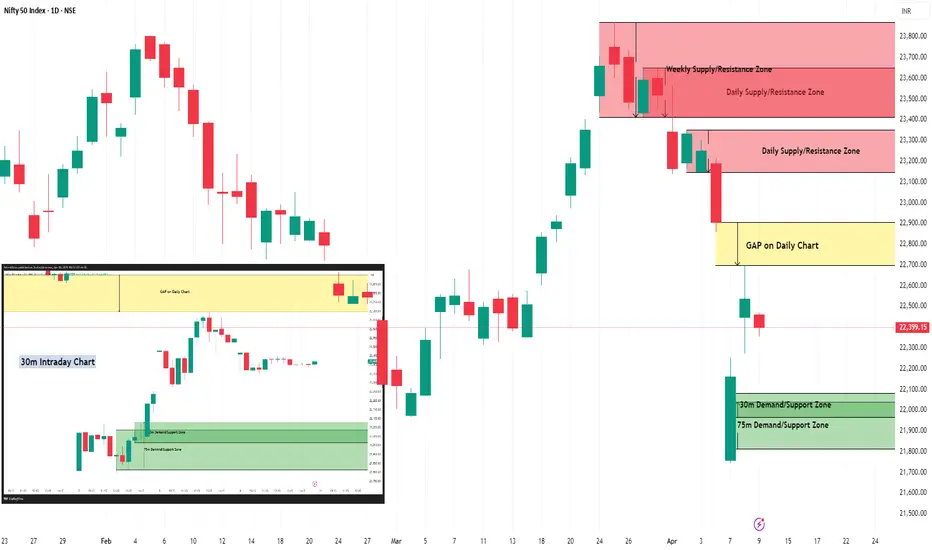
Nifty Intraday Support & Resistance Levels for 11.04.2025🔄 Recap since last update (21.03.2025):
Nifty rallied to a high of 23,869.60 on 25th March, right into the Weekly Supply Zone highlighted earlier — and then the storm hit. Triggered by Trump’s tariff announcements, Nifty crashed over 2,000 points in just 8 sessions, bottoming out at 21,743.65 on 7th April.
🌍 Global markets have since remained highly volatile. Interestingly, Dow Futures have bounced back 4,000 points (10%) from their lows and are now hovering around 40,700 (while writing this).
⚠️ With the looming Trade War, expect continued volatility across global and Indian markets. Be nimble and cautious.
📅 On Wednesday (Weekly Expiry):
Nifty opened gap-down, moved in a tight range between 22,468.70 and 22,353.25, and closed at 22,399.15, down 137 points from the previous session.
🔹 Trend Analysis:
Weekly Trend (50 SMA): Sideways
Daily Trend (50 SMA): Sideways
📉 Demand/Support Zones
Near Support (30m): 21,964.85 – 22,080.85
Near Demand/Support (75m): 21,814.35 – 22,037.80
Far Support: 21,281.45 (Low of 4th June 2024)
Far Demand/Support (Daily): 20,769.50 – 20,950
📈 Supply/Resistance Zones
Near Supply (Gap Zone - Daily): 22,697.20 – 22,904.45
Far Supply (Daily): 23,145.80 – 23,350
Far Supply (Daily): 23,412.20 – 23,649.20 (Inside Weekly Supply)
Far Supply (Weekly): 23,412.20 – 23,869.60
Far Supply (Weekly): 24,180.80 – 24,792.30
🔍 Outlook:
Nifty has shown signs of stabilization post the sharp fall, but the presence of a Daily Gap Zone at 22,697 – 22,904 will be the first hurdle for bulls. If this gets cleared with volume, we could see a climb toward 23,145–23,350.
However, global uncertainties and overhead supply zones suggest a sell-on-rise approach may be more appropriate in the short term. Stay agile and manage risk diligently.
📢 Disclaimer: This analysis is for educational purposes only and not investment advice. Please do your own research or consult a financial advisor before making trading decisions.