Nifty levels - Apr 15, 2025Nifty support and resistance levels are valuable tools for making informed trading decisions, specifically when combined with the analysis of 5-minute timeframe candlesticks and VWAP. By closely monitoring these levels and observing the price movements within this timeframe, traders can enhance the accuracy of their entry and exit points. It is important to bear in mind that support and resistance levels are not fixed, and they can change over time as market conditions evolve.
The dashed lines on the chart indicate the reaction levels, serving as additional points of significance to consider. Furthermore, take note of the response at the levels of the High, Low, and Close values from the day prior.
We hope you find this information beneficial in your trading endeavors.
* If you found the idea appealing, kindly tap the Boost icon located below the chart. We encourage you to share your thoughts and comments regarding it.
Wishing you success in your trading activities!
NIFTY trade ideas

11 April Nifty50 trading zone update 22918 above positive trade veiw
22828 below nigetive trade view
22788 strong support
22988 strong resistance

#NIFTY Intraday Support and Resistance Levels - 11/04/2025Gap up opening near 23000 level expected in nifty. After opening if nifty starts trading above 23050 level then expected further upside rally upto 23250+ level in opening session. Downside 22800 level will act as a strong support for today's session. Any major downside rally only expected if nifty not sustain above level and starts trading below 22750 level.

NIFTY taking support ! Signs of REVERSAL!!?Following the global cues, the gains has been nullified by today’s fall in global market which can lead to not so strong of a opening but in a broader view NIFTY seems to be taking support at the falling wedge structure which is a potential signs of REVERSAL and strength hence as long as NIFTY maintains itself above the structure, every dip can be bought despite of global volatility so keep watching everyone and plan your trades accordingly.

11 April Nifty50 trading zone #Nifty50
99% working trading plan
👉Gap up open 22660 above & 15m hold after positive trade target 22818, 23118
👉Gap up open 22660 below 15 m not break upside after nigetive trade target 22492
👉Gap down open 22492 above 15m hold after positive trade target 22658, 22810 , 23118
👉Gap down open 22492 below 15 m not break upside after nigetive trade target 22372
💫big gapdown open 22372 above hold 1st positive trade view
💫big Gapup opening 22818 below nigetive trade view
📌For education purpose I'm not responsible your trade
More education following me

Nifty Trend direction Nifty 22399 - A VTOP pattern could be seen in daily chart which is a pull back test of 22671 Support.
As per Bulkowski chart pattern "You can calculate a 38.2% retrace of the move up on the left side of the pattern. If price closes below the computed value, then consider selling" which is at 22870.
Last session Call writers very aggressive and didn't allow to raise Nifty above 22448 Though PUT writers try hard to push up the Nifty. In Fact Call writers were successful pushing down to a low 22340.
As long as Nifty trade below 22528 we shall expect Nifty to go down further to 209395 !!!

"Is Nifty Gearing Up for a Bullish Move?"Nifty 50 Daily Chart Analysis – 10th April 2025
1. Price Trend and Structure:
Nifty recently faced strong resistance near the 24,000–24,200 zone and has since reversed.
The index is moving within a downward sloping channel, confirming a short-term bearish structure.
The pattern shows lower highs and lower lows, signaling continued bearish pressure.
2. Fibonacci Levels:
A key support zone was tested around 21,964, corresponding to the 0.618 Fibonacci retracement level.
If this level fails to hold, the next downside targets could be near 21,500 and then 20,800 (based on Fibonacci extensions).
3. Support and Resistance:
Immediate support: 21,964
Immediate resistance: 22,918 to 22,953 (horizontal level and EMA confluence)
A breakout above 23,000 would be a signal for potential trend reversal or bullish momentum.
4. EMA Stack Strength Meter:
The EMA histogram is turning deep red, indicating bearish alignment of exponential moving averages.
Momentum is clearly negative, with no strong bullish signs yet.
5. ADX Meter Line:
The ADX-based meter shows predominantly red bars.
This indicates rising trend strength, but with the -DI being stronger than +DI, confirming bearish dominance.
Very few green bars suggest limited bullish activity.
Expectations:
As long as Nifty stays below the 22,950–23,000 zone, the bias remains bearish to sideways.
A break below 21,964 could open further downside toward 21,500 or even 20,800.
Sustained recovery and a close above 23,000, along with rising ADX and +DI dominance, would be needed to confirm a bullish reversal.
Key Factors to Monitor:
Price action at the channel support.
Direction of ADX and DI lines.
Volume activity on any potential bounce.

Nifty Analysis & Trade Plan for tomorrow, 11th AprilNifty Analysis & Trade Plan for tomorrow, 11th April

US-China Rift: India's Golden Hour?Heightened trade tensions between the United States and China, characterized by substantial US tariffs on Chinese goods, inadvertently create a favorable environment for India. The significant difference in tariff rates—considerably lower for Indian imports than Chinese ones—positions India as an attractive alternative manufacturing base for corporations seeking to mitigate costs and geopolitical risks when supplying the US market. This tariff advantage presents a unique strategic opening for the Indian economy.
Evidence of this shift is already apparent, with major players like Apple reportedly exploring increased iPhone imports from India and even accelerating shipments ahead of tariff deadlines. This trend extends beyond Apple, as other global electronics manufacturers, including Samsung and potentially even some Chinese firms, evaluate shifting production or export routes through India. Such moves stand to significantly bolster India's "Make in India" initiative and enhance its role within global electronics value chains.
The potential influx of manufacturing activity, investment, and exports translates into substantial tailwinds for India's benchmark Nifty 50 index. Increased economic growth, higher corporate earnings for constituent companies (especially in manufacturing and logistics), greater foreign investment, and positive market sentiment are all likely outcomes. However, realizing this potential requires India to address persistent challenges related to infrastructure, policy stability, and ease of doing business, while also navigating competition from other low-tariff nations and seeking favorable terms in ongoing trade negotiations with the US.

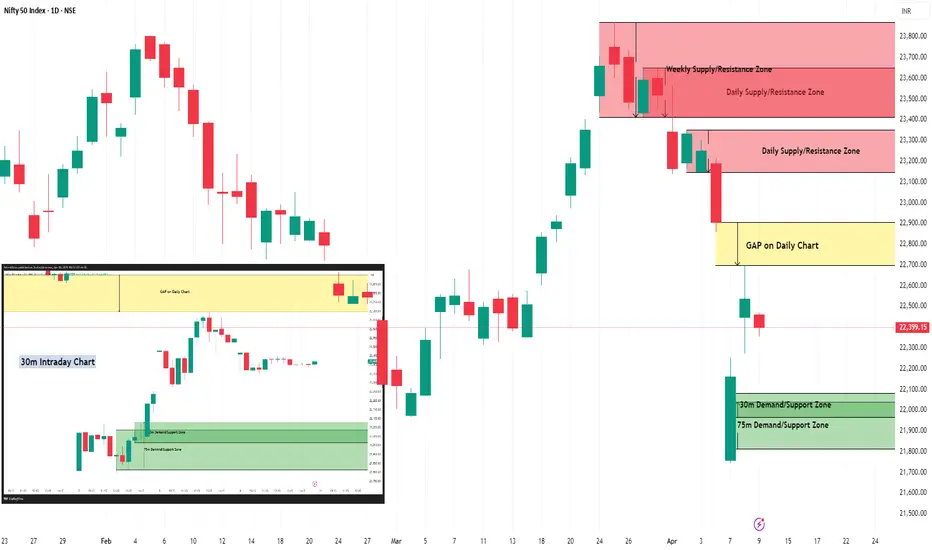
Nifty Intraday Support & Resistance Levels for 11.04.2025🔄 Recap since last update (21.03.2025):
Nifty rallied to a high of 23,869.60 on 25th March, right into the Weekly Supply Zone highlighted earlier — and then the storm hit. Triggered by Trump’s tariff announcements, Nifty crashed over 2,000 points in just 8 sessions, bottoming out at 21,743.65 on 7th April.
🌍 Global markets have since remained highly volatile. Interestingly, Dow Futures have bounced back 4,000 points (10%) from their lows and are now hovering around 40,700 (while writing this).
⚠️ With the looming Trade War, expect continued volatility across global and Indian markets. Be nimble and cautious.
📅 On Wednesday (Weekly Expiry):
Nifty opened gap-down, moved in a tight range between 22,468.70 and 22,353.25, and closed at 22,399.15, down 137 points from the previous session.
🔹 Trend Analysis:
Weekly Trend (50 SMA): Sideways
Daily Trend (50 SMA): Sideways
📉 Demand/Support Zones
Near Support (30m): 21,964.85 – 22,080.85
Near Demand/Support (75m): 21,814.35 – 22,037.80
Far Support: 21,281.45 (Low of 4th June 2024)
Far Demand/Support (Daily): 20,769.50 – 20,950
📈 Supply/Resistance Zones
Near Supply (Gap Zone - Daily): 22,697.20 – 22,904.45
Far Supply (Daily): 23,145.80 – 23,350
Far Supply (Daily): 23,412.20 – 23,649.20 (Inside Weekly Supply)
Far Supply (Weekly): 23,412.20 – 23,869.60
Far Supply (Weekly): 24,180.80 – 24,792.30
🔍 Outlook:
Nifty has shown signs of stabilization post the sharp fall, but the presence of a Daily Gap Zone at 22,697 – 22,904 will be the first hurdle for bulls. If this gets cleared with volume, we could see a climb toward 23,145–23,350.
However, global uncertainties and overhead supply zones suggest a sell-on-rise approach may be more appropriate in the short term. Stay agile and manage risk diligently.
📢 Disclaimer: This analysis is for educational purposes only and not investment advice. Please do your own research or consult a financial advisor before making trading decisions.
Nifty 50 – End of Day Analysis (9th April 2025)🟠 Nifty 50 – End of Day Analysis (9th April 2025)
📌 Background
After the wide-range spinning top on April 8, all eyes were on the RBI MPC event today. While markets typically react to such key announcements, Nifty surprised everyone with its muted response and a rangebound session.
📌 Today’s Price Action
🔹 Nifty opened slightly negative and formed its Initial Balance (IB) early on.
🔹 After the IB, the index remained stuck in a very tight range – a structure we’ve seen repeating over the last few weekly expiries.
🔹 Today’s total range was just 115 points (high to low) – the lowest in the past 14 sessions!
📉 On an MPC event day, such low volatility was quite unexpected.
🔹 With no momentum and no breakout from IB, our system didn’t trigger any trade signal, and we stayed on the sidelines.
📌 Technical Outlook
Today’s candle lacks momentum and conviction.
Key resistance still holds at 22,668–22,720, and support rests near 22,337.
A breakout from this compression zone could decide the next trending leg.
📌 Important Levels to Watch
🔼 Resistance Zones
22,590
22,668 – 22,720
22,805
🔽 Support Zones
22,337
22,270
22,082 (Previous Swing Close)
🧠 Strategy Ahead
As of now, no directional bias without a confirmed breakout.
✅ Wait-and-watch until the IB range breaks
✅ Avoid forced entries in low volatility setups
✅ Let price lead—don’t anticipate
📋 Quick Recap
✔️ IB formed, post-IB rangebound
✔️ 115 pt range – lowest in 14 sessions
✔️ MPC event day, but no buzz
✔️ System = silent = No trade
✔️ Sitting tight is also a position
🧘 Final Thought
"Markets often give profits to those who master patience."
Let the levels guide you — trade with calm and clarity.

India along with the globe stages a recovery. Indian markets staged a recovery along with it's global peers. Although the market moved 374 points upwards. After making a high of 22697 the market closed at 22535 which is 162 points down. Which means it has formed a Bullish Doji. Now Doji candle irrespective of the colour means uncertainty, until we clear the Doji top further upside will not be possible. The doji top resistance is at 22697 and Doji bottom support is at 22270.
Doji works like a cage. The bird will fly either side once the cage is broken.
To know more about the kind of candles, Mother, Father lines, behavioural finance, Technical analysis, fundamental analysis read my book: The Happy Candles Way to Wealth creation.
Nifty Supports remain at: 22270 (Doji cage support), 21743 current low of Trump Tantrum, 21289, 20790 (Channel Bottom support) and 20320.
Nifty Resistances remain at: 22697 (Doji cage resistance), 23061 Mother line resistance, 23376 Father line resistance and 23894 recent market high.
Disclaimer: The above information is provided for educational purpose, analysis and paper trading only. Please don't treat this as a buy or sell recommendation for the stock or index. The Techno-Funda analysis is based on data that is more than 3 months old. Supports and Resistances are determined by historic past peaks and Valley in the chart. Many other indicators and patterns like EMA, RSI, MACD, Volumes, Fibonacci, parallel channel etc. use historic data which is 3 months or older cyclical points. There is no guarantee they will work in future as markets are highly volatile and swings in prices are also due to macro and micro factors based on actions taken by the company as well as region and global events. Equity investment is subject to risks. I or my clients or family members might have positions in the stocks that we mention in our educational posts. We will not be responsible for any Profit or loss that may occur due to any financial decision taken based on any data provided in this message. Do consult your investment advisor before taking any financial decisions. Stop losses should be an important part of any investment in equity.

Nifty levels - Apr 11, 2025Nifty support and resistance levels are valuable tools for making informed trading decisions, specifically when combined with the analysis of 5-minute timeframe candlesticks and VWAP. By closely monitoring these levels and observing the price movements within this timeframe, traders can enhance the accuracy of their entry and exit points. It is important to bear in mind that support and resistance levels are not fixed, and they can change over time as market conditions evolve.
The dashed lines on the chart indicate the reaction levels, serving as additional points of significance to consider. Furthermore, take note of the response at the levels of the High, Low, and Close values from the day prior.
We hope you find this information beneficial in your trading endeavors.
* If you found the idea appealing, kindly tap the Boost icon located below the chart. We encourage you to share your thoughts and comments regarding it.
Wishing you success in your trading activities!

A Trend break trap in Nifty 50 that can trap retailersDisclaimer- Please take this as an educational content, trade with professional financial advice and discretion
The US Federal Reserve’s latest policy stance has sent waves of optimism across global stock markets, including India, as it signaled two interest rate cuts in 2025 while slowing its balance sheet reduction. As of today we can observe a strong break out in Nifty 50 index due to positive global cues and this indicates a long trade on the index future. But this may a trap due to lot of reasons.
GDP growth has been cut from 2.1 per cent to 1.7 per cent, core inflation is set to rise from 2.5 per cent to 2.8 per cent, and unemployment is projected to inch up.
Inflation concerns rise in with tariff wars and a similar situation can be experienced as the hyperbolic rise in inflation of 2021 as current inflation is above fed targets and could go out of bounds due to faster rate cuts.
I believe the US government(Donald Trump) doesn't wants high tariffs but is prone to act out harshly to protect his image and thus ended up starting a global trade war.
On warfront there is no actual progress towards a ceasefire and more talks on the diplomatic end, which may not give the fuel to markets for a rally.
Technically there is heavy resistance built by option writing and shorts at 23500 level which may be harder for the market to break in the short term.
I would be adding shorts on price action at resistance and won't be carrying any overnight positions.

Nifty50Analysis of Nifty50 as it couldn't create higher highs also Trade war pushed it down lower than previous low.
weekly trend line analysis also suggest a fake breakout structure.

#NIFTY Intraday Support and Resistance Levels - 09/04/2025Today will be slightly gap down opening expected in nifty. After opening if nifty starts trading below 22450 level then possible sharp downside rally in index upto 22250 level. 22250 will act as a strong support for today's session. Any major downside in index expected below this support level. Upside rally expected if nifty starts trading and sustain above the 22550 level in today's session

Nifty Trend directionNifty 22535 - A broadening descending wedge pattern.
While PUT writers wind up their position around 22658
Call writers covered their shorts from 22428.
This suggests 22567 would be a good resistance
Support is ONLY around 21120

Back in STRUCTURE! But INDIA will recover the STRONGEST!! As we can NIFTY got itself in the structure again and is likely to remain in that structure if not influenced by global cues but looking at a whole INDIAN market looks strongest and less affected as compared to the global market which makes us stay by our analysis of buying the dip till the mother candle is not broken below to plan your trades accordingly and keep watching.

The Nifty spot weekly analysisBased on my analysis, the Trend Trading indicator continues to signal a bullish outlook, with a strong support level at 22,150. However, if Nifty Spot closes below this level on a weekly basis, the next potential support could be around 20,241. Considering the influence of the time factor on price movements, market bearishness may persist until the end of June 2025, with a possible positive shift beginning in July.

Nifty’s Make-or-Break Zone: Will Bulls Charge or Bears Bite?www.tradingview.com
---
### 🧠 **1. Context at-a-glance**
- Recent bounce from a **Demand Zone (D1 Key Level)** around **21,800**.
- Strong bullish rally into a **Supply Zone (~22,600–22,750)**.
- Price is currently showing **hesitation within this resistance**, with smaller-bodied candles forming → potential reversal signals.
- The oscillator has **crossed bullish** from oversold but is nearing a decision zone.
---
### 🔮 **Future Move Scenarios**
#### 🟥 SCENARIO A: **Rejection from Supply Zone** (Most Likely Short-Term)
- **Why?** Price has hit a resistance with fading momentum and no breakout confirmation.
- **What happens?**
- Price retraces toward **22,200**, potentially even **21,800–21,900**.
- Retest of BOS level possible before the next directional leg.
- **Watch for:** Bearish candle formations (engulfing / long wicks), oscillator stalling below 50.
---
#### 🟩 SCENARIO B: **Bullish Breakout Above 22,750**
- **What confirms it?**
- A strong bullish candle closing above 22,750 with follow-through.
- **Next Targets:**
- 🔼 **23,000** (round level and minor resistance)
- 🔼 **23,300–23,500** (old supply zone)
- Eventually back to **23,750+**
- **Oscillator support:** If the indicator crosses 50+, bullish momentum could sustain.
---
### 📉 Oscillator Hints:
- Still below 50 — **recovery in progress**, not full momentum yet.
- If price rejects and oscillator drops → **Bearish divergence** possibility.
---
### 🧭 **Your Playbook**
| Zone | Action Idea | Trigger to Watch |
|------------------|-------------------------------|----------------------------------|
| 22,600–22,750 | Short / Hedge | Rejection candle, loss of momentum |
| 22,200–22,300 | Potential buy zone (aggressive) | Bullish candle or bounce confirmation |
| Break > 22,750 | Buy on Retest or Momentum | Breakout candle + volume |
| < 21,800 | Bearish continuation | Break of demand zone + close below |
---

NIFTY WEDNESDAY ANALYSIS ( NTRADAY) WEEKLY EXPIRY ( 9TH APRIL )Nifty can give a good upside move on Wednesday's weekly expiry session with the condition that it secures 22400 on the downside. On the upside, we can look for levels upto 22880+ if Nifty successfully crosses and sustains above 22650, and stronger momentum is expected if it crosses 22730. All levels are marked in the chart posted .
GUYS, YOU CAN FOLLOW ME ON X FOR DAILY INDEX UPDATES. ID - (@Ishanmathur24 )

Nifty important levels and trade plan for 9th April 2025Nifty important levels and trade plan for 9th April 2025

Nifty 50 Forecast with NEoWave(Update)While many analysts thought that the NIFTY50 correction was over, the index is still moving towards the specified targets. The reason I did not update the index was that we had not yet received confirmations of the end of the correction.
It seems that the minimum target for the NIFTY50 index is the same number as I mentioned earlier and after reaching the target, we will check whether the correction is over or will continue to decline.
The pattern is still diametric and we only changed the position of the labels (c)-(d)-(e). If 23879 is broken strongly, we can say that the NIFTY50 correction is over.
Previous analysis
