Nifty weekly analysis=5 April ,2025. (Scenario 1)The RSI on daily chart made a new high compared to the previous oscillator pivot. The oscillator is becoming overbought and price was not able to cross the previous high on closing basis. This suggests that Nifty is weak.
If this interpretation is correct, then Nifty should break below the previous consolidation and form a double bottom, very near the previous low.
NIFTY trade ideas

NIFTY short term trend is bullish target- 23900
In 15 minute price bars from EWP in recent uptrend it has completed waves (1),(2),(3) and now wave (4) has completed,
wave (4) is complex W X Y X Z pattern witch is arrived in its wave Z
now price need to go higher to form wave (5) its minimum price target is 23900

NIFTY50.....Be prepaired for high volatility!Hello Traders,
the NIFTY50 has declined to my target area @ 23038, and it's test of this boundary failed! It declined further to 22857 points.
I have visualized the opportunity for a triple correction, counted w-x-y-x2-z!
Probably the index is moving back to a wave 4 of lower degree, which is around 21821.45 area. Another target range could be @21137 for the coming one or two weeks.
A break of the upper boundary of the channel opens the door to lower targets in the coming week.
Note! A triple never ever doesn't morph within a trend channel! Keep that in mind!
Anyway! The level of 23869.60 is the one who needs to be extended in the coming one or two weeks. If not, the index has the possibility to crash to new lows. From my view, I need to see a final "sell-off" in the coming one or two weeks, to clear the market and banish those shaky hands!
Overall to speak, I guess we will see high volatility in the index and fast moving price! A gap down in the time ahead, one massive gap-down, has the chance to clear the market!
So, don't be the last who grape a chair, while music stop's playing!
Handle with care and be patient this day's! Otherwise, you will everything you have!
Have a great week.....
Ruebennase
Please ask or comment as appropriate.
Trade on this analysis at your own risk.
Please ask or comment as appropriate.
Trade on this analysis at your own risk.

NIFTY S/R for 7/4/25Support and Resistance Levels:
Support Levels: These are price points (green line/shade) where a downward trend may be halted due to a concentration of buying interest. Imagine them as a safety net where buyers step in, preventing further decline.
Resistance Levels: Conversely, resistance levels (red line/shade) are where upward trends might stall due to increased selling interest. They act like a ceiling where sellers come in to push prices down.
Breakouts:
Bullish Breakout: When the price moves above resistance, it often indicates strong buying interest and the potential for a continued uptrend. Traders may view this as a signal to buy or hold.
Bearish Breakout: When the price falls below support, it can signal strong selling interest and the potential for a continued downtrend. Traders might see this as a cue to sell or avoid buying.
MA Ribbon (EMA 20, EMA 50, EMA 100, EMA 200) :
Above EMA: If the stock price is above the EMA, it suggests a potential uptrend or bullish momentum.
Below EMA: If the stock price is below the EMA, it indicates a potential downtrend or bearish momentum.
Trendline: A trendline is a straight line drawn on a chart to represent the general direction of a data point set.
Uptrend Line: Drawn by connecting the lows in an upward trend. Indicates that the price is moving higher over time. Acts as a support level, where prices tend to bounce upward.
Downtrend Line: Drawn by connecting the highs in a downward trend. Indicates that the price is moving lower over time. It acts as a resistance level, where prices tend to drop.
Disclaimer:
I am not a SEBI registered. The information provided here is for learning purposes only and should not be interpreted as financial advice. Consider the broader market context and consult with a qualified financial advisor before making investment decisions.

How to Trade After Major News Events – The 15-Min Trap SetupHello Traders!
We all get excited when major news hits the market — whether it’s budget day, RBI policy, US inflation data, or company results . But jumping in too early can be a trap. Smart money often creates fake moves in the first few minutes. That’s where the 15-Min Trap Setup becomes a powerful tool for intraday traders.
Let me show you how to avoid traps and catch real moves after news events.
Why the First 15 Minutes Matter
Emotions are high: Retail traders often react instantly without confirmation. This creates liquidity for big players.
Fake breakouts happen often: Price breaks key levels in the first candle — then reverses and traps traders.
Volume is misleading: The biggest volume often comes early, but the real direction is seen later.
The 15-Min Trap Setup – How It Works
Step 1: Wait for the first 15-minute candle to close after a big news event — don’t trade before that.
Step 2: Mark the high and low of this 15-minute candle.
Step 3: Wait for a fake breakout above or below that range — if price breaks out but quickly comes back inside, it’s a trap.
Step 4: Enter in the opposite direction of the breakout after confirmation — ride the real move.
When to Use This Strategy
Major economic events – like Fed decisions, budget day, inflation data, RBI policies.
Company results – high-impact earnings or news releases.
Gap up/gap down openings after big global cues.
Rahul’s Tip
Don’t react — observe. Let the market show its trap. Big players love early overconfidence. Use their game to your advantage by planning around the 15-min candle.
Conclusion
The 15-Min Trap Setup helps you avoid emotional trades and catch the real move after major news. Be patient, mark your zones, and strike when the trap is confirmed. This simple rule can completely change your intraday game.
Have you ever been trapped in the first candle after news? Let’s share experiences below and grow together!


Nifty Wkly Outlook: Market Volatility, Supprt Lvls & Possible
Nifty ended the week at 22,904, marking a significant decline of 600 points from the previous week’s close. The index reached a high of 23,565 and a low of 22,857. As anticipated, the dragonfly doji formation from last week, coupled with concerns over Trump’s new tariff measures taking effect from April 2nd, contributed to global market jitters. These factors spooked investors and led to heightened volatility across the board.
My initial forecast for Nifty's trading range this week was 24,000-23,000, but the lower end of that range was breached by 150 points, indicating increased downside pressure. Looking ahead, there is potential for Nifty to find support around the 22,600/22,400 zone, where it may consolidate and form a base to attempt a rebound towards the 24,000 level. However, if the index were to break below the critical support level of 21,964 (which, frankly, seems unlikely), a deeper correction towards 19,700 could unfold. * That said, I believe most of the negative news has already been priced in, and we could see a market recovery within the next 10-15days, depending on how the bulls respond to this pullback .*
In the global markets, the S&P 500 has closed below its 100-week exponential moving average (WEMA) at 5,074, and if it falls below this week’s low of 5,069, we could see a further slide towards 4,750/4,800, representing a 6% drop from current levels. Should Nifty also correct by 6% from its current position, this aligns with a potential support zone around 21,900/22,000, making it an interesting technical level to watch.
It will be crucial to monitor if the wounded bulls can stage a comeback or if the market will continue its downward trajectory. Stay tuned!

NIFTY APRIL 2ND WEEK ANALYSISIndian markets are looking resilient. But Nifty can further retrace in the first half of the week post US markets tariff reaction . On the downside, Nifty can protect the 22,000 zone, and we can expect it to form a low there . The second half of the week can belong to some short covering provided we do not get fresh negative news.
ALL LEVELS ARE MARKED IN THE CHART POSTED.

Trump Tariffs send global Markets into free fall. Trump Tariff announcements has sent the global markets into free fall. The reaction has sent global markets into knee jerk reaction. Global trade will axis will realign because of these actions of US. As per the analysis of many experts the disadvantages to India are limited. There are opportunities galore in sectors like Pharma and Textile etc. The support levels for Nifty currently are at 22338, 21983, 21289, 20095 and finally 19864. The resistances for Nifty are 23037, 23266 and 23894. Long term Resistance for Nifty remain at 24831 and 25K levels.
Short term outlook for Nifty is weak. In the medium term Nifty can remain range bound and Long term outlook for Nifty still remains strong. Investors with Long term outlook can search for Bottom Fishing opportunities in Blue chip stocks which are available at good prices.
Focus should be on India centric themes where products and companies are less dependent on exports specially to US. Having said that it can be a blessing in disguise for sectors like Pharma and Textile. If Indian leadership can turn this obstacle into oppertunity by taking the right steps it can be a curse in disguise. Investors can also look at collecting some ETFs international as well as local as a long term investment.
In cricket matches sometimes losing a toss can be a blessing in disguise this is something like that.
Disclaimer: The above information is provided for educational purpose, analysis and paper trading only. Please don't treat this as a buy or sell recommendation for the stock or index. The Techno-Funda analysis is based on data that is more than 3 months old. Supports and Resistances are determined by historic past peaks and Valley in the chart. Many other indicators and patterns like EMA, RSI, MACD, Volumes, Fibonacci, parallel channel etc. use historic data which is 3 months or older cyclical points. There is no guarantee they will work in future as markets are highly volatile and swings in prices are also due to macro and micro factors based on actions taken by the company as well as region and global events. Equity investment is subject to risks. I or my clients or family members might have positions in the stocks that we mention in our educational posts. We will not be responsible for any Profit or loss that may occur due to any financial decision taken based on any data provided in this message. Do consult your investment advisor before taking any financial decisions. Stop losses should be an important part of any investment in equity.

Head & Shoulder Pattern in Making in NIfty 50 IndexI can see a clear Neck & shoulder Pattern in Making.
all international Markets are down and now on their Support Area.
Mostly all international Market should bounce back from here.
Nifty 50 once touches 22800 and if takes a support from here it should then proceed toward 23800 to complete H&S pattern.
There is a resistance @ 23800. If market break that resistance then 23800 should act as a Support and Market should Advance for 24800 levels.
"Otherwise"
if Market Crashes below 22800 and doesn't take support here next major support will be 22000 but this is less likely.
Hope for the best!

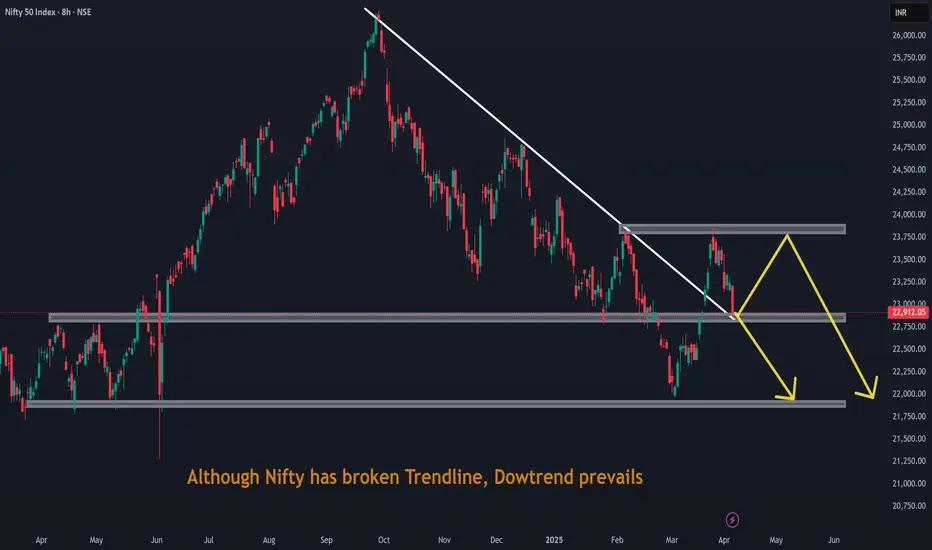
Although Nifty has broken Trendline, Dowtrend prevailsAlthough Nifty has broken Trendline, Dowtrend prevails. Due to global economy turmoil and US tariff war.
Real Reason Most Strategies Fail–“Overfitting” Explained Simply!Hello Traders!
Have you ever seen a strategy work amazingly on historical charts, but fail badly in live markets? You’re not alone. One of the biggest reasons this happens is due to something called Overfitting . Today, let’s understand this concept in the simplest way — so you can avoid falling into this trap and build smarter strategies.
What is Overfitting in Trading?
Overfitting means your strategy is too perfect for past data:
It works great on old charts, but only because it was made to match that exact data.
It fails in real-time because the market changes:
The strategy doesn’t adapt well to new price behavior — it’s not flexible.
Example:
A strategy with 10 indicators giving perfect backtest results may be too specific and only fits that period — not future ones.
Signs Your Strategy Might Be Overfitted
Too many rules or filters:
If your strategy has too many conditions just to improve past results, that’s a red flag.
Works only on one stock or timeframe:
A good strategy should work on different stocks and market conditions.
Great backtest, bad live performance:
If your real trades don’t match the backtest, it might be too customized to the past.
How to Avoid Overfitting in Trading
Keep it simple:
Use fewer indicators and rules. Focus on clean price action and proven setups.
Test on different stocks/timeframes:
See if your setup works across Nifty, Bank Nifty, stocks, or different timeframes.
Use forward testing:
Try the strategy on live charts (paper trade) before putting real money into it.
Rahul’s Tip
A perfect backtest doesn’t mean a perfect future. Build your strategy to be reliable — not just impressive on history.
Conclusion
Overfitting is like memorizing old exam answers and failing the new paper. Don’t build strategies that only look good on past data. Make them strong, simple, and adaptable to real market conditions.
Have you faced this issue before? Let’s discuss in the comments and help each other improve!

levels to watch It's clear that analysts, the media, and others who seek the spotlight often try to explain why the markets moved in a certain direction. The irony, however, is that these explanations usually come after the market has already moved, making it obvious that they’re just linking the moves to some news event.
If you pay close attention, you'll realize that technical tools can provide valuable insights ahead of time, helping you predict how the market will behave and where it’s likely headed. For those who’ve read my past articles, you’ll notice I’ve already highlighted key levels for the Nifty index and the potential targets it could reach.
Whether there were tariffs or not, the market was bound to drop. But as I pointed out, the crash is being blamed on the tariffs.
As long as the markets remain below the 24,000 level, we can expect them to target 21,800 and possibly even lower in the coming weeks.
I had booked profits for some of my stocks around the 21,800 level and re-entered short positions at 23,800.
7 April Nifty50 important level trading zone #Nifty50
99% working trading plan
👆Gap up open 22920 above & 10m hold after positive trade target 23020, 23130
👆Gap up open 22920 below 10 m not break upside after nigetive trade target 22860, 22823, 22709
👆Gap down open 22862 above 15m hold after positive trade target 22918, 23018
👆Gap down open 22862 below 10 m not break upside after nigetive trade target 22818, 22709
⚡big gapdown open 22709 above hold 1st positive trade view
⚡big Gapup opening 23020 below nigetive trade view
Tep . Market new base hi carefully
📌For education purpose I'm not responsible your trade More education following me

Nifty levels - Apr 07, 2025Nifty support and resistance levels are valuable tools for making informed trading decisions, specifically when combined with the analysis of 5-minute timeframe candlesticks and VWAP. By closely monitoring these levels and observing the price movements within this timeframe, traders can enhance the accuracy of their entry and exit points. It is important to bear in mind that support and resistance levels are not fixed, and they can change over time as market conditions evolve.
The dashed lines on the chart indicate the reaction levels, serving as additional points of significance to consider. Furthermore, take note of the response at the levels of the High, Low, and Close values from the day prior.
We hope you find this information beneficial in your trading endeavors.
* If you found the idea appealing, kindly tap the Boost icon located below the chart. We encourage you to share your thoughts and comments regarding it.
Wishing you success in your trading activities!

Nifty Chart DevelopmentA beautiful Inverse Head & Shoulder pattern under formation on the daily chart of Nifty 50.
The support level stands in the range 22600-22800.
Do your own research before taking any financial decision.

Nifty 50 - Potential Reversal or Further Weakness?The Nifty 50 index has formed a potential inverse head and shoulders pattern on the daily timeframe, which generally indicates a bullish reversal. However, there are key levels to watch before confirming the next move.
Key Observations:
Support Levels:
The 50% Fibonacci retracement level at 22,937 is a crucial support.
The 61.8% Fibonacci retracement level at 22,717 is another key demand zone.
A break below these levels may invalidate the bullish setup and push Nifty towards 22,400 or lower.
Resistance Levels:
Immediate resistance is near 23,157 (38.2% Fib level).
A strong breakout above 23,430 (23.6% Fib) could open the door for a retest of 23,870 and beyond.
Volume & Confirmation:
Increasing volume at the lows suggests strong buyer interest.
A confirmed breakout with volume above 23,200-23,400 will strengthen the bullish case.
Trading Plan:
Bullish Scenario: If Nifty holds above 22,717, we may see an upward move towards 23,400+.
Bearish Scenario: A break below 22,700 could accelerate selling pressure, with 22,400-22,000 as the next support zones.

Nifty May have bottomed on News As per Elliott wave sequence it is coming to mind that it has completed a complex correction in the form of WXYZ. Todays bottom is very important and it also related to by the fibs 61.8 level.
For further rally it should cross the 23300 mark in less time then the c leg of z has completed its move downwards...the c leg has completed the move in 24 bars of 15 minutes and it will have cross it before 24bars....! finger crossed...!
No buy sell recommendation. Just a view.

NiftyNifty harmonic at its best, perfect reversal frm prz. We are at a support but its still lagging momentum.

Bullish reversalprevious month candle had formed bullish engulfing. so at the price level 22807 will be buying level.

5 waves down in NIFTY. Potential downside aheadNSE:NIFTY has a 5 wave down formation as of now in daily which potentially means that the recent rise could have been a counter-trend and the primary trend remains downward. A breach of 23676 should be another confluence for downside view.

Nifty short with 1:4 risk to reward A significant downward movement to continue with really good R:R of 1:4 . It would also be a spill over effect given that SPX has already fell almost 5%. Nifty to follow .

#NIFTY Intraday Support and Resistance Levels - 04/04/2025Gap down opening expected in nifty near 23200 level. After opening if nifty starts trading below this level then possible strong downside upto 23000 level in opening session. Currently consolidated movements in nifty. If nifty sustain above 23250 level then possible upside movement upto 23450 level. For today's session 23450 level will act as a strong resistance for index.
