Still below 23400 ! As per our plan every rise is being sold till it sustained above 23400 hence we will stand by our analysis of selling the rise and unless it sustains itself above 23400 the trend will not be changed so plan your trades accordingly and keep watching.
NIFTY trade ideas

4 April Nifty50 important level & trading zone #Nifty50
99% working trading plan
👆Gap up open 23273 above & 15m hold after positive trade target 23332, 23393
👆Gap up open 23273 below 15 m not break upside after nigetive trade target 23192, 23113
👆Gap down open 23192 above 15m hold after positive trade target 23273, 23332
👆Gap down open 23192 below 15 m not break upside after nigetive trade target 23113, 23063
💫big gapdown open 23113 above hold 1st positive trade view
💫big Gapup opening 23332 below nigetive trade view
📌For education purpose I'm not responsible your trade
More education following me

Nifty Vs EM & ACWIComparision of Nifty price performance with emerging markets & All country world index

Nifty levels - Apr 04, 2025Nifty support and resistance levels are valuable tools for making informed trading decisions, specifically when combined with the analysis of 5-minute timeframe candlesticks and VWAP. By closely monitoring these levels and observing the price movements within this timeframe, traders can enhance the accuracy of their entry and exit points. It is important to bear in mind that support and resistance levels are not fixed, and they can change over time as market conditions evolve.
The dashed lines on the chart indicate the reaction levels, serving as additional points of significance to consider. Furthermore, take note of the response at the levels of the High, Low, and Close values from the day prior.
We hope you find this information beneficial in your trading endeavors.
* If you found the idea appealing, kindly tap the Boost icon located below the chart. We encourage you to share your thoughts and comments regarding it.
Wishing you success in your trading activities!

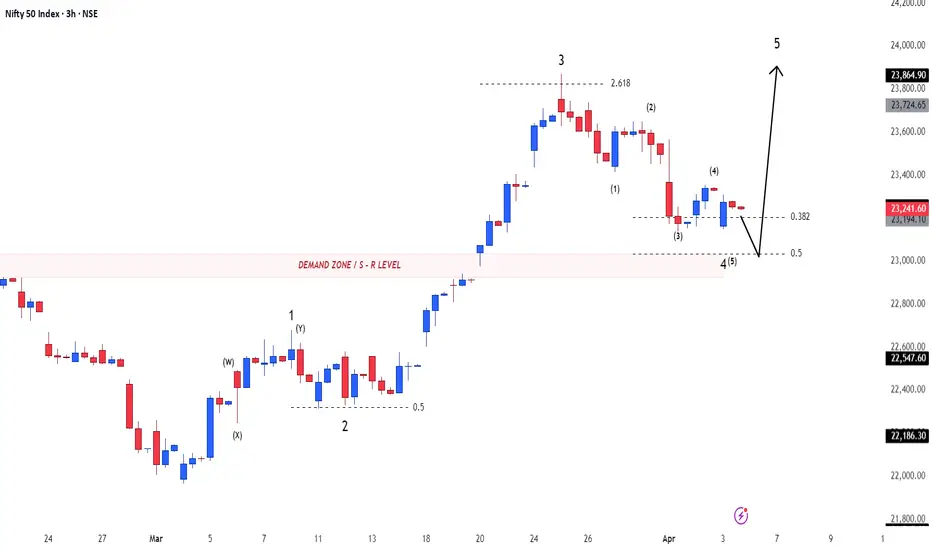
NIFTY 50 NIFTY 50 INDEX
- Completed " 1234 " Impulsive Waves
- Break of Structure
- S / R Level
- Change of Characteristics
- Fibonacci Level - 38.20% / 50.00%
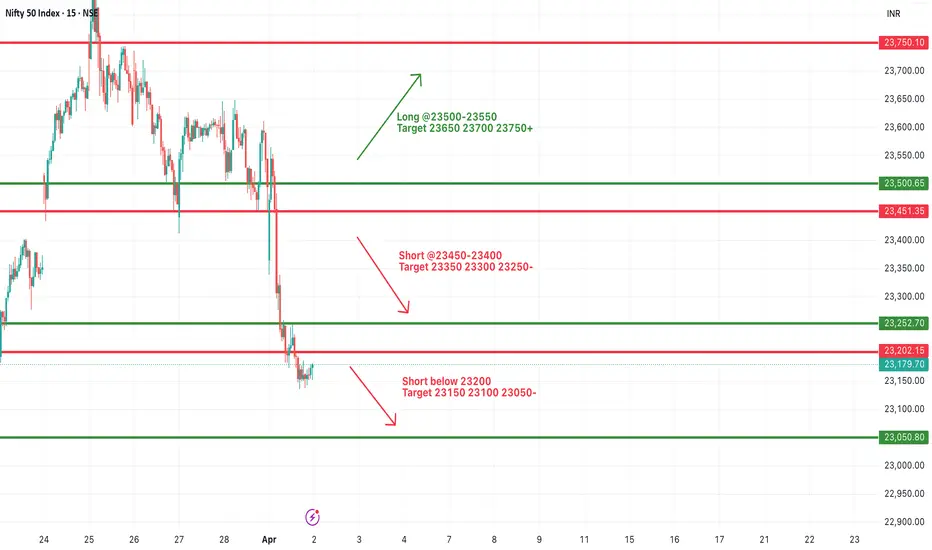
#NIFTY Intraday Support and Resistance Levels - 03/04/2025Gap down opening expected in nifty. After opening if nifty starts trading below 23200 level then possible sharp downside rally upto 23000 level. Any bullish side rally can face resistance at 23450 level. Expected reversal from this level. Major upside movement only expected if nifty starts trading and sustain above 23500 level.

Nifty Analysis 03.04.2024As of April 3, 2025, the Nifty 50 index is experiencing volatility influenced by recent geopolitical developments, particularly the announcement of new U.S. tariffs on Indian imports. On April 1, 2025, U.S. President Donald Trump declared a 26% reciprocal tariff on imports from India, a move that has unsettled markets and is expected to pressure Indian equities.
In the trading session on April 1, 2025, the Nifty 50 declined by 0.25% to close at 23,468.8, reflecting investor concerns over the impending tariffs. Technology stocks, which derive significant revenue from the U.S., were notably impacted, with a 1.8% drop amid expectations of subdued earnings in the upcoming fiscal year.
Despite these challenges, the Nifty 50 showed resilience in March 2025, recording a 6.3% gain—the strongest monthly performance in 15 months. This rebound was driven by investor interest in undervalued stocks, renewed foreign inflows, and improving economic indicators. However, the recent tariff announcement poses new risks that could influence market performance in April.
Analysts suggest that the Nifty 50 may face headwinds in the near term due to the tariff situation and its potential impact on various sectors. Historical trends indicate that after a strong March performance, April often sees limited gains or negative returns. Investors are advised to monitor developments closely and consider sector-specific implications when making investment decision

Nifty 50 - Inverse Head & Shoulders Pattern | Potential Reversal🔍 Pattern Identified: Inverse Head & Shoulders (IHS)
We can see a classic IHS formation on the Nifty 50 Index (4H timeframe), which is a bullish reversal pattern.
📝 Key Observations:
✅ Prior Downtrend: A prolonged bearish move before the pattern formation.
✅ Left Shoulder: Initial low followed by a bounce.
✅ Head: A lower low, forming the bottom of the pattern.
✅ Right Shoulder: A higher low, signaling reduced bearish pressure.
✅ Neckline Resistance: Breakout above 23,500 could confirm the pattern.
📊 Potential Trading Plan (For Learning Purposes Only! Not Financial Advice)
🔹 Entry: Above neckline breakout (~23,500)
🔹 Target: Measured move projection (~24,500-24,700)
🔹 Stop-Loss: Below right shoulder (~22,750)
🔹 Risk-Reward: Should be favorable (minimum 1:2)
⚠️ Important Considerations:
🔹 Volume Confirmation: A breakout should have strong volume to be valid.
🔹 Retest Possibility: Price may retest neckline before moving higher.
🔹 Market Conditions: Always check global cues and sentiments before executing trades.
📢 Disclaimer: This analysis is for educational purposes only and does not constitute financial advice. I am not a SEBI-registered analyst. Always do your own research and consult a qualified financial professional before making investment decisions. Trade responsibly! ✅


nifty 50 reaction on liberation day | trump speechsentiments are bearish
fundamentals bearish until interest rates change

Nifty Trend directionTechnical View
Nifty 23332 - Is near the resistance 23360. As long as it trades below the resistance we shall expect Nifty to test the resistance 23098,22840.
Market View
FII have sold in cash and Write Call options. Last hour around 3 crore short windup and 3 crore profit booking has helped Nifty to rose from 23290 to 23348.
Intraday trade clue based on FII
IF short buildup increase today in morning session, expect Nifty to go up futures as FII has to trap writers.
IF PUT buildup increase today in morning session expect Nifty to go down as FII's has to increase their profit.

Nifty Assumed movesNifty Last close as on 2 nd APril 2025 @23332.35
Initial estimated zone from bottom bounce back zone expected in nxt 20-45 trading sessions
count from 3 rd April 2025 onwards after retesting bottom zone as marked in chart

NIFTY weak below 23400As we can see NIFTY did try closing itself above our zone but failed and hence unless it closes above the supply zone every rise could be sold as the previously acting demand zone could now act as a strong supply zone which could show another rejection and continuation of downtrend so plan your trades accordingly and keep watching
3 April Nifty50 important level trading zone #Nifty50
99% working trading plan
🎯Gap up open 23372 above & 15m hold after positive trade target 23532, 23733+
📌Gap up open 23372 below 15 m not break upside after nigetive trade target 23318,
🎯Gap down open 23318 above 15m hold after positive trade target 23372, 23532, 23733
📌Gap down open 23318 below 15 m not break upside after nigetive trade target 23258
💫big gapdown open 23258 above hold 1st positive trade view
💫big Gapup opening 23532 below nigetive trade view
📌For education purpose I'm not responsible your trade
More education following me

nifty 23400 or again down 22800nifty 23400 or again down 22800
Nifty 50, often referred to as "Nifty," is a benchmark stock market index in India. It represents the weighted average of 50 of the largest and most liquid Indian companies listed

Nifty levels - Apr 03, 2025Nifty support and resistance levels are valuable tools for making informed trading decisions, specifically when combined with the analysis of 5-minute timeframe candlesticks and VWAP. By closely monitoring these levels and observing the price movements within this timeframe, traders can enhance the accuracy of their entry and exit points. It is important to bear in mind that support and resistance levels are not fixed, and they can change over time as market conditions evolve.
The dashed lines on the chart indicate the reaction levels, serving as additional points of significance to consider. Furthermore, take note of the response at the levels of the High, Low, and Close values from the day prior.
We hope you find this information beneficial in your trading endeavors.
* If you found the idea appealing, kindly tap the Boost icon located below the chart. We encourage you to share your thoughts and comments regarding it.
Wishing you success in your trading activities!

Nifty - Awaiting the Fifth Wave for a BreakoutNifty recently hit a low of 21,905 , marking a key reversal point in the trend. A well-defined Head and Shoulders pattern is emerging, with the right shoulder currently forming. The ongoing pullback has retraced to the 38.2% level, but there is potential for it to extend towards the 50% mark at 22,906 . However, the upward move appears to be losing momentum, with buying interest remaining subdued.
Based on the chart, the head of the pattern signifies the beginning of a new impulse wave. This appears to be the fourth wave within the larger first wave. Once Nifty completes this corrective phase, the fifth wave is expected to present a trading opportunity. If wave equality holds, Nifty could potentially rise to 24,857 .

#NIFTY Intraday Support and Resistance Levels - 02/04/2025Today will be slightly gap up opening expected in nifty. After opening if nifty starts trading below 23200 level then expected sharp downside upto 23050 level in opening session. Upside 23450 level will act as a strong resistance for today's session. Any bullish side rally can reversal from this level.
Nifty analysis 02.4.2025As of April 2, 2025, the Nifty 50 index has experienced notable fluctuations influenced by global economic developments. On April 1, the index declined by 1.5% to close at 23,165.7, marking its steepest drop since February 28. This downturn was primarily attributed to investor apprehension regarding anticipated reciprocal tariffs from U.S. President Donald Trump.
mint
Despite this decline, market indicators suggest a potential rebound. Futures point to a modest recovery, with the Gift Nifty trading around 23,327, indicating a flat to slightly positive opening for the Nifty 50. Technical analyses present a mixed outlook; some indicators show neutral trends, while others suggest a bearish sentiment.
Additionally, a recent shift in investment patterns has been observed, with increased inflows into gold exchange-traded funds (ETFs) as investors seek safe-haven assets amid equity market volatility.

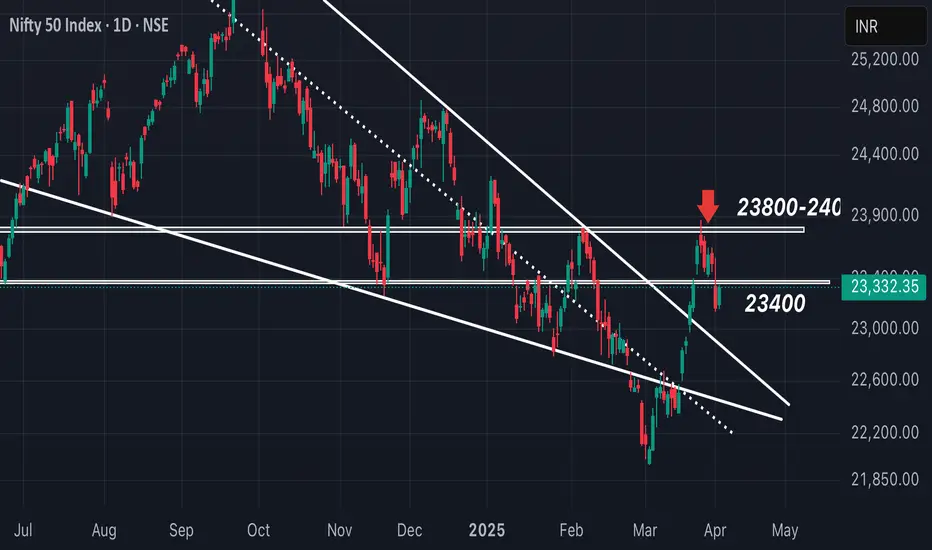
Nifty 50:Nifty 50:
As mentioned in our earlier posts Nifty 50 index has come down from 23875 to 23165 in the last 3 days.
The immediate resistance lies @23600-23700, while the support @ 22300.
What's possible next?
Nifty 50 has to come down over the next few days to 200-300 points to continue its possible upward trajectory.
Buy on dip market is on hold until 22300.
Cheers.
Note: As always look for potential value buys.

Nifty is holding on above the Father line but by a thin margin.After reaching a weekly high of 23869 Nifty decided to fall back in search of its support zone. Currently it is holding above the Father line in the daily chart which is at 23406. Below the Father line there is Mother line waiting to support Nifty at 23114 in case the weakness seen on Friday persists. We will be in trouble again in case we get a daily or weekly closing below this level. In such a scenario the supports for Nifty will be at 22827, 22294 and 21939. In case the Nifty is able to gain momentum again the resistances it will face will be near 23536, 23671 and 23864. Closing above 23869 will enhance the short term momentum in Nifty which can lead it to 24K+ levels.
To know more about supports, Resistances, investing in stocks based on sector index, Trend lines Parallel Channels, Mother, Father and small Child Theory, Behavioural finance, Fundamental analysis, Technical analysis, Profit booking etc. Read my book The Happy Candles Way to Wealth creation. It is as on date one of the highest rated books on Amazon. The paperback version and Kindle can be bought through Amazon. You can also contact me to buy the same.
Things are slightly off balance with shadow of the candle just slightly in favour of bears as of now but Bulls will definitely try and retake the advantage back to their side given a slight opportunity. So the Bull and Bear tussle to continue into April and may escalate given Trump Tarif announcements and upcoming result season.
Disclaimer: The above information is provided for educational purpose, analysis and paper trading only. Please don't treat this as a buy or sell recommendation for the stock. No one can guarantee any success in highly volatile market or otherwise. There is also chance of bias in our opinion. The supports and resistances indicated are based on data which has a cycle time of being 3 months or older so it is not necessary that it will work. The author or Smart Investment will not be responsible for any Profit or loss that may occur due to any financial decision taken based on any data provided in this message.

NIFTY approaching 23000-22900-22800 levels As we can see NIFTY looks more weak as it has broken the consolidation making it weaker. Now that it has confirmed the weakness and expected to reach its next eminent demand zone of 23000-22900 levels hence till the zone is reached, every rise can be shorted so plan your trades accordingly and keep watching.

2 April Nifty50 important level trading zone #Nifty50
99% working trading plan
Gap up open 23231 above & 15m hold after positive trade target 23312, 23432
Gap up open 23231 below 15 m not break upside after nigetive trade target 23114, 23070
Gap down open 23114 above 15m hold after positive trade target 23231, 23312
Gap down open 23114 below 15 m not break upside after nigetive trade target 23070 , 22995
💫big gapdown open 23070 above hold 1st positive trade view
💫big Gapup opening 23312 below nigetive trade view
📌For education purpose I'm not responsible your trade
More education following me
