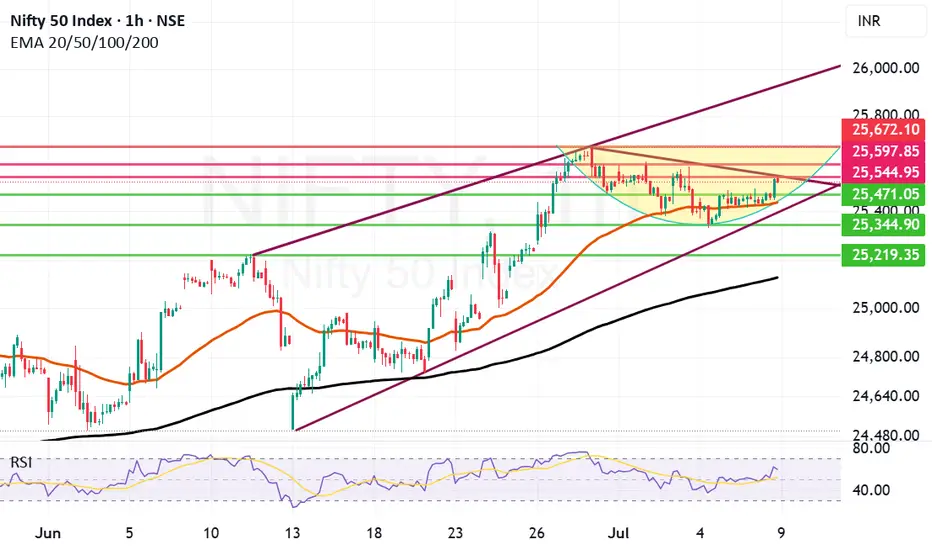
Closing above 25544 should be first step for Nifty to break freeNifty today closed in positive but still it might not be free enough to crate further bull run. the first step that Nifty needs to take to get out of this range bound trade zone or consolidation is to get a closing above 25544.
Further to this step it my find resistances at 25597, 25672. Once we close above 25672 the possibility that Bulls can regaining 26K levels and go even higher becomes stronger.
The Supports for Nifty currently remain at 25471, 25437 which is Mother line or 50 Hours EMA, 25344, 25219 and finally 25125. 25125 is the Father line support or 200 hours EMA. Closing below 25215 will empower Bears to drag Nifty further down wards.
Disclaimer: The above information is provided for educational purpose, analysis and paper trading only. Please don't treat this as a buy or sell recommendation for the stock or index. The Techno-Funda analysis is based on data that is more than 3 months old. Supports and Resistances are determined by historic past peaks and Valley in the chart. Many other indicators and patterns like EMA, RSI, MACD, Volumes, Fibonacci, parallel channel etc. use historic data which is 3 months or older cyclical points. There is no guarantee they will work in future as markets are highly volatile and swings in prices are also due to macro and micro factors based on actions taken by the company as well as region and global events. Equity investment is subject to risks. I or my clients or family members might have positions in the stocks that we mention in our educational posts. We will not be responsible for any Profit or loss that may occur due to any financial decision taken based on any data provided in this message. Do consult your investment advisor before taking any financial decisions. Stop losses should be an important part of any investment in equity.
NIFTY trade ideas
#NIFTY Intraday Support and Resistance Levels - 08/07/2025Nifty is expected to open flat with no major change in the overall levels compared to the previous session. The index continues to hover near a crucial resistance zone around 25450–25500. A breakout above 25550 will indicate bullish strength and may lead to an upward move toward 25600, 25650, and even 25750+. This zone has been tested multiple times, and a decisive break can attract further buying.
On the downside, the support remains at 25450. A break below this level can invite selling pressure, with immediate targets at 25350, 25300, and 25250-. The market is clearly respecting this consolidation band, so any directional move will depend on a confirmed breakout or breakdown from these levels.
Traders should remain cautious and avoid early entries unless a clean move is seen beyond the 25550 or below the 25450 levels.


$NSE:NIFTY is Going to Burst Up Side ! SkyRocketing TIme is NearNSE:NIFTY is Going to Burst Up Side ! SkyRocketing TIme is Near
NIFTY 50 BULLISH REVIEW (My View) 💥
📈 Current Bias: BULLISH
✅ Nifty 50 showing strong resilience above key support levels.
✅ The index is holding well above recent consolidation zones and looks ready for further upside.
✅ Momentum indicators (like RSI) are staying in positive territory, showing sustained strength.
✅ Higher highs & higher lows structure intact on daily chart — bulls in control!
🔑 Key Levels:
👉 Immediate support: 23,333 - (watch for buying interest here)
👉 Resistance ahead: 23,850 - 23,900 (break above = fresh rally potential)
🌟 What I’m Watching:
🚀 Breakout above 23,900 could open doors towards 24,200+ levels in the coming sessions.
🚀 Strong sector participation from banks, IT, and autos — a broad-based rally is a positive sign.
🚀 Keep an eye on global cues + FII activity — may add fuel to the trend.
NSE:NIFTY is Going to Burst Up Side ! SkyRocketing TIme is Near


NIFTY 1st TGT is doneNifty initial v - pattern TGT is achieved as shown in chart
base 21971
breakout @ 23822
tgt @ 25663
Whats next ? will be posting shortly with time cycle and price cycle.

Nifty in Volatile Range#NIFTY FUT– 25,508.0
S1 – 25,395.0
S2 – 25,348.0
R1 – 25,658.0
R2 – 25,718.0
Doji formation has seen post Red
candle with inline volume,
indicates consolidation on daily
chart. Nifty has closed above 7, 14
and 21 DMA that seen at 25487,
25337 and 25222 levels. Nifty
future has resistance at 25658
levels while support seen at 25395
level..
More support and Resistance Show in chart...
All information Education Purpose only

Nifty facing strong resistance between 25587 and 25500. Nifty today again failed to hold levels above 25500 as it made a high of 25587 and closed at 25405. Closing almost 182 point from its high today and 48 points down from yesterday. This is a worrying sign even if just slightly as for moving towards 26K we need a strong closing of the week at least above the Mother line. Nifty closed just below Motherline today which is showing some weakness in the rally which seems to be losing direction. The fear of Tariffs seems to be taking toll on Bulls whereas bears are currently gaining strength. The closing we get tomorrow will indicate a definitive direction to Nifty.
The Supports for Nifty currently remain at: 25385, 25299, 25177 (strong trend line support) and finally we will have Father line support of Hourly candles which is at 25050. Closing 25050 below will have potential to drag Nifty further down towards 24700 which is again a strong Channel bottom support.
The Resistances for Nifty currently remain at: 25416 (Mother line Resistance), 25470, The zone between 25500 and 25587 is a strong Trend line resistance. A closing above 25587 will have potential to take Nifty towards 25603, 25679 or even 25759 (Which is again a strong Channel top resistance).
Disclaimer: The above information is provided for educational purpose, analysis and paper trading only. Please don't treat this as a buy or sell recommendation for the stock or index. The Techno-Funda analysis is based on data that is more than 3 months old. Supports and Resistances are determined by historic past peaks and Valley in the chart. Many other indicators and patterns like EMA, RSI, MACD, Volumes, Fibonacci, parallel channel etc. use historic data which is 3 months or older cyclical points. There is no guarantee they will work in future as markets are highly volatile and swings in prices are also due to macro and micro factors based on actions taken by the company as well as region and global events. Equity investment is subject to risks. I or my clients or family members might have positions in the stocks that we mention in our educational posts. We will not be responsible for any Profit or loss that may occur due to any financial decision taken based on any data provided in this message. Do consult your investment advisor before taking any financial decisions. Stop losses should be an important part of any investment in equity.

Nifty 50’s Long-Term-Unpacking the Multi-Year ConsolidationChart showcases the Nifty 50 Index on a weekly timeframe, highlighted with multi-year consolidation patterns, key Fibonacci retracement levels, and a suggested buy zone—here’s a compelling publishing idea tailored for both traders and long-term investors:

Wave counts on larger TFThis is how I see Nifty wave count on a Larger TF. We are currently in wave 4 correction of after covid bull run of wave 3. We have corrected 0.236 of this post covid growth by Feb's end and going to correct up to 0.382 level now.

nifty view .. bullish nifty is in bullish cahnnel. itmay touch 26180 , 27000, 27254 ,27861 by the end of 2026 or mid 2027.
enjoy 27000 crossing in 2027

NIFTY Short Term View <25650-25200>If you follow my other ideas, I think you are gaining trust on the tool ZZ. Please don't blindly follow me and my posts. I just want to make you curios that one tool with clear idea is enough to predict the market. But condition is you have to practice a ton.
Here I am sharing just glimpse of it, there are so many things to do with ZZ.
Keep learning || Trust analysis || Keep Trading & Investing
Any question or suggestion please feel free to comment below.

NIFTY THIS WEEK? What's the plan
"There’s more hidden in a candle chart than most headlines will ever reveal.”
If you look at this NIFTY chart casually, you’ll see just another uptrend. But if you feel the price — really look into the structure — you’ll notice something deeper:
We’re not just in a rally. We’re in a breakout after base-building. And that’s a very different game.
What I Noticed This Week:
1. Strong Follow-Through
NIFTY didn’t just pop — it’s sustaining gains. Each green candle is following the next without hesitation. That means institutions are buying, not just retailers reacting.
2. Previous Resistance = Gone
Look back at 25,200–25,300. That zone rejected price multiple times. Now? It’s broken clean, with a bullish Marubozu-style candle. That’s a confirmation, not just a fluke.
3. No Panic Selling Yet
Usually, breakouts invite profit booking. This one? Sellers are quiet. When there's no rejection at new highs, it tells you confidence is strong.
But Here’s What You Must Watch:
Are we near psychological exhaustion? Markets can get euphoric and overextend - even in strong trends. Volume Spike or Divergence? If volumes dry or RSI starts diverging, stay alert.
Global cues & Bank Nifty:
If Bank Nifty stalls, NIFTY will slow too. Watch correlation.
What This Means for You:
Trend is strong, but smart traders plan exits in upmoves - not panic in downmoves.
Ask yourself:
Do you have entries based on structure?
Are you overexposed at highs, hoping for more?
Are you following momentum blindly or with plan?
Personal Reflection:
I’ve learned this the hard way:
“Buying strength is good. But riding strength without a stop loss is just greed in disguise.”
So this week:
Observe, don’t chase.
Track - don’t blindly enter.
There’s always another breakout. But there’s only one portfolio.

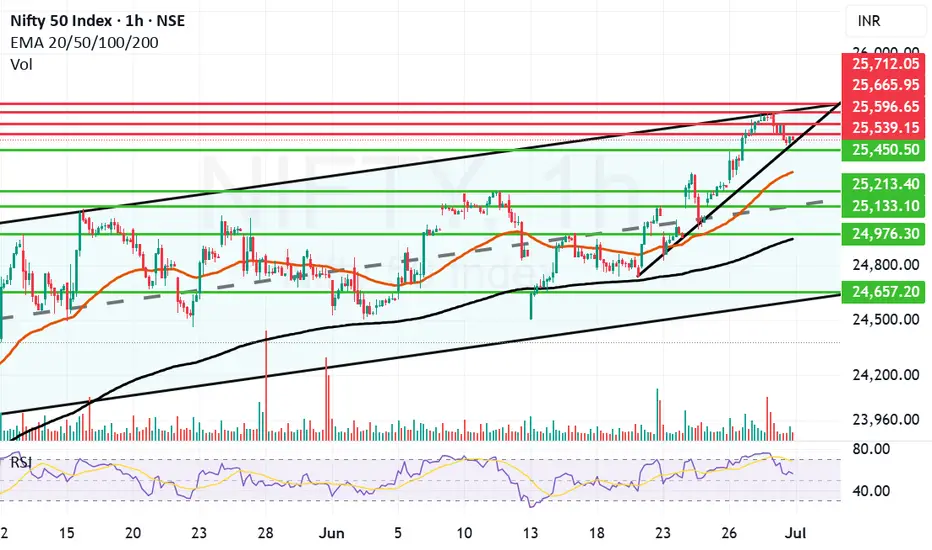
Nifty goes into consolidation mode to end the month at 25500.Today Nifty went into consolidation mode searching for the supports nearby after a massive upward run in the last week. Even though we saw Nift climbing down 120 points today the closing above 25500 is a good sign. It was a volatile day where Nifty made a high of 25669 and a low of 25473 moving 200 points down. But recovered a bit to close at 25517.
The Supports for Nifty remain at: 25450, 25321 (Mother line Support), 25133 (Mid-channel support). If that is broken the Nifty may fall further towards 24976 or 24956 (Which is the Father line support). Channel bottom seems to be at 24657. If we get a closing below this zone we will comment about further supports on the down side.
The Resistance for Nifty remain at: 24539, 24596, 25665 and finally 25712. (25712 seems to be the channel and trend top. Once Nifty closes above this zone we will be able to comment about further levels on the upside.
Disclaimer: The above information is provided for educational purpose, analysis and paper trading only. Please don't treat this as a buy or sell recommendation for the stock or index. The Techno-Funda analysis is based on data that is more than 3 months old. Supports and Resistances are determined by historic past peaks and Valley in the chart. Many other indicators and patterns like EMA, RSI, MACD, Volumes, Fibonacci, parallel channel etc. use historic data which is 3 months or older cyclical points. There is no guarantee they will work in future as markets are highly volatile and swings in prices are also due to macro and micro factors based on actions taken by the company as well as region and global events. Equity investment is subject to risks. I or my clients or family members might have positions in the stocks that we mention in our educational posts. We will not be responsible for any Profit or loss that may occur due to any financial decision taken based on any data provided in this message. Do consult your investment advisor before taking any financial decisions. Stop losses should be an important part of any investment in equity.
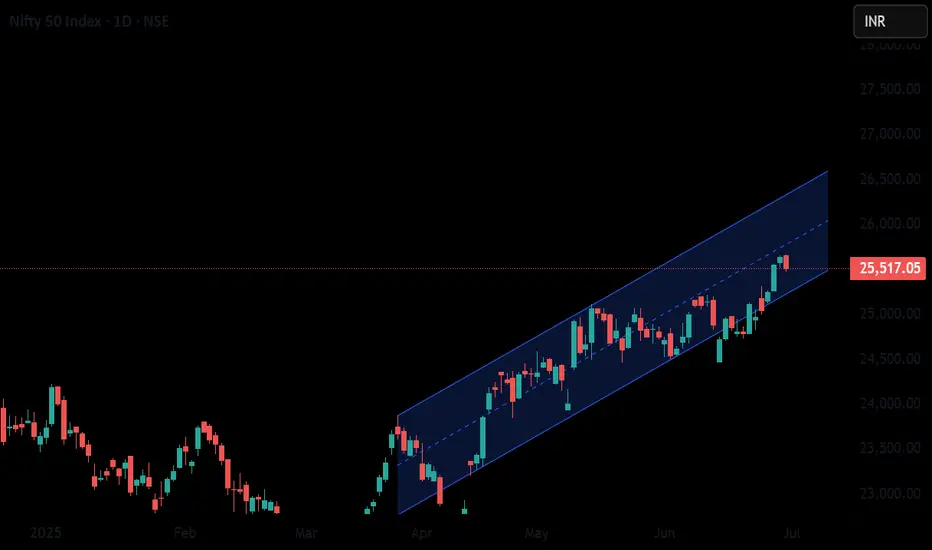
Nifty 50 moving in upward channel, with strong foundation Apparently NIfty 50 is moving in a upward channel to its all time high probably.
Nifty levels - Jul 01, 2025Nifty support and resistance levels are valuable tools for making informed trading decisions, specifically when combined with the analysis of 5-minute timeframe candlesticks and VWAP. By closely monitoring these levels and observing the price movements within this timeframe, traders can enhance the accuracy of their entry and exit points. It is important to bear in mind that support and resistance levels are not fixed, and they can change over time as market conditions evolve.
The dashed lines on the chart indicate the reaction levels, serving as additional points of significance to consider. Furthermore, take note of the response at the levels of the High, Low, and Close values from the day prior.
We hope you find this information beneficial in your trading endeavors.
* If you found the idea appealing, kindly tap the Boost icon located below the chart. We encourage you to share your thoughts and comments regarding it.
Wishing you success in your trading activities!

NIFTY 50 INDEX CHART ANALYSIS FOR INTRADAYNIFTY 50 INDEX CHART ANALYSIS FOR INTRADAY.
here we are seeing of nifty 50 index chart, and one is resistance and one box is support that is yellow color and if price will come to support and then we will try to find of buy opportunity. if support zone breaks then we will plan for sell of nifty and if break of resistance, then we will see big rally.

Rising Nifty momentum has broken major ResistanceRising Nifty momentum has broken major Resistance. Global cues are positive for Indian stock markets.

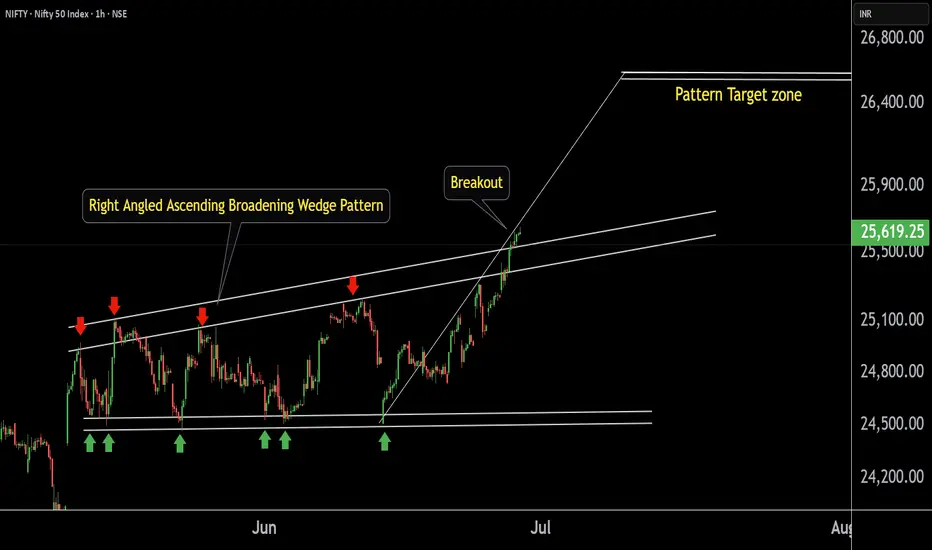
NIFTY 50 key level This is the 1 hour chart of NIFTY 50 .
NIFTY 50 has formed Right Angled Ascending Broadening Wedge Pattern.
Nifty 50 has given a breakout from its pattern.
If Nifty 50 sustains after a successful retest post-breakout, we may see higher prices in Nifty 50.
The target for this pattern is projected near the 26,600 level.
Thank You !!
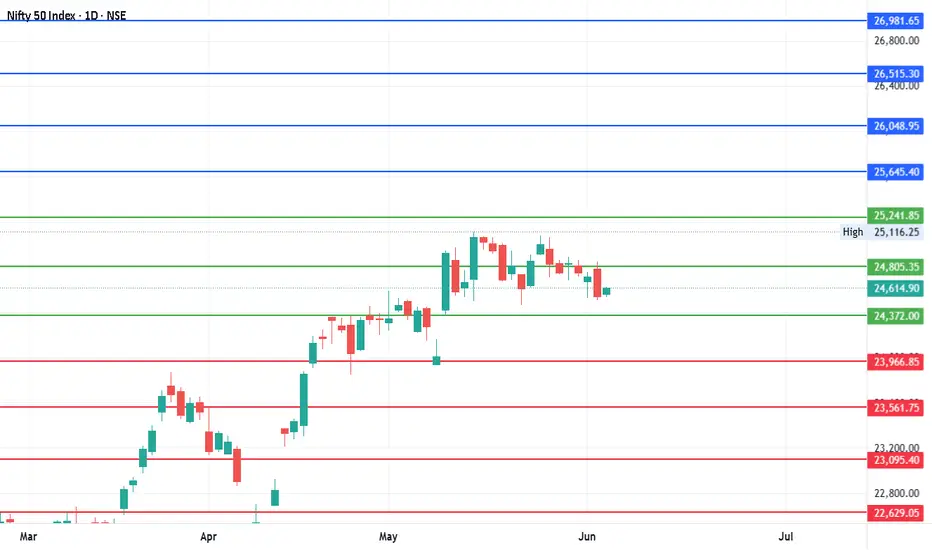
#Nifty - Quarterly Pivot is 24805.35 | 22629.05 or 26981.65?Date: 04-06-2025
Pivot Point: 24805.35 Support: 24371.98 Resistance: 25241.83
Upside Targets:
Target 1: 25645.39
Target 2: 26048.95
Target 3: 26515.30
Target 4: 26981.65
Downside Targets:
Target 1: 23966.86
Target 2: 23561.75
Target 3: 23095.4
Target 4: 22629.05
#Nifty
#NiftyChartPatterns
#NiftyTrendAnalysis
Nifty - Reposting of previous Levels Again
This is just a "Reposting of #Nifty previous Levels Again" to help you to remember so that you can plan your activity accordingly. Every level plays a key level as target, support and resistance.
Previous Levels
Current Price: 24,461.15
Mid-point: 24413.83
Upside: 24913.61, 25115.13, 25378.11 and 25641.10
Downside: 23914.92, 23712.53, 23449.54 and 23186.55
Resistance: 24712.10
Stop loss: 24117.31
#Nifty

#Nifty - Pivot Point is 24850.48 | 23597.30 or 26103.65?Date: 06-06-2025
#Nifty Current Price 25000
Pivot Point: 24850.48 Support: 24548.09 Resistance: 25154.65
Upside Targets:
Target 1: 25360.61
Target 2: 25566.58
Target 3: 25835.11
Target 4: 26103.65
Downside Targets:
Target 1: 24341.23
Target 2: 24134.375
Target 3: 23865.8375
Target 4: 23597.30

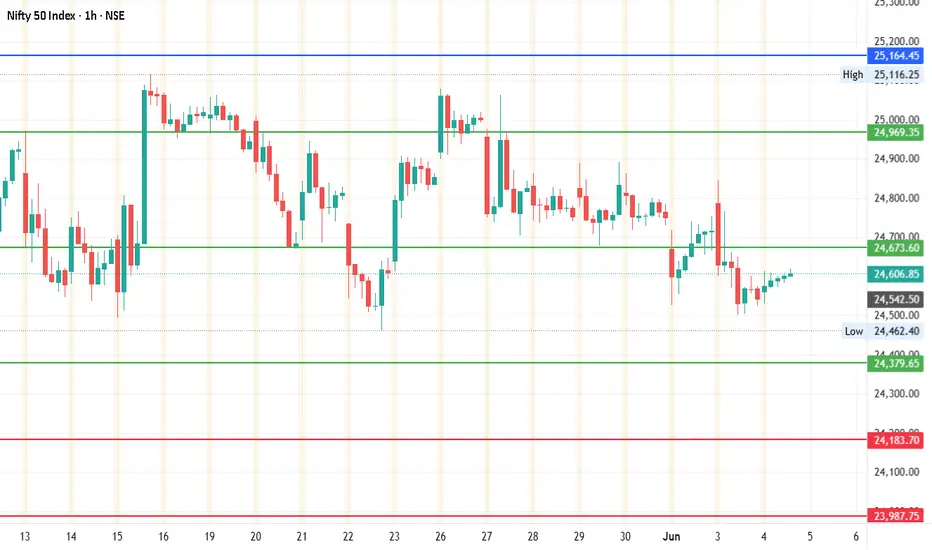
#Nifty - Short Term Pivot is 24673.63Date: 04-06-2025
Pivot Point: 24673.63 Support: 24379.64 Resistance: 24969.33
Upside Targets:
Target 1: 25164.43
Target 2: 25359.53
Target 3: 25616.74
Target 4: 25873.95
Downside Targets:
Target 1: 24183.68
Target 2: 23987.725
Target 3: 23730.5125
Target 4: 23473.30
#NiftyChartPatterns