NIFTY50.....The stage has been set!Hello Traders,
on Monday and Tuesday the NIFTY50 has reached higher price levels, up to 23869.60! This was the peak for this wave.
Since, the NIFTY50 is in a corrective mode and set a new multi-days low @ 23412.10! This could be a wave "w" of a w-x-y correction. Possibly it can morph into a triple correction!
Anyway!
If N50 escape above the level of 23649.20 on a hourly basis at minimum, the door could be open to the latest ATH @ 23869.60! In this case, chance has been given for a flat-correction.
A break of the 23462 on an hourly basis instead means, the door is open to lower price in the coming days ahead!
A possible target area is around the 23289 to 23196 levels! More bearish potential exist!
It doesn't matter what the US government will do, it doesn't matter what others do! The playbook has been written, and the stage has been set!
In which direction? Markets will give the answer.
Have a great weekend.....
Ruebennase
Please ask or comment as appropriate.
Trade on this analysis at your own risk.
NIFTY trade ideas

Nifty levels - Apr 01, 2025Nifty support and resistance levels are valuable tools for making informed trading decisions, specifically when combined with the analysis of 5-minute timeframe candlesticks and VWAP. By closely monitoring these levels and observing the price movements within this timeframe, traders can enhance the accuracy of their entry and exit points. It is important to bear in mind that support and resistance levels are not fixed, and they can change over time as market conditions evolve.
The dashed lines on the chart indicate the reaction levels, serving as additional points of significance to consider. Furthermore, take note of the response at the levels of the High, Low, and Close values from the day prior.
We hope you find this information beneficial in your trading endeavors.
* If you found the idea appealing, kindly tap the Boost icon located below the chart. We encourage you to share your thoughts and comments regarding it.
Wishing you success in your trading activities!

NIFTY--@Manipulation??Nifty index is broken the trendline strongly...
Before going to break price a strong consolidation is given with a lot of liquidity lies below it...
@22400 levels
now price is exactly at the zone of resistance.
the resistance zone is lies at 24000-24300, after a strong movement to upside price is still not given any retracement...
Case1::
I am expecting either a strong retracement towards trendline.
the retracement should be in the form of correction with slower one.
Corrective pullback::
Case2::
After the liquidity above the 24000 and 24300, price has to give some retracement..
If we buy here it will completely becomes a manipulation....
Buying above the resistance zone is also a manipulation on topside...
If price breaks the resistance zone, then will wait for a correction towards the trendline areas.
Note::
So in order to buy the breakout of trendline the stoploss placement is very large...so with large stoploss will never go for buying...
the 2 possible buying areas are
1.breakout candle at the trendline
2.after the liquidity grab below the strong consolidation zone( before breakout of trendline.)
we have manipulation on both sides....if we go for long price will make an attempt of retracement as lot of liquidity lies below.
Better to look for short above the resistance zone(topside liquidity).If no retracement now.

Nifty : price action chartNifty reverse from Weekly Support.
Now near Weekly COT level.
Daily TF gap filled yesterday.
If nifty trade near 23800-23600 and give breakout it will be perfect breakout.
this is my personal view and educational purpose only. i am not SEBI registered

#NIFTY Intraday Support and Resistance Levels - 28/03/2025Gap up opening expected in nifty. After opening if nifty starts trading and sustain above 23800 level then possible upside rally continue upto 24000+ level. 23550-23750 zone is the consolidation zone for nifty. Any major downside expected below 23450 level.

Nifty trend direction Nifty 23601 is holding on the neckline of the V top pattern. Increased call writting in the last second half session suggests market players actively resisting upward movement. As long as nifty trade below 23625 we shall expect our earlier suggested target of 23340

NIFTY might remain sideways between these levels !! As we can see NIFTY is maintaining itself between our levels and is expected to remain in this same zone until it breaks either side which confirms its upcoming trend so plan your trades accordingly and keep watching everyone.

NIFTY : Trading Levels and Plan for 28-Mar-2025📌 NIFTY Trading Plan – 28-Mar-2025
📊 Market Overview:
Nifty closed at 23,601, consolidating within a No Trade Zone after a strong uptrend. The market is at a critical juncture, and the price action at key levels will determine the next directional move.
This plan provides clear trade setups for different opening scenarios and helps you navigate market volatility with a structured approach.
🔼 Scenario 1: Gap-Up Opening (100+ points above 23,700)
A gap-up opening above 23,700 will push Nifty closer to the Last Intraday Resistance Zone (23,772). The key factor will be whether Nifty sustains above resistance or faces rejection.
✅ Plan of Action:
If Nifty sustains above 23,772, it can move towards the next resistance at 23,931. A breakout above 23,931 could trigger a rally towards 24,000+, but watch for profit booking at higher levels.
If price faces rejection at 23,772 and reverses, expect a pullback towards 23,650 → 23,600. A strong rejection here could lead to an intraday sell-off.
Avoid fresh longs inside 23,700 – 23,772, as this area may act as a profit-booking zone. Wait for confirmation before taking trades.
🎯 Pro Tip: If the gap-up is quickly filled within the first 15 minutes, it signals weak buying strength and increases the probability of an intraday correction.
⚖ Scenario 2: Flat Opening (Within ±100 points, around 23,600)
A flat opening suggests indecision among traders, and the market will likely take direction after the first few candles. The best strategy is to trade breakouts or breakdowns from key levels.
✅ Plan of Action:
Upside case: If Nifty breaks and sustains above 23,650, it may head towards 23,700 → 23,772. Observe the price action near resistance before taking fresh longs.
Downside case: If Nifty breaks below 23,520, it could test 23,450 → 23,300. A breakdown below 23,300 will turn the trend bearish.
Sideways caution: If Nifty remains inside the No Trade Zone (23,451 – 23,642), avoid taking trades as volatility could trap both buyers and sellers.
🎯 Pro Tip: In a flat opening scenario, wait for a clear 15-minute candle close above or below key levels before entering trades.
🔽 Scenario 3: Gap-Down Opening (100+ points below 23,500)
A gap-down below 23,500 could indicate profit booking or fresh selling pressure. The critical factor will be whether buyers defend key support zones.
✅ Plan of Action:
If price sustains below 23,500, expect a decline towards 23,300. A breakdown below 23,300 may accelerate selling towards the Buyer’s Support Zone (23,136 – 23,300).
If price finds support at 23,300 and rebounds, it may attempt a recovery towards 23,450 → 23,520. A strong close above 23,520 could shift momentum back to the bulls.
Be cautious of bear traps – If the market gaps down but quickly recovers, it could trigger short covering, leading to an upside reversal.
🎯 Pro Tip: If the gap-down occurs near a strong buyer’s support zone, wait for a bullish price action confirmation before entering long trades.
⚠️ Risk Management Tips for Options Traders
🔹 Avoid over-leveraging – Use proper position sizing to manage risk.
🔹 Theta Decay Awareness – If the market consolidates, option premiums will erode rapidly.
🔹 Use Spreads for Protection – Instead of naked options, use spreads to limit risk and improve probability.
🔹 Trade at Key Levels – Avoid impulsive trades; focus on defined support and resistance zones.
📌 Summary & Conclusion
📍 Key Levels to Watch:
🟥 Resistance: 23,772 → 23,931 → 24,000
🟧 No Trade Zone: 23,451 – 23,642
🟩 Support: 23,520 → 23,300 → 23,136
🔸 Bullish Bias: Above 23,772, targeting 23,931 – 24,000
🔸 Bearish Bias: Below 23,500, expecting a fall towards 23,300 – 23,136
🔸 Neutral/Choppy: Inside 23,451 – 23,642, avoid unnecessary trades
🎯 Final Advice:
Stick to the structured trading plan and execute only at key levels.
Avoid emotional trading—wait for confirmation before entering trades.
The first 15-30 minutes after market open will provide better clarity—observe price action before committing to a trade.
📢 Disclaimer
I am not a SEBI-registered analyst. This trading plan is for educational purposes only. Please conduct your own research or consult a financial advisor before making any trades.

Nifty Analysis 28.03.2025 As of March 27, 2025, the Nifty 50 index has demonstrated resilience amid recent market fluctuations. After a seven-session rally, the index experienced a slight decline on March 26 due to profit-booking and concerns over potential U.S. tariffs, closing at 23,486.85—a 0.77% drop.
REUTERS
However, it rebounded on March 27, gaining 0.49%, driven by strength in financial stocks, despite a 5.5% decline in Tata Motors shares following tariff announcements.
REUTERS
Technical analyses suggest a cautiously optimistic outlook. The Nifty 50 has formed patterns indicative of potential upward momentum, including a falling wedge and a slanted bullish flag, and has found support at the 100-week moving average. These signals point towards a possible rebound in the coming weeks.
INVEZZ
Additionally, the recent inclusion of Zomato and Jio Financial Services into the Nifty 50 is expected to bring significant passive inflows, potentially bolstering the index further.
BUSINESS NEWS TODAY
Overall, while short-term volatility persists due to external factors like international trade policies, the Nifty 50's technical indicators and strategic index adjustments suggest a potential for recovery and growth in the near term.

Nifty finds a support just above Mother line and Mid-channel.Nifty has today found a good support just above Mother line of the hourly chart and Mid-channel support zone as it bounced from lows of the day near 23412 to close at 23591. Tomorrow being the weekly closing, monthly closing and financial yearly closing it become very important or one of the most important days for investment enthusiasts. A positive closing tomorrow will empower bulls in a lot of ways.
The first support for Nifty will be at 23550. A very strong support zone for Nifty right now remains between 23412 and 23380. This zone includes today's low, mid channel support and mother line support. A closing below 23380 will bring bears back into action who can potentially drag Nifty again to 23145, 23003 or levels below 22801.
Resistance zone for Nifty remains at 23646 today's high, 23670, 23778 and 23900. A closing above 23900 will empower bulls to take Nifty to higher levels of 24046, 24169 or 24378.
As described earlier very important day tomorrow with shadow of the candle being neutral to positive.
Disclaimer:
The above information is provided for educational purpose, analysis and paper trading only. Please don't treat this as a buy or sell recommendation for the stock or index. The Techno-Funda analysis is based on data that is more than 3 months old. Supports and Resistances are determined by historic past peaks and Valley in the chart. Many other indicators and patterns like EMA, RSI, MACD, Volumes, Fibonacci, parallel channel etc. use historic data which is 3 months or older cyclical points. There is no guarantee they will work in future as markets are highly volatile and swings in prices are also due to macro and micro factors based on actions taken by the company as well as region and global events. Equity investment is subject to risks. I or my clients or family members might have positions in the stocks that we mention in our educational posts. We will not be responsible for any Profit or loss that may occur due to any financial decision taken based on any data provided in this message. Do consult your investment advisor before taking any financial decisions. Stop losses should be an important part of any investment in equity.

28 march Nifty50 important level trading zone #Nifty50
99% working trading plan
Gap up open 23623 above & 15m hold after positive trade target 23738+,
Gap up open 23623 below 15 m not break upside after nigetive trade target 23538
Gap down open 23538 above 15m hold after positive trade 23623 ,23738
Gap down open 23538 below 15 m not break upside after nigetive trade target 23460
💫big gapdown open 23460 above hold 1st positive trade view
💫big Gapup opening 23738 below nigetive trade view
📌For education purpose I'm not responsible your trade
More education following me

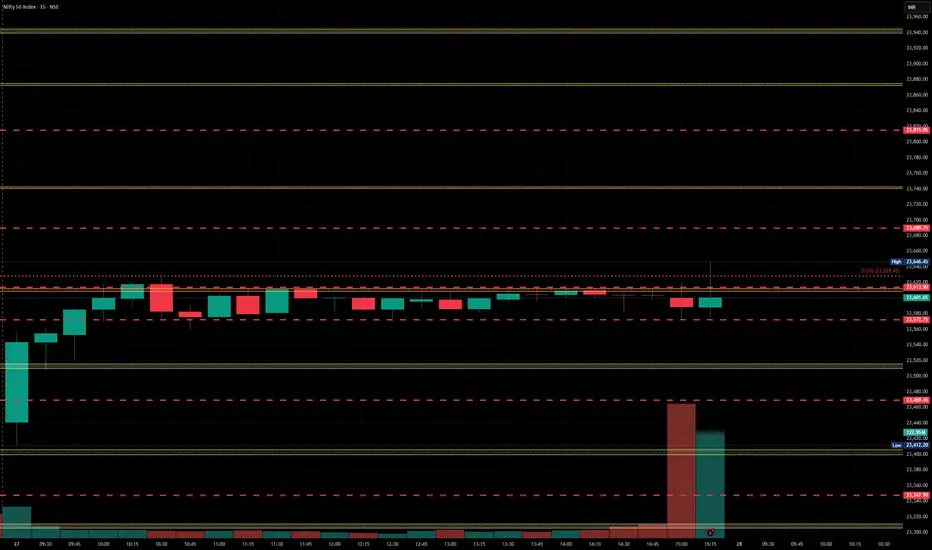
Nifty levels - Mar 28, 2025Nifty support and resistance levels are valuable tools for making informed trading decisions, specifically when combined with the analysis of 5-minute timeframe candlesticks and VWAP. By closely monitoring these levels and observing the price movements within this timeframe, traders can enhance the accuracy of their entry and exit points. It is important to bear in mind that support and resistance levels are not fixed, and they can change over time as market conditions evolve.
The dashed lines on the chart indicate the reaction levels, serving as additional points of significance to consider. Furthermore, take note of the response at the levels of the High, Low, and Close values from the day prior.
We hope you find this information beneficial in your trading endeavors.
* If you found the idea appealing, kindly tap the Boost icon located below the chart. We encourage you to share your thoughts and comments regarding it.
Wishing you success in your trading activities!
Bullish Above 23,550-23,600or Bearish drop toward 23,350-23,300. Bullish Above 23,550-23,600:
If Nifty sustains above 23,600, expect a move toward 23,700-23,750.
Look for 23,500 PE writing to confirm bullish sentiment.
Ideal strategy: Bull Call Spread (Buy 23,500 CE & Sell 23,600 CE).
Bearish Below 23,400:
If Nifty breaks below 23,400, expect a drop toward 23,350-23,300.
High OI buildup in 23,350 PE suggests downside risk.
Ideal strategy: Bear Put Spread (Buy 23,450 PE & Sell 23,350 PE).
Sideways to slightly bullish bias above 23,500.
Break below 23,400 = bearish move towards 23,350-23,300.
Wait for price confirmation before taking positions.

Nifty trend directionNifty 23548 - Has resistance at 625. Look for short opportunities around the resistance level

#NIFTY Intraday Support and Resistance Levels - 27/03/2025Flat opening expected in nifty. After opening if nifty starts trading and sustain above 23550 level then expected upside movement upto 23750+ level in today's session. Major downside expected below 23500 level. This downside rally can goes upto 23250 in today's session.

23400 could act as a SUPPORT As we can see NIFTY has been falling since last 2 days now as we expected exactly from our supply zone! We should stand by our analysis as unless and until it sustains itself above 24000 psychological level, every rise could be sold so plan your trades accordingly and keep watching.

NIFTY : Levels and Plan for 27-Mar-2025📊 Market Context:
NIFTY closed at 23,464.30, experiencing a minor pullback after a previous uptrend. The index is currently at a crucial support zone, where price action will determine the next movement.
Let’s analyze the plan for different opening scenarios and structure our trades accordingly.
🔼 Scenario 1: Gap-Up Opening (100+ points above 23,590)
A gap-up above 23,590 will place NIFTY near its Opening Resistance. This level is important because it has previously acted as a supply zone, and bulls need strong momentum to sustain above it.
✅ Plan of Action:
If price sustains above 23,590, we can expect a bullish move towards the Last Intraday Resistance at 23,660. A breakout above this level may extend gains to 23,780+.
If price gets rejected from 23,590 and starts reversing, look for a shorting opportunity, targeting 23,501 → 23,464.
Avoid aggressive long trades inside the 23,590 – 23,660 zone unless there is a clear breakout with volume.
🎯 Pro Tip: If the gap-up is weak and fills within 15 minutes, it indicates profit booking, leading to a possible retracement.
⚖ Scenario 2: Flat Opening (Within ±100 points, around 23,464)
A flat opening suggests market indecision, requiring confirmation before entering a trade.
✅ Plan of Action:
Upside case: If NIFTY breaks above 23,501, it can move towards 23,590. Observe price action at this level before deciding on further longs.
Downside case: If NIFTY breaks below 23,464, expect a decline towards the Opening Support Zone (23,501 – 23,477). A breakdown below 23,477 could trigger a deeper fall to 23,297.
Neutral Zone: If the index trades between 23,464 – 23,501, it indicates a choppy market. Avoid unnecessary trades here.
🎯 Pro Tip: A flat opening often leads to fake breakouts in the first 15 minutes. Wait for a strong candle close before entering a position.
🔽 Scenario 3: Gap-Down Opening (100+ points below 23,350)
A gap-down below 23,350 will put NIFTY near its Last Intraday Support Zone (23,297 – 23,343). If this level fails, further downside is possible.
✅ Plan of Action:
If price sustains below 23,350, expect a test of 23,297. A breakdown here could lead to heavy selling towards 23,182 – 23,100 levels.
If price rebounds from 23,297, it could trigger a pullback towards 23,464. Watch price action at 23,464 – 23,501 for signs of rejection or continuation.
Be cautious of bear traps—if price quickly reverses after a sharp gap-down, it might indicate a short-covering rally.
🎯 Pro Tip: In a gap-down scenario, avoid panic selling. Watch for reversals from key support levels before initiating fresh shorts.
⚠️ Risk Management Tips for Options Traders
🔹 Avoid over-leveraging – Keep your position sizing disciplined to minimize potential losses.
🔹 Theta Decay Awareness – If the market consolidates, option premiums will erode quickly.
🔹 Hedge Your Trades – Use spreads instead of naked options to reduce risk.
🔹 Wait for Confirmation – Enter trades only after a breakout/breakdown is retested with volume.
📌 Summary & Conclusion
📍 Key Levels to Watch:
🟥 Resistance: 23,590 → 23,660 → 23,780
🟧 No Trade Zone: 23,501 – 23,464
🟩 Support: 23,501 → 23,297 → 23,182
🔸 Bullish Bias: Above 23,590, targeting 23,660 – 23,780
🔸 Bearish Bias: Below 23,350, expecting a fall towards 23,297 – 23,182
🔸 Neutral/Sideways: If price remains between 23,501 – 23,464, avoid unnecessary trades.
🎯 Final Advice:
Stick to the plan and trade only at key levels.
Avoid trading inside No Trade Zones.
Let the market settle for 15-30 minutes before making big moves.
📢 Disclaimer
I am not a SEBI-registered analyst. This trading plan is for educational purposes only. Please conduct your research or consult a financial advisor before trading.

Trade Trade TradeHello Sarvesh here
The NIFTY 50 is an Indian stock market index that represents the float-weighted average of 50 of the largest Indian companies listed on the National Stock Exchange. Nifty 50 is owned and managed by NSE Indices, which is a wholly owned subsidiary of the National Stock Exchange of India. The Nifty 50 index was launched on 22 April 1996 with a base date of 3 November 1995 and with 1000 as its base value. [

27 March Nifty50 important level trading zone #Nifty50
99% working trading plan
Gap up open 23562 above & 15m hold after positive trade target 23720,
Gap up open 23562 below 15 m not break upside after nigetive trade target 23423,23382
Gap down open 23423 above 15m hold after positive trade target 23562, 23720
Gap down open 23423 below 15 m not break upside after nigetive trade target 23382, 23286
💫big gapdown open 23382 above hold 1st positive trade view
💫big Gapup opening 23720 below nigetive trade view
📌For education purpose I'm not responsible your trade
More education following me

Nifty Review & Analysis - DailyNifty opned at 23700 and couldn’t go higher trading in a range for most part of the morning session, then saw selling pressure and tested 23450 and closed in neagtive at 23486 down -0.7%
Price Action : - Bullish
Nifty closed Neagtive with some profit booking at highs.
Candle Pattern: - Bullish
Formed a Neagtive Bearish candle, Bearish untill recent highs taken out
Daily EMA Positioning: Bullish
10dEMA 23176
20dEMA 22980
50dEMA 23136
200dEMA 24080
EMA Trend:
Closed above 10dEma ,20dEma, 50DEMA and 200DEMA,
Daily MA suggests Buy
Hourly suggests Sell
15mins Suggests Strong Sell
The momentum indicator, RSI - Relative Strength Index is now below 70 at 65 - not Overbought
Momentum gaining towards Neutral to Positive
Support/Resistance Levels:
Major Support 23000
Immediate Support 22300-200
Immediate Resistance 22550
Major Resistance 23700, 24000
Trend:
Short Term Trend is Sideways Consolidation with Negative bias
Daily Options Activity:
Highest CE OI was at 24000 also saw OI addition at 24000. 23600, 22500 - Resistance
Highest PE OI was at 23500, saw Pe unwinding at 23000 with no major PE addition
PCR is 0.8 indicating mild Bearishness
Daily Futures Activity FII + Pro F&O Data:
FII Long/Short ratio at 33.5%/66.5% indicating addition of Longs by FIIs - Bullish
Change in Futures OI:
FII Future positions in longs & shorts remained unchanged -not Bearish
Nifty Futures price was -.7% with 2.5% Decrease in OI indicating Shorts Additions
Observation:
Niftylooked below 23700 as it couldn’t find buyers and saw selling at highs to close weak below 23500
Overall Trend:
Sentiment is Sideways cautious
Outlook for Next Session:
Nifty saw profit booking afrter 6-7 days of large upmove. Now in No trade Zone basically. Wait and watch for clear signal till 22300 or 22800 taken out
Approach & Strategy:
Wait and Watch with Long bias
My Trades & Positions:
No Positions

Nifty Coming back to test its supports.After a proper breakout and a rally which stretched above 1900 points from the March 4 lows, Nifty was clearly overbought on the hourly chart. It might be coming down for one or more of the following reasons:
1) Retesting support from where it can launch fresh move.
2) Correcting the RSI which had gone into the overbought zone.
3) Pressure due to upcoming Monthly and Financial year closing approaching on 28th March 2025.
3) The rally might have fizzled out.
4) Tax harvesting being done by retail investors.
5) Pressure due to upcoming Monthly and Financial
The first 4 options seem to be more likely of the 5 points mentioned above. FII was again on the buying side today so DII and Retail were the major selling parties.
Nifty Supports currently remain at:
1) Strong support zone of 23398 and 23309 (Hourly Mother Line support). This zone also includes the formidable mid channel support.
2) Next support is at 23145.
3) The next critical support for the rally remains at (Father line of the hourly chart) which is at 22959.
4) Final support for the rally will be at Channel bottom which is at 22801.
Nifty Resistance currently are at:
1) 23602 which is now a resistance.
2) 23749 a formidable resistance.
3) Recent rally top at 23869.
4) The zone between 24071 and 24267. (The areas that can be new channel top).
If you want to learn more about Mother, Father and the Small child theory designed by me about the stock market, Parallel Channels, charts, Candlestick analytics, Fundamental analysis, Mother and Father line importance, How to book profits, how to find a balance between Technical and fundamental analysis through Happy Candles Numbers, understand Behavioral Finance and other interesting topics by learning which you can make your money work harder you should read my book THE HAPPY CANDLES WAY TO WEALTH CREATION which is available on Amazon in paperback and kindle version. E-version of the same is available on Google Play Books too.
More volatility can be expected int the next 2 days due to ongoing Ukraine-US-Russia announcements, Financial year expiry and Trump Tarif updates. Trade with caution.
Disclaimer: The above information is provided for educational purpose, analysis and paper trading only. Please don't treat this as a buy or sell recommendation for the stock. We do not guarantee any success in highly volatile market or otherwise. Stock market investment is subject to market risks which include global and regional risks. We will not be responsible for any Profit or loss that may occur due to any financial decision taken based on any data provided in this message.

Nifty levels - Mar 27, 2025Nifty support and resistance levels are valuable tools for making informed trading decisions, specifically when combined with the analysis of 5-minute timeframe candlesticks and VWAP. By closely monitoring these levels and observing the price movements within this timeframe, traders can enhance the accuracy of their entry and exit points. It is important to bear in mind that support and resistance levels are not fixed, and they can change over time as market conditions evolve.
The dashed lines on the chart indicate the reaction levels, serving as additional points of significance to consider. Furthermore, take note of the response at the levels of the High, Low, and Close values from the day prior.
We hope you find this information beneficial in your trading endeavors.
* If you found the idea appealing, kindly tap the Boost icon located below the chart. We encourage you to share your thoughts and comments regarding it.
Wishing you success in your trading activities!

Nifty 50–1H Chart Analysis Using Volume Profile & Gann High Low1. Key Observations (Volume & Gann Focused)
a) Volume Profile Insights
POC (Recent Session): 23,338.85 – strong volume concentration suggesting a key decision level.
POC (Previous Structure): 22,478.95 – deep value zone indicating prior accumulation and demand interest.
Value Area High (VAH): Approx. 23,700 – marked rejection zone; price failed to sustain above.
Value Area Low (VAL): Near 22,800 – critical demand support zone based on historical value range.
b) Gann High-Low Signals
Gann Pivot High: 23,800 zone – aligns with current range high; failed breakout attempt signals potential reversal.
Gann Pivot Low: Around 22,400 – multiple tests show significant buyer defense, acting as strong base.
c) Liquidity Zones
Liquidity Trap Above 23,700–23,800: Fake breakout potential, possible stop-run for late buyers.
Liquidity Pool Below 22,800–22,400: Where institutions likely absorbed selling pressure during consolidation.
d) Volume-Based Swing Highs/Lows
Volume Swing High: 23,700–23,800 – top volume spike and seller reaction.
Volume Swing Low: 22,478.95 – high volume area supporting prior reversal, now key demand level.
2. Support & Resistance Levels
Support Levels (Volume-Based)
23,338.85 (Recent POC – watch for retest)
22,800 (VAL – volume support & midpoint consolidation)
22,478.95 (POC from prior zone – major demand)
Resistance Levels (Gann-Based)
23,700–23,800 (Range high + Gann pivot)
23,600 (upper channel boundary – supply zone)
3. Chart Patterns & Market Structure
a) Overall Trend Direction
Bullish to Neutral – recent sharp rally has entered a distribution phase near highs, with weakening momentum.
Potential transition into range-bound behavior or pullback toward lower POC zones.
b) Notable Structural Patterns
Rising Wedge/Channel Breakdown: Price beginning to pull back from upper channel.
Fakeout Above Range High: Failure to sustain above 23,800 confirms bearish intent.
Symmetrical Channel Forming: Indicates possible corrective move ahead.
4. Trade Setup & Risk Management
a) Bullish Setup
Entry Zone: 23,200–23,300 (POC retest + prior demand)
Target 1 (T1): 23,600 (upper consolidation zone)
Target 2 (T2): 23,800 (range high retest)
Stop Loss (SL): 23,050 (below channel midline)
Risk-Reward: ~1:2.5
Position Size: Risk 1–2% of capital
b) Bearish Setup
Entry Zone: 23,600–23,700 (supply zone + failed breakout)
Target 1 (T1): 22,800 (VAL and lower boundary)
Stop Loss (SL): 23,850 (above fakeout high)
Risk-Reward: ~1:2
Position Size: Risk 1–2% of capital
