Monday till thursday expiry rangeAs long as vix value is under 11.24 crossing pivot and going on top is not possible as per my mathematical range calculation (accuracy is 80%).
If it is near 25111 level on Thursday (and ind vix is less than 11.24) a very good time to make handsome money as market will touch 24946.27 level (probability s 80%)
For Monday we should follow buy the dip as long 24920 is intact.
Breaching 24920 market will show 24800-24781 as first target. If 30 min candle stays below this level (24780) then next tgt will be open. Will keep you posted if anything changes.
Caution: I am not SEBI registered it is my mathematical analysis and it is not buy or sell recommendation
NIFTY trade ideas

Nifty July 4th Week Analysis Nifty trend is looking unclear and closing is certainly not in favor of bulls, downside would be open upto 24700 if nifty breaches important support of 24900-830. To resume its upside momentum nifty must cross and sustain above 25150-200.
All levels are marked in the chart posted.
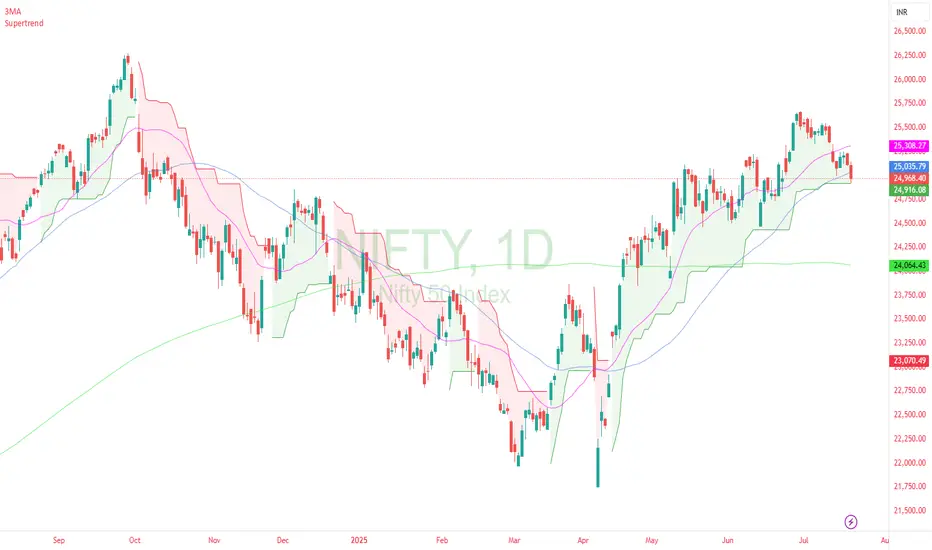
nifty dailyThis is great chart . Price is at Supertrend support on daily chart. Lowest risk in going long. Best technical chart in while .
NIFTY - NEW HIGH SOON...NSE:NIFTY Weekly chart showing negative closing from last three weeks, but undertone of the market showing something big to come on price. Rsi giving positive divergence on intraday timeframes.
nifty 50 on strong momentumgood momentum seen over nifty , also on good support minor bounce can convert in to a good reversal which can lead it to supply zone or above.
nifty support levelSupport is the level at which demand is strong enough to stop the index from falling any further
Nifty Analysis EOD – July 18, 2025 – Friday🟢 Nifty Analysis EOD – July 18, 2025 – Friday 🔴
“Deep Dive Below 25K – Bounce or Breakdown Ahead?”
As we discussed yesterday, a big move was on the cards — and Nifty delivered.
The index started flat to negative, and from the opening tick, sellers took firm control. It sharply broke through multiple key supports: PDC, PDL, S1, the important 25,080–25,060 support zone, swing low, 25,000–24,980, and even 24,965.
Buyers finally showed up near 24,920, a crucial level, and pulled off a modest 86-point recovery. The session ended at 24,968.40, still below the psychological 25,000 mark and the fractal swing low of July 14.
🕯 5 Min Time Frame Chart with Intraday Levels
🔍 Mixed Signals:
✅ Positive: Today’s low aligns with the 0.618 Fib retracement from the June 13 low to June 30 high — potential support zone.
✅ Positive: RSI(3 of 3) shows bullish divergence — early reversal sign?
❌ Negative: Closed below July 14 swing low — weak structural signal.
❌ Negative: Below 25,000 — psychological breakdown.
❓Now the big question: Will this bearish move continue, or is it a fakeout before reversal?
You're still bullish on the overall daily trend, but tactically bearish for intraday until a close above 25,125 confirms strength.
🕯 Daily Time Frame Chart For Additional View
🕯 Daily Time Frame Chart with Intraday Levels
🕯 Daily Candle Breakdown
Open: 25,108.55
High: 25,144.60
Low: 24,918.65
Close: 24,968.40
Change: −143.05 (−0.57%)
📊 Candle Structure Breakdown
Real Body: 140.15 pts → Large red bearish body
Upper Wick: 36.05 pts → rejection near early highs
Lower Wick: 49.75 pts → dip buying near 24,920
🔍 Interpretation
Mildly negative open with early strength attempt near 25,140
Sharp decline through major support zones
Buyers stepped in at 24,920, but recovery lacked follow-through
Close below 25K and key swing low confirms steady intraday selling pressure
🕯 Candle Type
Strong Bearish Candle with both wicks — sellers dominated, but not without some resistance from buyers at the lows.
📌 Key Insight
Short-term bearish momentum confirmed
24,920–24,890 is next critical support; breakdown may extend to 24,882–24,825
Bulls need to close above 25,125+ to reclaim control
🛡 5 Min Intraday Chart
⚔️ Gladiator Strategy Update
ATR: 181.56
IB Range: 126.45 → Medium IB
Market Structure: 🔴 Imbalanced
🟢 Trades Triggered:
09:42 AM – Short Trade → ✅ Trailed SL Hit Profit (R:R = 1 : 3.87)
📌 Support & Resistance Levels
Resistance Levels:
24,980 ~ 25,000
25,080 ~ 25,060
25,125
25,168
25,180 ~ 25,212
Support Levels:
24,965
24,894 ~ 24,882
24,825
24,800 ~ 24,768
💭 Final Thoughts
“Sometimes markets fall not to reverse, but to recharge.”
Today’s drop pierced major support zones, but the bounce from 0.618 Fib hints at possible resilience.
Structure needs clarity — Monday’s session will reveal whether this was a trap or fuel for bears.
✏️ Disclaimer
This is just my personal viewpoint. Always consult your financial advisor before taking any action.

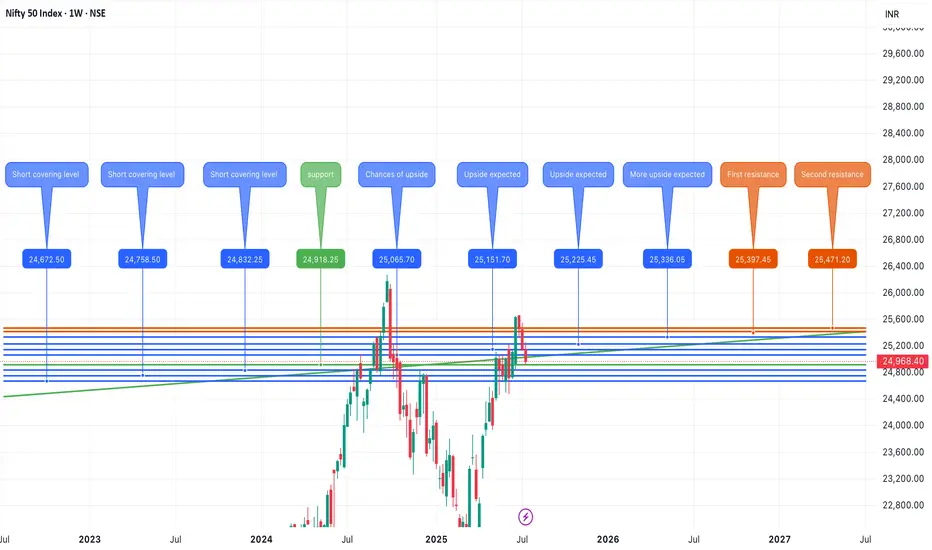
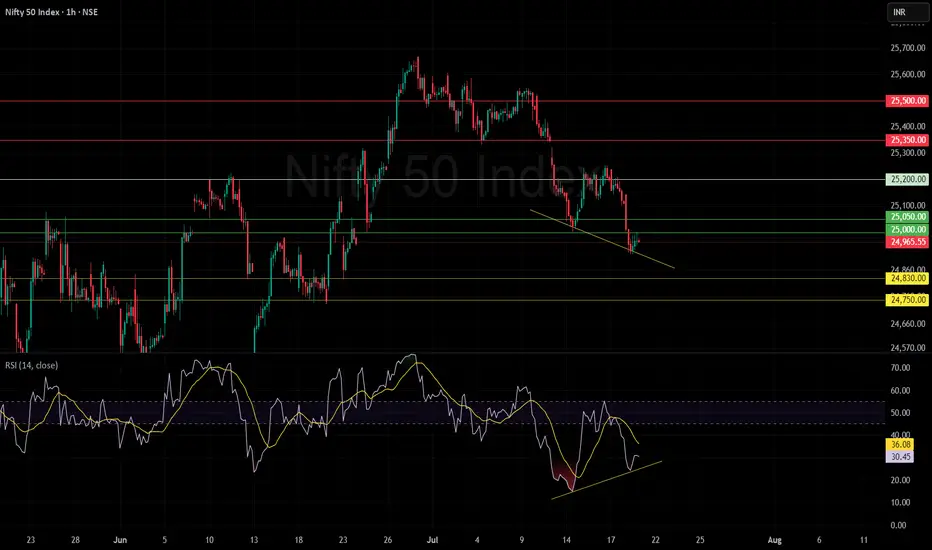
Nifty in an important/cautious zoneNIFTY 50
25,000 is the Consensus Key Level:
Most market participants are watching 25,000 as a critical psychological and technical zone. Sustaining above this keeps the market in a neutral range; a strong close above 25,200 is required for any momentum shift toward 25,350 and 25,500.
Bearish Liquidity Trap Likely:
Due to widespread focus on 25,000, a brief dip below it for 1–2 days wouldn't be surprising—this would trigger stop-losses, sweep liquidity, and potentially set up a sharp reversal if key supports like 24,830 hold.
Immediate Support and Downside Risk:
If the index sustains below 25,000, watch 24,830 first, then 24,750 and 24,500 as possible downside levels. Failure to defend these could extend the correction, but oversold RSI and positive divergence are early signals for a relief bounce.
Momentum Indicators:
RSI is near oversold (30.45) and forming bullish divergence versus price—lower lows in price but higher lows in RSI—signaling selling exhaustion and bounce potential.
Action Plan:
Stay cautious on initial dips below 25,000; this area can act as a bear trap.
Look for confirmed reversal signals (strong bullish candles, RSI upturn) especially if the price swiftly reclaims 25,000+ after liquidity grabs.
Sustained close above 25,200 = bullish setup for 25,350/25,500 targets.
Sustained trade below 24,830 signals further weakness.
Summary:
NIFTY 50 is at a make-or-break level around 25,000. Expect possible stop-loss sweeps below this area, but also be prepared for a sharp reversal if key supports and positive divergences play out. Confirmation above 25,200 flips the bias bullish; below 24,830, further slide likely
Nifty Analysis EOD – July 16, 2025 – Wednesday🟢 Nifty Analysis EOD – July 16, 2025 – Wednesday 🔴
"Bounce Back with Caution: Bulls Show Up, But Still Not in Full Control"
Nifty started the day on a flat note, but the opening candle turned out to be the day’s high, and from there, it quickly lost 91 points, marking the day’s low at 25,121 within the first hour. The early pressure gave a bearish opening tone, but bulls gradually stepped in.
Around 11:45 AM, Nifty broke above the VWAP–Day Low range, crossed the CPR zone, and then pushed toward PDH. It did make one attempt to break PDH, but failed, resulting in a slow drift downward toward VWAP and CPR into the close. The day ended at 25,212.05, nearly at CPR — a zone of indecision.
📉 The structure shows sharp reversal from the lows, but also clear hesitation near resistance zones. The session was volatile, forming a typical pre-expiry pattern with mixed sentiment. Bulls must take charge tomorrow by crossing the 25,250–25,260 zone to regain strength.
🕯 5 Min Time Frame Chart with Intraday Levels
🕯 Daily Time Frame Chart with Intraday Levels
🕯 Daily Candle Breakdown
Open: 25,196.60
High: 25,255.30
Low: 25,121.05
Close: 25,212.05
Change: +16.25 (+0.06%)
📊 Candle Structure Breakdown
Real Body: 15.45 points → small green body
Upper Wick: 43.25 points
Lower Wick: 75.55 points → significant downside recovery
🔍 Interpretation
Market opened flat, dropped quickly to test 25,120 zone
Strong buying emerged after initial fall
Buyers lifted the index above CPR, but failed to hold breakout above PDH
Candle closes with long lower wick → buyers defended dip, but lacked closing dominance
🕯 Candle TypeSpinning Top with Long Lower Wick — often a neutral to mildly bullish candle, suggesting buying interest at lower levels, but with uncertain momentum.
📌 Key Insight
Bulls clearly defended the 25,120–25,125 support zone
Momentum will only resume above 25,250–25,260, leading to targets around 25,300–25,315
Failure to hold 25,120 could reopen downside toward 25,000–25,050
🛡 5 Min Intraday Chart
⚔️ Gladiator Strategy Update
ATR: 180.99
IB Range: 91.20 → Medium IB
Market Structure: 🟡 Balanced
Trades Triggered
11:34 AM – Long Trade → ✅ Target Achieved, Trailed SL Hit (R:R 1:2.42)
📌 Support & Resistance Zones
Resistance Levels
25,168
25,180 ~ 25,212
25,260
25,295 ~ 25,315
Support Levels
25,125
25,080 ~ 25,060
25,000 ~ 24,980
24,965
💭 Final Thoughts
“Structure is forming — but conviction is lacking. Let expiry day bring clarity. Above 25,260 we fly, below 25,120 we fall.”
✏️ Disclaimer
This is just my personal viewpoint. Always consult your financial advisor before taking any action.

Technical Analysis Forecast for NIFTY50 (25,191) (UTC+4) 1:11PM
1. Candlestick Patterns
Recent Structure:
If NIFTY50 closed near 25,191 with a long upper wick (shooting star/gravestone doji), it signals rejection at higher levels → bearish reversal potential.
A bullish engulfing/marubozu candle would indicate strength → upside continuation.
Key Observation: Watch for confirmation candles. A close below 25,000 invalidates bullishness.
2. Harmonic Patterns
Potential Setups:
Bullish Bat Pattern: If 25,191 aligns with the 0.886 retracement of a prior up-move (e.g., 24,800 → 25,191), it suggests a reversal zone for longs.
Bearish Crab: If 25,191 is the 1.618 extension of a prior swing, expect resistance → pullback to 24,900-25,000.
Action: Validate with Fibonacci levels. Break above 25,250 negates bearish harmonics.
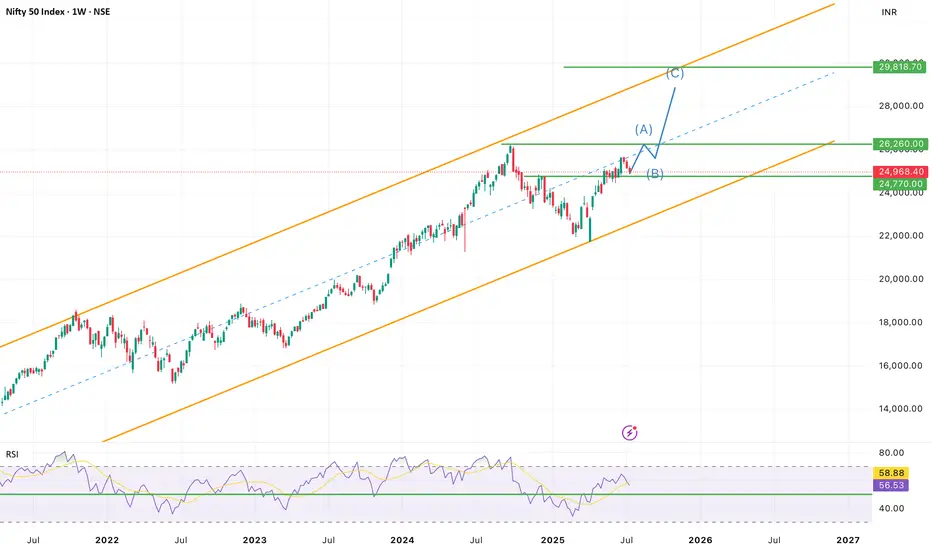
3. Elliott Wave Theory
Wave Count:
Scenario 1 (Bullish): If in Wave 3 (impulse), 25,191 could extend to 25,500 (Wave 3 = 1.618x Wave 1).
Scenario 2 (Bearish): If in Wave B (corrective), 25,191 may peak → Wave C drop to 24,600 (Wave A = Wave C).
Confirmation: A break below 24,950 supports Wave C; hold above 25,100 favors Wave 3.
4. Wyckoff Method
Phase Analysis:
Distribution?: If volume spiked at 25,191 without further upside, it suggests "upthrust" (smart money exiting) → downside to 24,700 (accumulation zone).
Re-accumulation?: If consolidating near 25,191 on low volume, expect breakout toward 25,400.
Key Sign: Watch for springs (false breakdowns) or upthrusts (false breakouts).
5. W.D. Gann Theory
Price & Time Squaring:
25,191 is near 25,200 (a Gann square number). Close above 25,200 opens 25,500 (next resistance).
Time Cycle: July 15–20 is a potential turning window (watch for reversals).
Gann Angle: Trade above 1x1 angle (e.g., 45° from June low) = bullish momentum.
6. Indicator Synthesis (RSI + BB + VWAP)
RSI (14-period):
>70: Overbought → pullback likely if diverging (e.g., price highs ↑, RSI ↓).
<50: Loss of momentum → risk of deeper correction.
Bollinger Bands (20,2):
Price near upper band → overextended → mean-reversion to middle band (25,000) possible.
"Squeeze" (narrow bands) → impending volatility breakout.
VWAP (Daily):
Price above VWAP = intraday bullish bias. A dip to VWAP (~24,950) is a buy opportunity.
Price below VWAP = bearish control → sell rallies.
Intraday/Swing Outlook
Bullish Case (Hold above 25,100):
Target: 25,400 (Elliott Wave 3 + Gann resistance).
Trigger: Bullish candle close + RSI holding 60.
Bearish Case (Break below 25,000):
Target: 24,700 (Wyckoff accumulation + BB lower band).
Trigger: Bearish harmonic confirmation + RSI divergence.
Key Levels
Type Level Significance
Support 25,000 Psychological + BB middle band
24,700 Wyckoff accumulation zone
Resistance 25,191-25,200 Current price + Gann square
25,400 Elliott Wave 3 target
Trading Strategy
Intraday:
Long if holds 25,050-25,100 with RSI >50. Stop loss: 24,950. Target: 25,250.
Short if breaks 25,000 on high volume. Stop loss: 25,150. Target: 24,800.
Swing:
Wait for daily close above 25,200 (bullish) or below 24,950 (bearish).
Hedge with options: Buy 25,200 Calls + 25,000 Puts for volatility breakout.
Conclusion
25,191 is a pivotal level. The confluence of:
Harmonic resistance + Gann square at 25,200,
RSI near overbought territory,
Price testing BB upper band,
suggests short-term consolidation/pullback is likely. However, a daily close above 25,200 ignites bullish momentum toward 25,500. Trade the breakout/breakdown with confirmation.
*Disclaimer: This analysis is time-sensitive (as of July 15, 2025). Monitor real-time volume/price action for validation.*
For those interested in further developing their trading skills based on these types of analyses, consider exploring the mentoring program offered by Shunya Trade.
I welcome your feedback on this analysis, as it will inform and enhance my future work.
Regards,
Shunya Trade
⚠️ Disclaimer: This post is educational content and does not constitute investment advice, financial advice, or trading recommendations. The views expressed here are based on technical analysis and are shared solely for informational purposes. The stock market is subject to risks, including capital loss, and readers should exercise due diligence before investing. We do not take responsibility for decisions made based on this content. Consult a certified financial advisor for personalized guidance.

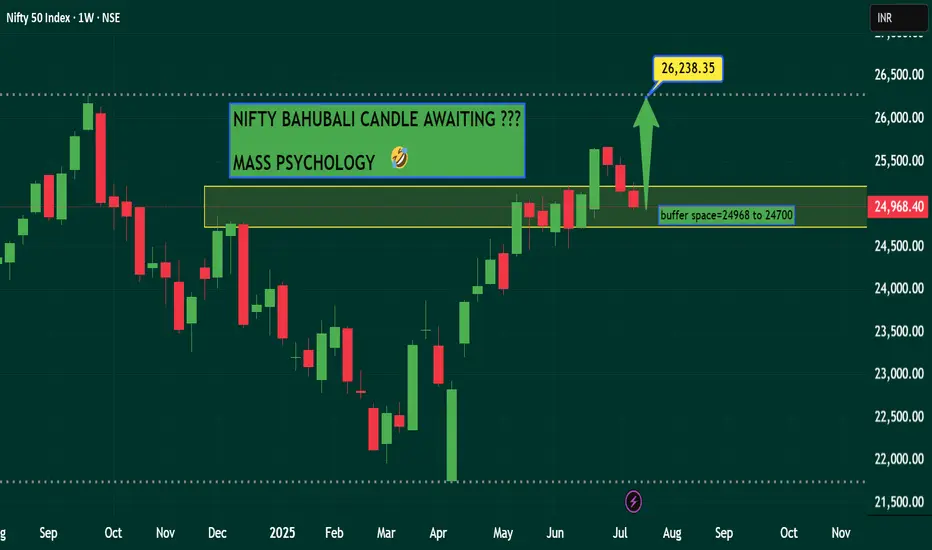
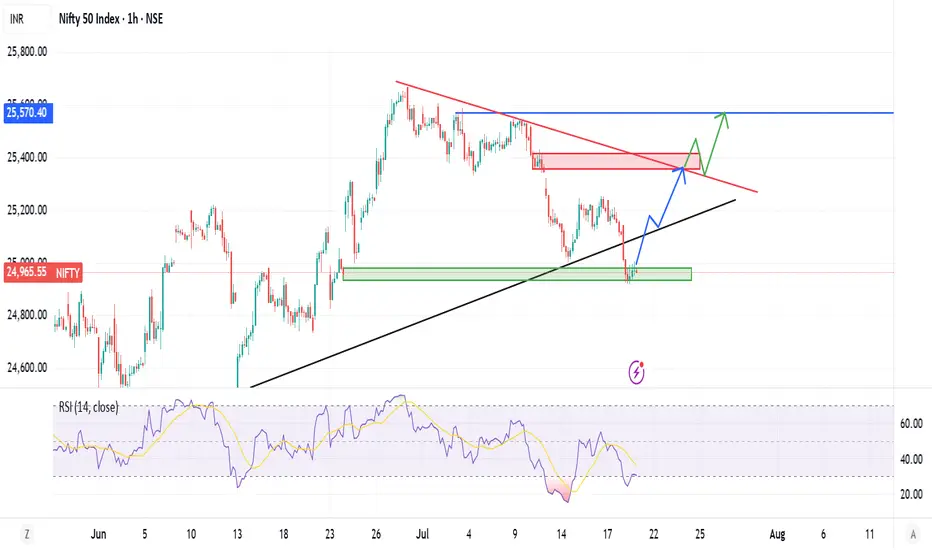
NIFTY 2HNifty is currently trading around the 25,200 level and has formed a symmetrical triangle pattern on the chart, which typically indicates a period of consolidation before a major move. This pattern reflects a balance between buyers and sellers, with price making lower highs and higher lows, gradually converging towards the apex. A breakout from this triangle, especially with strong volume, signals the potential start of a new trend. In this case, if the breakout sustains and is followed by a successful retest of the breakout zone as support, it strengthens the bullish outlook. Based on technical projections, there is a strong possibility that Nifty could rally towards the 28,000 level, marking a significant upside move from the current range. However, traders should monitor volume and price action closely to confirm the breakout's strength.
Disclaimer: The information provided is for educational and informational purposes only and should not be considered as financial advice. Investing in the stock market involves risk, and past performance is not indicative of future results. Please consult with a certified financial advisor or conduct your own research before making any investment decisions. We are not responsible for any losses incurred as a result of using this information. Stock market investments are subject to market risks; read all related documents carefully.

Nifty Analysis EOD – July 14, 2025 – Monday🟢 Nifty Analysis EOD – July 14, 2025 – Monday 🔴
"Broken Support, Fought Resistance – Tug of War in Play"
Nifty began the day with a classic Open = High (OH) setup, instantly rejecting any bullish intent. The crucial support zone of 25,080–25,060 was taken out early, and the market went on to mark the day's low at 25,001.95, a level that quickly turned into a decisive battleground.
After a bounce from the low, 25,125 emerged as a stiff resistance that pushed the index back below the broken support zone. For most of the session, the same support zone turned into resistance — a textbook polarity flip. However, in the final hour, Nifty showed resilience and finally closed back above 25,080, ending the session at 25,082.30.
🔄 The structure was full of failed intraday breakouts, signaling confusion and conflict — likely fueled by a wider CPR, imbalanced market structure, and medium IB of 109 pts. It was a low-volatility session, but packed with psychological tests.
🕯 5 Min Time Frame Chart with Intraday Levels
🕯 Daily Time Frame Chart with Intraday Levels
🕯 Daily Candle Breakdown
Open: 25,149.50
High: 25,151.10
Low: 25,001.95
Close: 25,082.30
Change: −67.55 (−0.27%)
📊 Candle Structure Breakdown
Real Body: 67.20 points – small to moderate bearish body
Upper Wick: 1.60 points – negligible upside attempt
Lower Wick: 80.35 points – strong defense from day’s low
🔍 Interpretation
Opened higher but got instantly rejected (OH formation).
Sellers took charge early but failed to hold momentum all the way.
The long lower wick reflects buyer presence at key 25,000 zone.
The close below open but above reclaimed support suggests tug of war — with bulls slightly redeeming themselves by EOD.
🕯 Candle Type
Hammer-like red candle — while bearish on close, the long lower shadow indicates potential exhaustion of selling and hints at reversal if follow-through buying emerges next session.
📌 Key Insight
25,000–25,020 has emerged as crucial near-term support.
A strong open or close above 25,150–25,180 may confirm a bullish reversal setup.
Breakdown below 25,000 opens the door for a fall toward 24,950 or lower.
🛡 5 Min Intraday Chart
⚔️ Gladiator Strategy Update
ATR: 188.77
IB Range: 109.20 → Medium IB
Market Structure: 🔴 Imbalanced
Trades Triggered
09:50 AM – Long Trade → ❌ SL Hit
01:05 PM – Short Trade → ❌ SL Hit
📉 Tough day for directional trades — false breakouts dominated.
📌 Support & Resistance Zones
Resistance Levels
25,125
25,168
25,180 ~ 25,212
25,260
25,295 ~ 25,315
Support Levels
25,080 ~ 25,060
25,000 ~ 24,980
24,965
💭 Final Thoughts
“Reclaimed ground doesn’t mean victory – yet. Watch the next move. Rejection below 25,000 ends the bulls' narrative; a strong move above 25,180 rewrites it.”
✏️ Disclaimer
This is just my personal viewpoint. Always consult your financial advisor before taking any action.

Nifty holds important support zone.Nifty Analysis:
Support and Upside Targets
Market Recap
- Opening: Nifty opened flat, showing little directional bias at the start.
- Intraday Move: The index was dragged down towards the important support zone of 25,050–25,000
- Bounce: From this support zone, Nifty rebounded and managed to close above 25,080.
Technical Outlook:
Key Support Zone
- Support Range: 25,050–25,000
Significance: This zone has acted as a strong support, with buyers stepping in to defend it.
- Implication: As long as Nifty sustains above this zone, the short-term trend remains positive.
Upside Targets
If Nifty holds above the support:
- Immediate Targets: 25,200 and 25,300 are the next levels to watch for upward momentum.
- Long-Term Targets: 25,500 and 25,700 remain the key targets if the bullish momentum continues.
Summary
- Bullish View: Sustaining above 25,000–25,050 support zone keeps the index in a positive bias.
- Bearish Risk: A decisive break below 25,000 could lead to further downside.
- Strategy: Traders may consider staying long as long as Nifty holds above the support zone, watching for the mentioned targets.
Note: Always use appropriate risk management and monitor for any changes in market sentiment or global cues that may impact index movement.


Nifty analysis as of 13/07/2025Nifty analysis as of 13/07/2025
nifty
banknifty
niftyjr
dji
nasdaq
etc etc

Learning#02 : Fractals⛰️ Learning#02 : Fractals
The Cleanest Clue on a Cluttered Chart
If you like clean charts and smart price behaviour, Fractals are one of those tools that give subtle but powerful signals. They’re not magic. They simply reflect what price is telling you—if you’re willing to listen.
Let’s unpack the concept and learn how to use Fractals like a pro.
🔍 What Is a Fractal in Trading?
In technical analysis, a Fractal is a five-candle pattern that marks a local top or bottom in price. It’s a pure price-action signal that doesn’t rely on lagging indicators.
There are two types of Fractals:
Bearish Fractal (Top): The 3rd candle has the highest high, surrounded by two lower highs on each side.
Bullish Fractal (Bottom): The 3rd candle has the lowest low, flanked by two higher lows on each side.
These formations are Price's way of saying: *"I tried to go further, but couldn't."
📊 What Do Fractals Indicate?
A shift in short-term control (bulls vs. bears)
Minor support or resistance zones
Useful markers for entries, exits, or trailing stop levels
They don't guarantee reversals but are excellent at highlighting where price momentum may pause, reverse, or build structure.
📈 How to Use Fractals – A Practical Guide
Let’s be clear: Fractals are not trade signals by themselves.
Instead, they work best when used in confluence with your strategy. Think of them as tools that:
Help confirm breakout levels
Refine pullback entries
Guide you in drawing cleaner trendlines, fib zones, and support/resistance levels
Assist in identifying swing highs and lows for Dow Theory-style trend analysis
🔗 Fractals + Strategy = Smart Trading
Whether you trade breakouts or mean reversion, Fractals help clarify:
Which highs or lows matter
Where to place stop losses with structure-based logic
How to trail SL as the trade progresses
They quietly organize your chart into readable, tradeable levels.
🚀 Practical Uses of Fractals
Fractals are the first tool I add to any chart—they instantly reveal structure and guide every step of my analysis.
1. Breakout Confirmation
Wait for a candle to close above a bullish fractal high or below a bearish fractal low.
Useful when the market is trending or forming structures like double bottoms/tops.
2. Pullback with Confirmation
Use the fractal zone as a short-term S/R level. If price returns and shows signs of rejection (like an inside bar, wick rejections, or low volume), consider entries based on confirmation.
Great in sideways or swing environments.
3. Trend Structure Validation
Fractals reveal clear pivot highs/lows, helping:
Confirm higher highs/higher lows
Mark structure for trendline drawing
Validate Fib levels or S/R zones
4. Trailing Stop Loss
Update your SL to trail behind the most recent opposite-side fractals.
In longs: SL below new bullish fractals
In shorts: SL above new bearish fractals
This lets you stay in the move while managing risk like a pro.
How it’s Look Like on Chart
snapshot
⚠️ Common Mistakes to Avoid
Trading every fractal blindly
Ignoring price context or trend
Relying on fractals in low-volume, choppy markets
📝 Final Thoughts
Fractals are like breadcrumbs left by price action. They quietly point to areas where the market faced resistance or found support. Alone, they’re not enough. But in the hands of a price-action trader, they’re incredibly useful.
Used alongside market structure, confirmation signals, and clean charting habits, Fractals become:
Trend identifiers
Entry enhancers
Stop loss trail markers
⭐ Bonus Tip
Next time you mark a level, Fibonacci or draw a trendline, check if a Fractal confirms it. You’ll be surprised how often it does.
Trade simple. Trade clean.
— Kiran Zatakia

Nifty Analysis EOD – July 11, 2025 – Friday🟢 Nifty Analysis EOD – July 11, 2025 – Friday 🔴
"Smooth Slide, Silent Pressure – Bulls on the Edge"
Nifty opened with a 60-point gap-down, and despite an initial attempt to fill the gap with a 40-point bounce, the index couldn’t sustain. What followed was classic, smooth selling pressure — a slow bleed marked by 16 consecutive 5-minute candles that never broke the previous candle’s high.
There was no panic, just a persistent drift downward. The day’s structure was a silent yet firm rejection from higher levels, with 25,150 acting as an anchor for most of the session, eventually closing near 25,140.
📉 This session marks a revisit to the breakout zone of June 26–27.
Is this a false breakout or a healthy retest?
Only time — and a bounce or breakdown from 25,080–25,060 — will tell.
⚠️ If we close below 25,000, the entire bullish move from late June might be invalidated.
But a sharp bounce from the 25080–25060 zone could spark a hopeful reversal setup.
🕯 5 Min Time Frame Chart with Intraday Levels
🕯 Daily Time Frame Chart with Intraday Levels
🕯 Daily Candle Breakdown
Open: 25,255.50
High: 25,322.45
Low: 25,129.00
Close: 25,149.85
Change: −205.40 (−0.81%)
📊 Candle Structure Breakdown
Real Body: 105.65 points – clean bearish body
Upper Wick: 66.95 points – buyers rejected
Lower Wick: 20.85 points – weak defense at bottom
🔍 Interpretation
Price opened weak and stayed weak.
An intraday push to 25,320 was sharply sold into.
Closing near the day’s low shows full bear control.
Minimal bounce from day low indicates lack of bullish confidence.
🕯 Candle Type
A Bearish Rejection Candle – resembles an inverted hammer in a downtrend; suggests sellers still strong and bulls hesitant
📌 Key Insight
The zone of 25,320–25,350 has turned into firm intraday resistance.
25,100–25,130 is the immediate make-or-break support — below that lies 25,000–25,050.
For bulls to breathe again, we need a bounce and hold above 25,250–25,300.
🛡 5 Min Intraday Chart
⚔️ Gladiator Strategy Update
ATR: 193.17
IB Range: 78.45 → Medium IB
Market Structure: 🔴 Imbalanced
Trades Triggered
10:21 AM – Short Trade → 🎯 Trailing SL Hit (R:R 1:2.41)
📌 Support & Resistance Zones
Resistance Levels
25,168
25,180 ~ 25,212
25,260
25,295 ~ 25,315
Support Levels
25,125
25,080 ~ 25,060
25,000 ~ 24,980
24,965
💭 Final Thoughts
"It wasn’t a crash, it was a quiet rejection — and that makes it more dangerous. If bulls don’t show up now, bears might get bolder from here."
✏️ Disclaimer
This is just my personal viewpoint. Always consult your financial advisor before taking any action.

Nifty July 3rd Week Analysis Nifty is looking uncertain at the moment , and we can expect a highly volatile week ahead for Nifty. Upside momentum can be trusted only if Nifty crosses and sustains above 25320, and it can continue upside momentum upto 25600-650. On the downside, if Nifty breaches 25050-24950, then we can expect a downtrend upto levels of 24750-650.
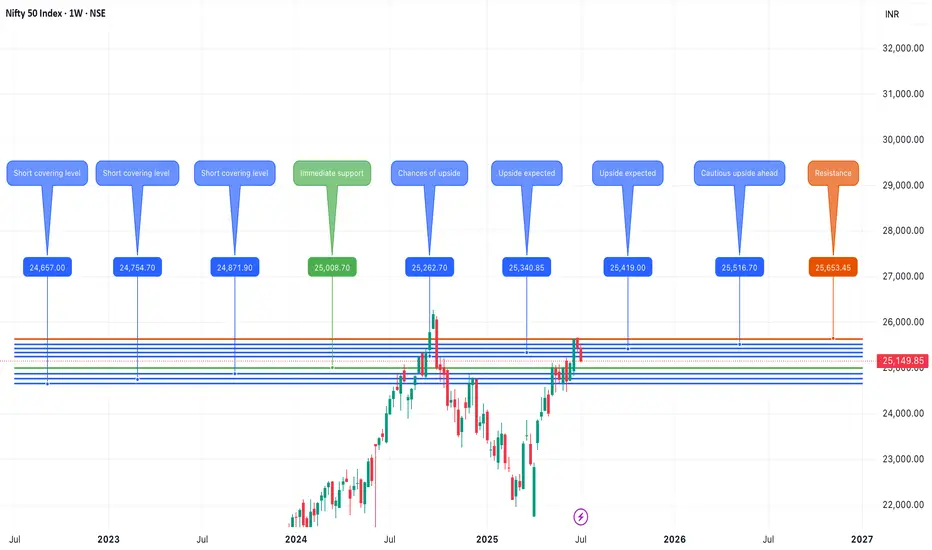
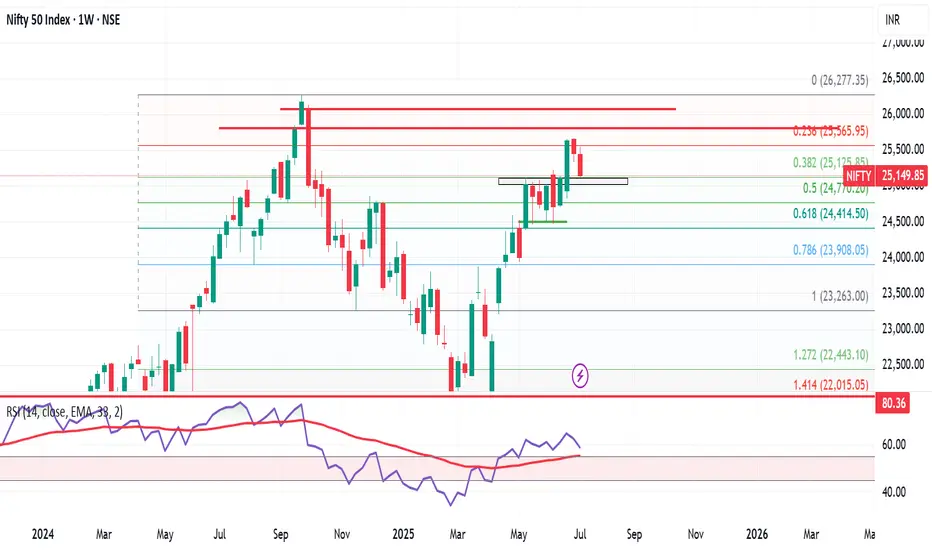
Nifty at Make-or-Break Zone: What to Expect Next Week Markets eMarkets ended the week under pressure, with the Nifty 50 closing at 25,149, down 312 points from the previous week. The index traded within a tight band, hitting a high of 25,548 and a low of 25,129 — perfectly respecting the 25,900–25,000 range mentioned in last week’s analysis.
Now, Nifty finds itself at a crucial support level near 25,000. A rebound from this zone could trigger a short-term rally towards 25,500–25,600, which will act as immediate resistance. However, traders should proceed with caution, as the monthly chart remains neutral to bearish, indicating that this could just be a temporary bounce rather than a sustained uptrend.
Looking ahead, expect Nifty to trade within a range of 24,700 to 25,600. A breakdown below 24,700 could open the gates for deeper cuts, while a breakout above 25,600 needs to be backed by strong volume and participation to confirm a trend reversal.
Sector Watch: Reliance Shines Amidst Caution
Among the large caps, Reliance Industries stands out as the only stock showing strength on the monthly chart, while other heavyweights and key sectors continue to lack momentum. This narrow leadership is a red flag for broader market sustainability.
Global Markets: S&P 500 at a Crossroads
Globally, the S&P 500 closed at 6,259, down slightly from last week. What’s more important is the formation of a Doji candle — a classic sign of indecision. A move above 6,300 could lead to upside targets of 6,376 / 6,454 / 6,500, which would likely boost sentiment in global and Indian equities.
However, if the index slips below 6,150, it would mark a failed breakout, potentially triggering a global correction — a risk that Indian markets can't ignore.
Final Word
We’re at a critical juncture. While technicals suggest a potential bounce in Nifty from 25,000, the lack of confirmation on higher timeframes and uncertain global cues call for prudence over aggression.
👉 I’ll be staying out of the market this week. The setup doesn’t offer a favorable risk-reward, and in trading, patience is often the best position.
Let the charts speak. We’ll act accordingly.
Nifty has broken Hoz support, Trendline & Rising Triangle.Nifty has broken Hoz support, Trendline & Rising Triangle. It may consolidate at this level.

NIFTY S/R for 14/7/25Support and Resistance Levels:
Support Levels: These are price points (green line/shade) where a downward trend may be halted due to a concentration of buying interest. Imagine them as a safety net where buyers step in, preventing further decline.
Resistance Levels: Conversely, resistance levels (red line/shade) are where upward trends might stall due to increased selling interest. They act like a ceiling where sellers come in to push prices down.
Breakouts:
Bullish Breakout: When the price moves above resistance, it often indicates strong buying interest and the potential for a continued uptrend. Traders may view this as a signal to buy or hold.
Bearish Breakout: When the price falls below support, it can signal strong selling interest and the potential for a continued downtrend. Traders might see this as a cue to sell or avoid buying.
MA Ribbon (EMA 20, EMA 50, EMA 100, EMA 200) :
Above EMA: If the stock price is above the EMA, it suggests a potential uptrend or bullish momentum.
Below EMA: If the stock price is below the EMA, it indicates a potential downtrend or bearish momentum.
Trendline: A trendline is a straight line drawn on a chart to represent the general direction of a data point set.
Uptrend Line: Drawn by connecting the lows in an upward trend. Indicates that the price is moving higher over time. Acts as a support level, where prices tend to bounce upward.
Downtrend Line: Drawn by connecting the highs in a downward trend. Indicates that the price is moving lower over time. It acts as a resistance level, where prices tend to drop.
Disclaimer:
I am not a SEBI registered. The information provided here is for learning purposes only and should not be interpreted as financial advice. Consider the broader market context and consult with a qualified financial advisor before making investment decisions.

Institutional Trading Process 1. Investment Idea Generation
This is where it all begins.
Institutions generate trading ideas based on:
Fundamental research (company earnings, macroeconomic data)
Quantitative models (statistical or algorithmic strategies)
Technical analysis (price action, trends, volume)
Sentiment analysis (news flow, social media, market psychology)
Often, the research team, quant team, or portfolio managers work together to develop high-conviction trade ideas backed by data and analysis.
2. Pre-Trade Analysis and Risk Assessment
Before placing a trade, institutions perform:
Risk/reward analysis
Scenario testing (How does the trade perform in different market conditions?)
Volatility analysis
Position sizing based on portfolio risk budget

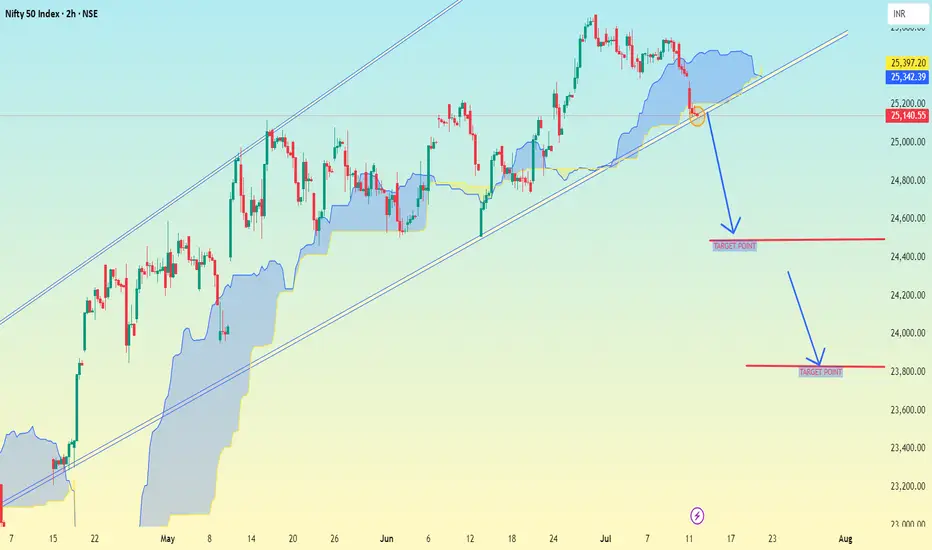
Nifty 50 Index (2h time frame)Nifty 50 Index (2h time frame), here is the analysis and potential target levels:
🔍 Technical Breakdown:
Trendline Break: The chart shows a rising trendline which has been broken to the downside.
Ichimoku Cloud: Price has moved below the cloud, indicating bearish momentum.
Arrows & Levels: Two downward arrows suggest potential drop zones.
🎯 Target Levels (as marked on chart):
1. First Target Zone:
📍 Around 24,400
Likely first support zone / take-profit level after breakdown.
2. Second Target Zone:
📍 Around 23,800
Deeper correction zone based on prior support and structure.
✅ Summary:
If the breakdown sustains below the trendline and cloud:
Immediate target: 24,400
Extended target: 23,800
Let me know if you want stop-loss ideas or a risk/reward plan for this trade.