NIFTY trade ideas


Nifty 50 Maybe Face RejectionCurrently, Nifty 50 appears to be experiencing rejection on its chart. An upside movement should be anticipated only if Nifty 50 remains above this observed level. Conversely, it would be advisable to avoid purchasing options premiums, as they are likely to depreciate if the market consolidates within its current range.

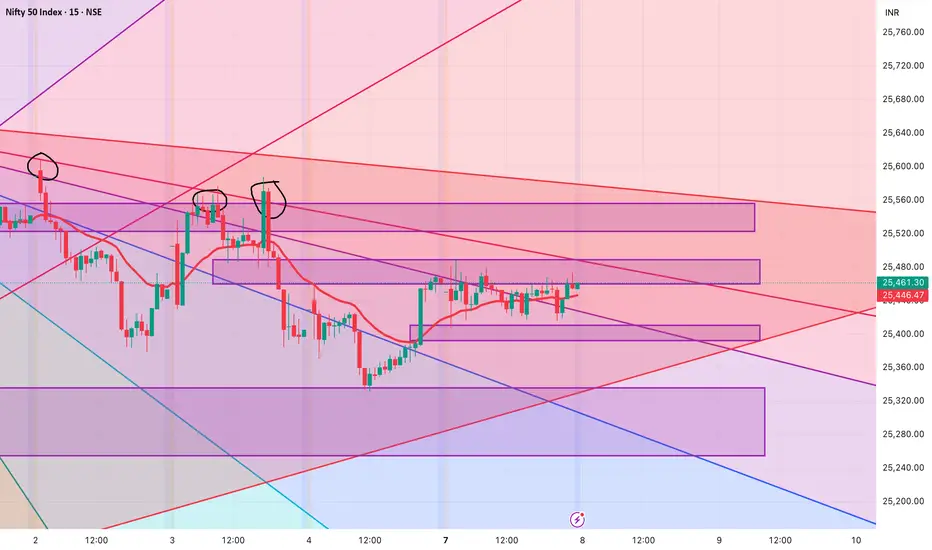
NIFTY AND BANK NIFTY OVERVIEWBoth the NIFTY 50 and BANK NIFTY indices are currently displaying major Order Block formations on the 15-minute timeframe. These institutional-level support and resistance zones indicate potential areas where significant buying or selling pressure may emerge.

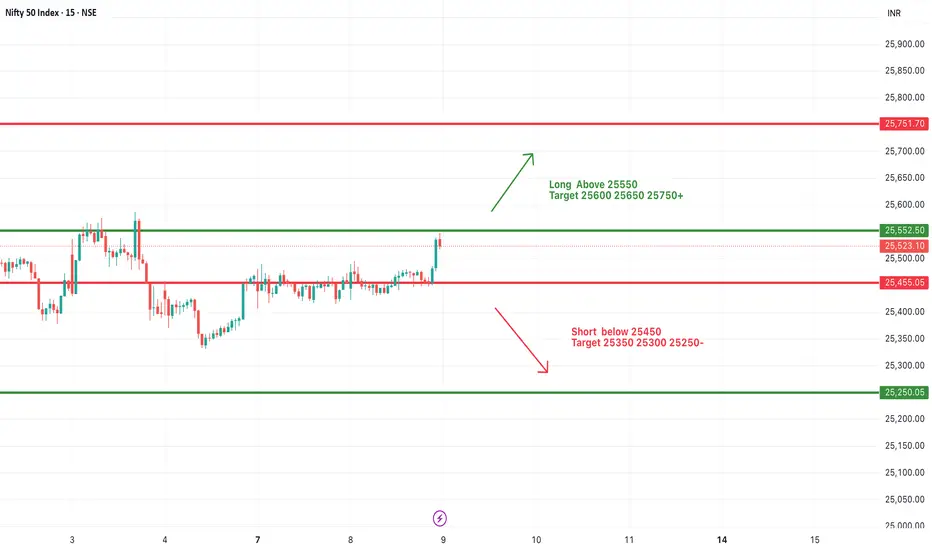
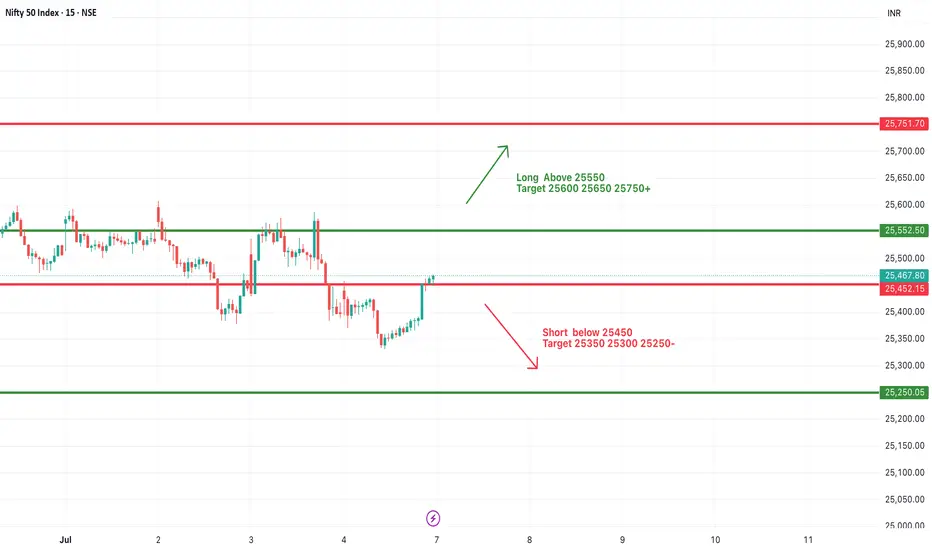
#NIFTY Intraday Support and Resistance Levels - 09/07/2025Nifty is expected to open slightly gap up around the 25500–25520 zone, showing positive momentum from the previous day’s breakout above its recent consolidation range. If the index sustains above the 25550 level, we can expect bullish continuation toward the upside targets of 25600, 25650, and 25750+ levels. This zone may act as an intraday breakout trigger.
On the downside, 25450 will now act as immediate support. Any sharp move below 25450 could invite selling pressure, and we may see a downside slide toward 25350, 25300, and 25250-. The trend remains mildly bullish above 25550, while below 25450 the trend may turn weak intraday.
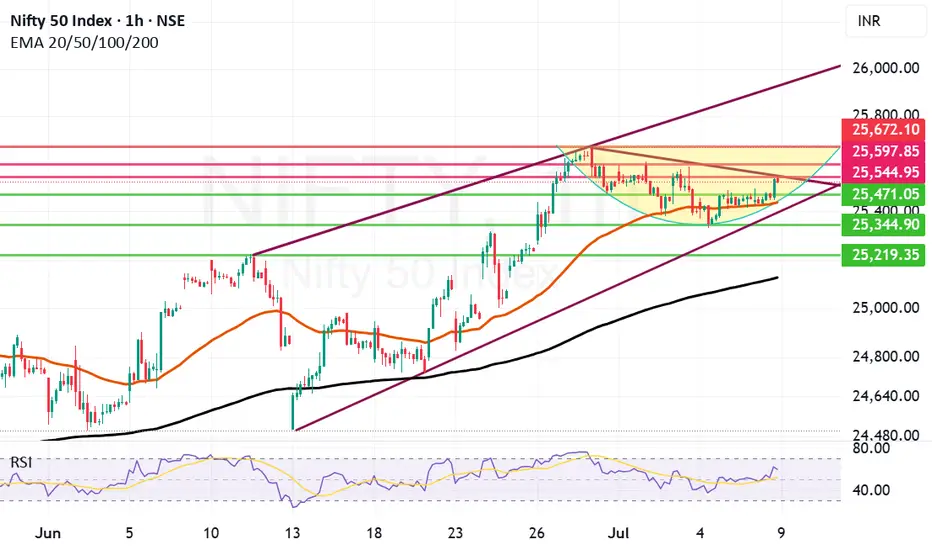
Closing above 25544 should be first step for Nifty to break freeNifty today closed in positive but still it might not be free enough to crate further bull run. the first step that Nifty needs to take to get out of this range bound trade zone or consolidation is to get a closing above 25544.
Further to this step it my find resistances at 25597, 25672. Once we close above 25672 the possibility that Bulls can regaining 26K levels and go even higher becomes stronger.
The Supports for Nifty currently remain at 25471, 25437 which is Mother line or 50 Hours EMA, 25344, 25219 and finally 25125. 25125 is the Father line support or 200 hours EMA. Closing below 25215 will empower Bears to drag Nifty further down wards.
Disclaimer: The above information is provided for educational purpose, analysis and paper trading only. Please don't treat this as a buy or sell recommendation for the stock or index. The Techno-Funda analysis is based on data that is more than 3 months old. Supports and Resistances are determined by historic past peaks and Valley in the chart. Many other indicators and patterns like EMA, RSI, MACD, Volumes, Fibonacci, parallel channel etc. use historic data which is 3 months or older cyclical points. There is no guarantee they will work in future as markets are highly volatile and swings in prices are also due to macro and micro factors based on actions taken by the company as well as region and global events. Equity investment is subject to risks. I or my clients or family members might have positions in the stocks that we mention in our educational posts. We will not be responsible for any Profit or loss that may occur due to any financial decision taken based on any data provided in this message. Do consult your investment advisor before taking any financial decisions. Stop losses should be an important part of any investment in equity.
Levels for Nifty tomorrow - 08 July 2025
Please watch out for levels in Nifty for 08 July 2025
1. Long after 25490 for target of 25522 -25555.
2. Short after 25390 for target of 25337 and if this is broken with volume we can look for 25253.
3. 25490-25392 are the no trade/ sideways zone
Also we have see the rejection from the trendline above, so kindly watchout incase of gap-up
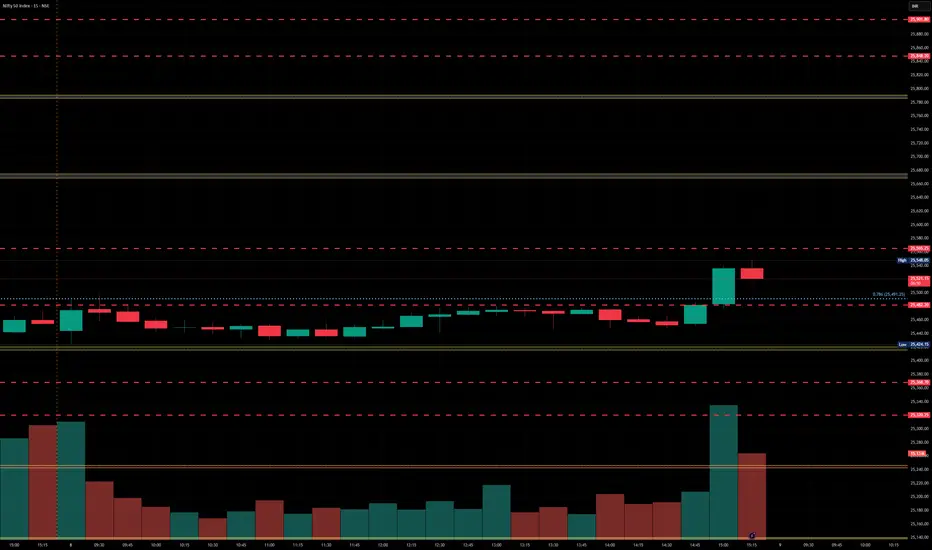
Nifty levels - Jul 09, 2025Nifty support and resistance levels are valuable tools for making informed trading decisions, specifically when combined with the analysis of 5-minute timeframe candlesticks and VWAP. By closely monitoring these levels and observing the price movements within this timeframe, traders can enhance the accuracy of their entry and exit points. It is important to bear in mind that support and resistance levels are not fixed, and they can change over time as market conditions evolve.
The dashed lines on the chart indicate the reaction levels, serving as additional points of significance to consider. Furthermore, take note of the response at the levels of the High, Low, and Close values from the day prior.
We hope you find this information beneficial in your trading endeavors.
* If you found the idea appealing, kindly tap the Boost icon located below the chart. We encourage you to share your thoughts and comments regarding it.
Wishing you success in your trading activities!
#Nifty directions and levels for July 8th:Good morning, Friends! 🌞
Here are the market directions and levels for July 8th:
Market Overview
The global markets have a moderately bullish sentiment, while our local markets are showing a moderately bearish sentiment. Gift Nifty is indicating a neutral to slightly negative start of around 10 points today.
So, what can we expect today?
Last evening, the Dow Jones fell more than 1%, but Gift Nifty didn’t reflect that. However, our markets continued to trade within a range, maintaining a moderately bearish bias. So, there’s nothing new; we can follow the same sentiment we saw in the previous session.
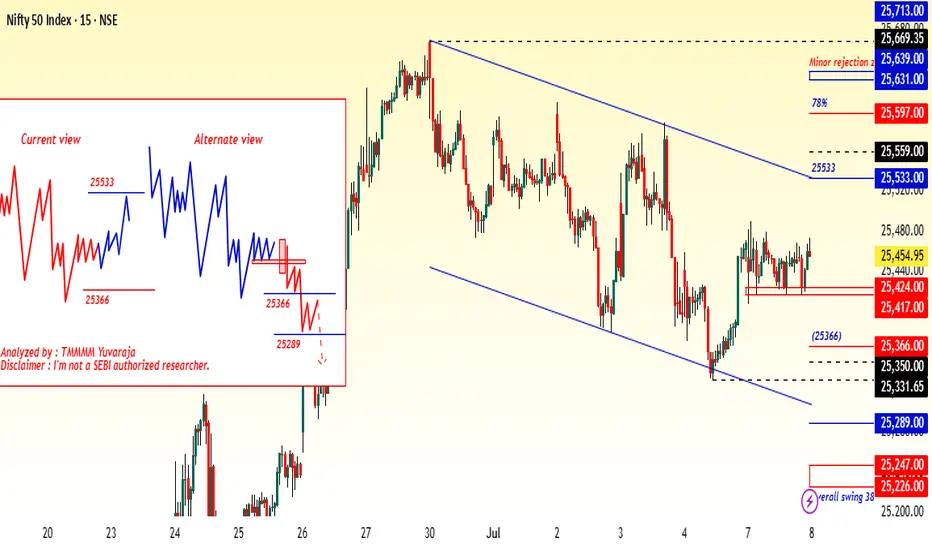
This means if the market pulls back initially, we may see a minor pullback followed by some consolidation. This is my first variation (current view).
On the other hand, if the decline shows a solid structure and breaks the immediate support level, we can expect the correction to continue. If that happens, it could mark the beginning of a C wave or 3rd wave of the correction. This is my alternate view.
#NIFTY Intraday Support and Resistance Levels - 08/07/2025Nifty is expected to open flat with no major change in the overall levels compared to the previous session. The index continues to hover near a crucial resistance zone around 25450–25500. A breakout above 25550 will indicate bullish strength and may lead to an upward move toward 25600, 25650, and even 25750+. This zone has been tested multiple times, and a decisive break can attract further buying.
On the downside, the support remains at 25450. A break below this level can invite selling pressure, with immediate targets at 25350, 25300, and 25250-. The market is clearly respecting this consolidation band, so any directional move will depend on a confirmed breakout or breakdown from these levels.
Traders should remain cautious and avoid early entries unless a clean move is seen beyond the 25550 or below the 25450 levels.

NIFTY 50 CHART ANALYSIS INTRADAYHere I give you a chart analysis on Nifty 50 for 8th July 2025. intraday trend is neutral and
mid trend is Berish but price to shifted to bullish trend. let's see what will happen in upcoming days.

Nifty levels - Jul 08. 2025Nifty support and resistance levels are valuable tools for making informed trading decisions, specifically when combined with the analysis of 5-minute timeframe candlesticks and VWAP. By closely monitoring these levels and observing the price movements within this timeframe, traders can enhance the accuracy of their entry and exit points. It is important to bear in mind that support and resistance levels are not fixed, and they can change over time as market conditions evolve.
The dashed lines on the chart indicate the reaction levels, serving as additional points of significance to consider. Furthermore, take note of the response at the levels of the High, Low, and Close values from the day prior.
We hope you find this information beneficial in your trading endeavors.
* If you found the idea appealing, kindly tap the Boost icon located below the chart. We encourage you to share your thoughts and comments regarding it.
Wishing you success in your trading activities!


#Nifty directions and levels for July 7th:"Good morning, Friends! 🌞
Here are the market directions and levels for July 7th:
Market Overview
Global markets have a bullish sentiment, while our local markets are showing a moderately bearish sentiment. Gift Nifty is indicating a negative start of around 30 points today.
So, what can we expect today?
The higher degrees are showing bullish sentiment; however, the lower degree is showing moderately bearish sentiment. However, both Nifty and Bank Nifty were closed in the mid-range of the swing. Therefore, until breaking either to the upside or downside of the range, we cannot get any clear direction. If it breaks, we can follow that direction.
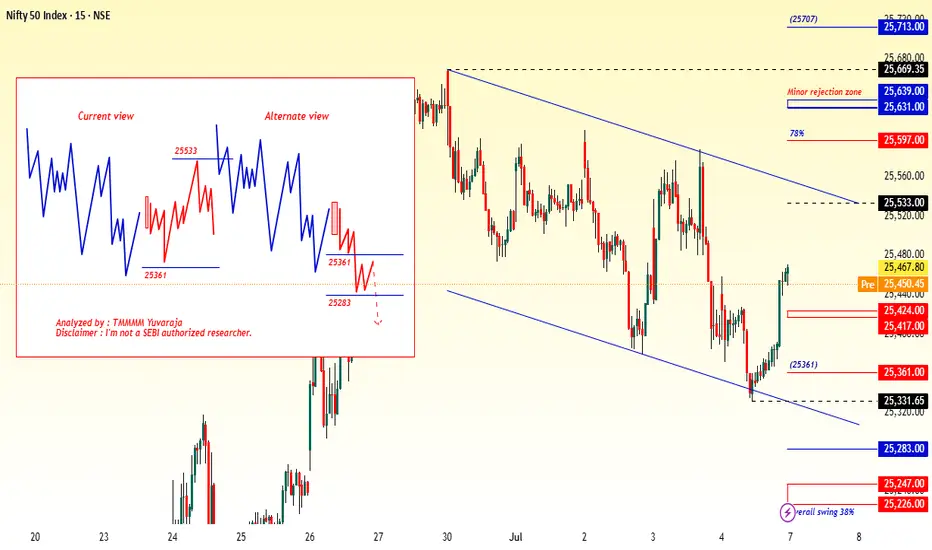
My expectation is that, as per the wave theory, the pullback is a three-wave structure, so I'm expecting some consolidation within the range. This is my first variation (current view). On the other hand, if the decline has a solid structure and breaks the immediate support level, we can expect correction continuation. If this happens, then it could be a C or 3rd wave of the correction. This is my alternate view."
#NIFTY Intraday Support and Resistance Levels - 07/07/2025Nifty is expected to open flat near the 25450–25500 zone, which lies close to an important decision area. If Nifty manages to sustain above the 25550 level, we can expect bullish momentum to resume with upside targets of 25600, 25650, and possibly 25750+. This level marks a potential breakout zone, and holding above it could bring back buyers’ interest.
On the downside, a breakdown below 25450 may trigger fresh selling pressure, leading to downside targets of 25350, 25300, and 25250. The 25450 level has acted as both a support and resistance in recent sessions, making it a key pivot point for intraday direction.
Traders should be patient and wait for a clear breakout or breakdown above or below these levels. Volatility may be witnessed around the opening range, so it's advisable to trade with strict stop losses and manage risk through partial profit booking near targets.
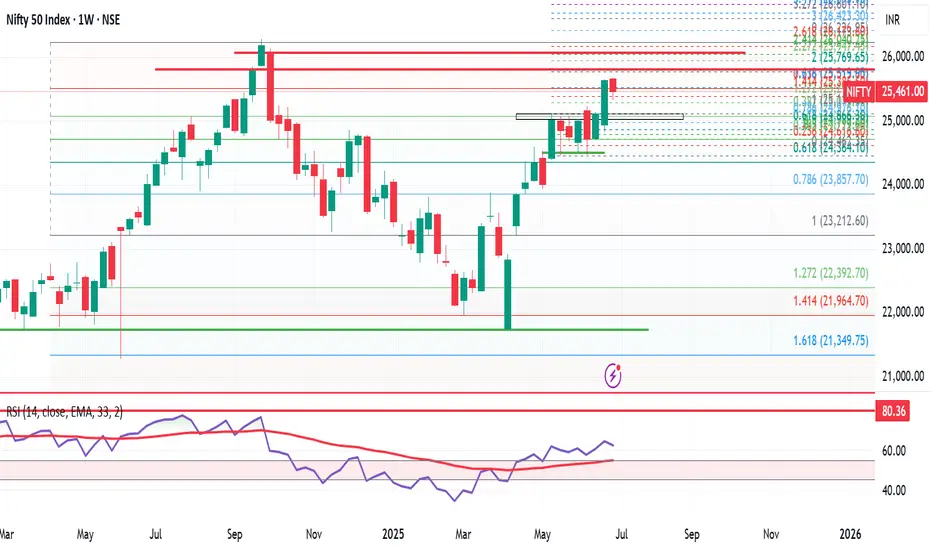
Nifty Wkly Update: Market Cools Off,But Bulls May Regain ControlNifty closed the week at 25,461, down 176 points from last week's close. It touched a high of 25,669 and a low of 25,331—a clear sign of consolidation and short-term correction.
As I highlighted last week, it was a smart move to book partial profits or trail your stops, especially after the strong upmove. And here we are—a healthy pullback, exactly what we anticipated.
But things are about to get interesting...
Reliance, the heavyweight of Nifty, is turning bullish on the monthly chart—a strong signal for potential upside. As long as Reliance remains bullish, it's wise to focus on bullish opportunities only.
Nifty Outlook for Next Week:
Expected Range: 25,000 – 25,900
Strategy: Buy on dips while Reliance stays strong.
Sentiment: Cautiously bullish
Global Cue: S&P 500 Hits All-Time High!
The S&P 500 closed at a record 6,279, up nearly 100 points from last week. If it breaks above 6,284, we could see a rally toward:
6,376
6,454
6,500
6,568 (key level to watch)
However, a break below 6,177 could pull it back to 6,050/6,040.
My take: S&P 500 is in beast mode, and as it climbs, it’s likely to drag Nifty higher too. The broader market is turning bullish—momentum is shifting in favor of the bulls.
Final Thought:
Bulls are loading their guns, and bears might want to take a nap for the next 10–15 days. The trend is your friend—for now, let the bulls enjoy the ride!
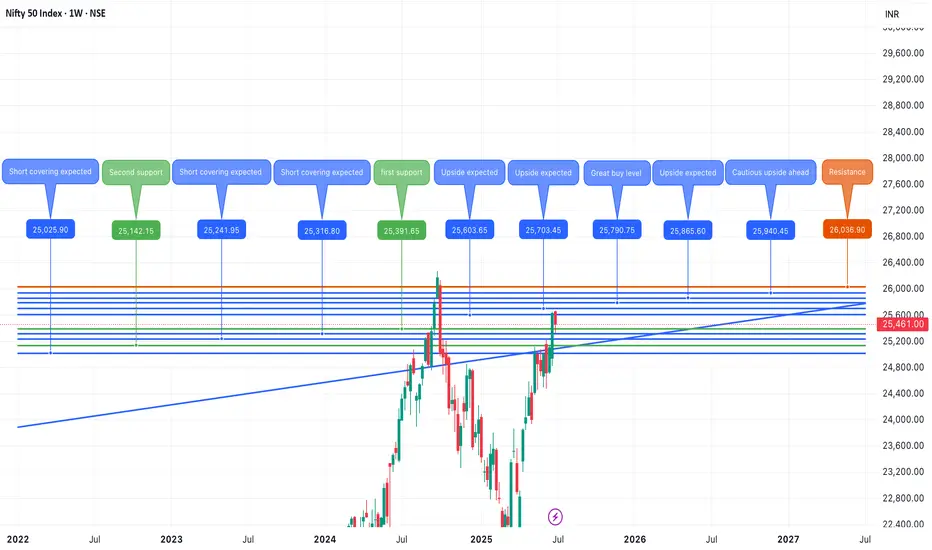
Nifty July 2nd Week AnalysisNifty is looking positive for the upcoming week , and we can expect levels upto 26000 on nifty in the upcoming week . Imp range to watch for upside is 25650-750 .Until then call writers can hamper intraday upside moves. Bulls need to remain cautious of sell on rise until nifty crosses and sustains above 25650-700 range. On the downside imp support zone are 25300-150.
Nifty IT AND RELIANCE WILL BE KEY HIGHLIGHT FOR THE UPSIDE OF NIFTY THIS WEEK.
ALL LEVELS ARE MARKED IN THE CHART POSTED
$NSE:NIFTY is Going to Burst Up Side ! SkyRocketing TIme is NearNSE:NIFTY is Going to Burst Up Side ! SkyRocketing TIme is Near
NIFTY 50 BULLISH REVIEW (My View) 💥
📈 Current Bias: BULLISH
✅ Nifty 50 showing strong resilience above key support levels.
✅ The index is holding well above recent consolidation zones and looks ready for further upside.
✅ Momentum indicators (like RSI) are staying in positive territory, showing sustained strength.
✅ Higher highs & higher lows structure intact on daily chart — bulls in control!
🔑 Key Levels:
👉 Immediate support: 23,333 - (watch for buying interest here)
👉 Resistance ahead: 23,850 - 23,900 (break above = fresh rally potential)
🌟 What I’m Watching:
🚀 Breakout above 23,900 could open doors towards 24,200+ levels in the coming sessions.
🚀 Strong sector participation from banks, IT, and autos — a broad-based rally is a positive sign.
🚀 Keep an eye on global cues + FII activity — may add fuel to the trend.
NSE:NIFTY is Going to Burst Up Side ! SkyRocketing TIme is Near

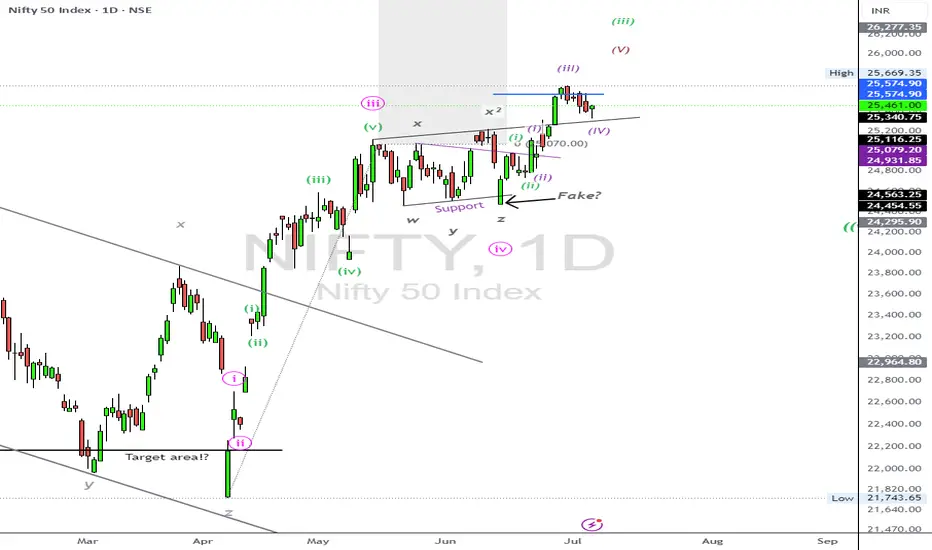
NIFTY50.....The path is clear! Or?Hello Traders,
the NIFTY50 is bouncing around the resistance level @ 25669 and 25116! Of course, a wide range, but that's the truth! I have labelled the chart as to see, but the pattern is not that clear as it seems!
Chart analysis; details!
The last multi-week low @ 21743 points was labeled as a wave z of 4! Since, the count is arguing a new impulse is underway with targets well above the latest ATH @ 26227! This, of course, is my main count I'm following.
But! The correction, started on September 27th 2024 and last 'til April 7th 2025, can morph into a wave b of a long term correction. The first correction (September to April) in fact was a wave a in this case, the actually one a wave b, with a leg (Wave) c to come. There is no rule how long (in terms of percent) this correction can extend, only a guideline. This one says, the maximum to be allowed is the 1.618 Fibo-Extension of wave a!
Anyway!
The bulls like to see new high's above the latest @ 26277, which is a long way to go. For this idea, it is important not to touch the area of the wave (i) pink @ 25317! If this were the case, the count is no longer valid. Following my interpretation of a "possible" wave b, that extent, the path would be set to a new ATH in the coming 1–2 weeks, 'cause both path tell exact this scenario!
Anyway! We will see how the market will meet the decision in the coming week.
Act with patient and carefully!
Have a great weekend.....
Ruebennase
Please ask or comment as appropriate.
Trade on this analysis at your own risk.
Rising Nifty momentum has broken major ResistanceRising Nifty momentum has broken major Resistance and upward momentum may continue.

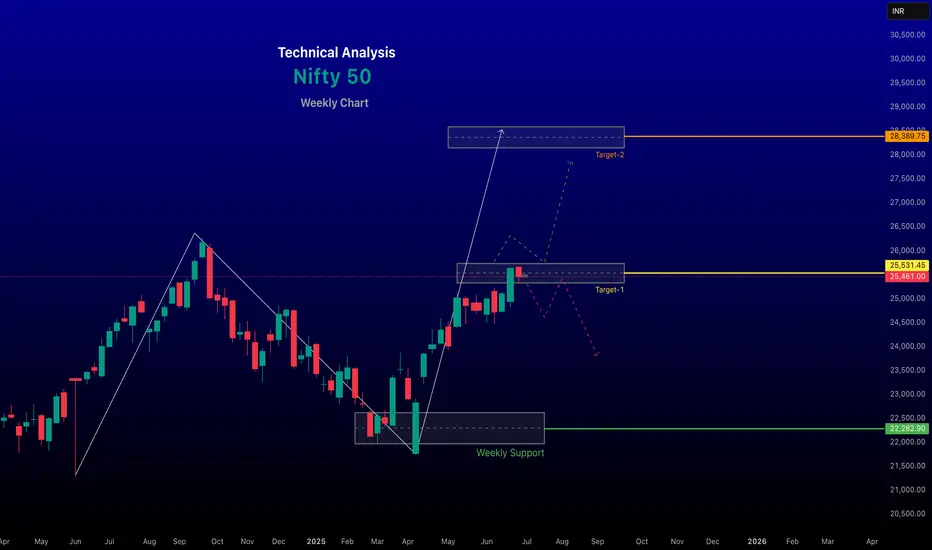
RenderWithMe | Nifty 50-Forecast Upcoming Week July 7–11,2025
~~NIFTY 50 Analysis for Next Week (July 7–11, 2025)Current Market ContextRecent ~~
Performance: As of July 4, 2025, the NIFTY 50 closed at 25,461, Up 55 points from the previous session, The index has been trading within an ascending channel, with a weekly decline of -0.45% but a monthly gain of 3.67% and a yearly increase of 4.48%.
# Global Cues: Mixed signals from global markets are influencing sentiment. U.S. markets are hitting record highs, while Asian markets like Japan’s Nikkei 225 (+600 points) and Hong Kong’s Hang Seng (-0.42%) show varied trends. Rising oil prices and geopolitical concerns, along with expectations of new U.S. tariff announcements under the Trump policy roadmap, are creating caution.
# Domestic Factors: Strong institutional buying from Domestic Institutional Investors (DIIs) (net buyers of ₹3,036 crore) contrasts with Foreign Institutional Investors (FIIs) being net sellers (₹1,561 crore). This dynamic suggests domestic support but potential headwinds from foreign outflows.
~~ Technical Analysis ~~
Key Levels:Support: Immediate support lies at 25,000–25,150. A break below 25,000 could signal short-term weakness, with further support at 24,982 and 24,622.
Resistance: Resistance is seen at 25,650–25,750, with a strong barrier at 25,690–25,760. A breakout above 25,750 with volume confirmation could push the index toward 26,000 or higher (potentially 28,435).
Trend: The NIFTY is in a positive trend but showing signs of consolidation. Technical indicators like the Relative Strength Index (RSI) at 67.3 suggest upward momentum but caution as it nears overbought territory.
Chart Patterns: A "Cup and Handle" pattern is forming on the daily timeframe, indicating a bullish continuation if the index breaks above 25,655. However, a failure to sustain above 25,400 could lead to a pullback toward 25,320–25,000.
Moving Averages: The index remains above key moving averages (5 DMA: 24,908.6, 10 DMA: 24,934.2, 20 DMA: 24,862.07), reinforcing a bullish bias as long as it holds above 25,338 (daily closing stop-loss).
Sectoral OutlookPositive Sectors: Nifty Metal (+0.23%) and Nifty Pharma (+0.30%) showed gains, suggesting resilience. Banking remains strong, with Bank Nifty hitting a new high of 57,614.50 despite recent profit booking.
Weak Sectors: Nifty IT (-0.01%) and Nifty Financial Services (-0.47%) faced selling pressure, with key constituents like Kotak Bank (-1.96%) and Bajaj Finance (-1.39%) dragging performance.
Focus Areas: Watch banking and pharma for potential leadership, while IT and financials may remain subdued unless buying interest returns.
Key Factors to WatchGlobal Markets: U.S. and Asian market trends, particularly U.S. tariff policies and Federal Reserve rate cut expectations, will influence sentiment.
Macroeconomic Data: Domestic indicators like inflation, GDP revisions, or RBI policy updates could sway the market.
FII/DII Activity: Continued DII buying could offset FII selling, but a reversal in FII flows will be critical for sustained upside.
Geopolitical Risks: Rising oil prices and U.S.–India trade developments may create volatility.
Technical Breakouts: Monitor for a breakout above 25,750 or a breakdown below 25,000 to confirm the next directional move.
Trading StrategyBullish Case: If NIFTY sustains above 25,650, consider buying call options or index futures targeting 25,760–26,000. Use a stop-loss at 25,000.
Bearish Case: If NIFTY falls below 25,000, short positions or put options could target 24,982–24,622, with a stop-loss at 25,450.
Range-Bound: If the index trades between 25,450–25,750, adopt a neutral strategy like selling iron condors to capitalize on low volatility.
Risk Management: Use strict stop-losses and avoid over-leveraging, as volatility is expected due to global and domestic triggers.
Forecast for the WeekExpected Range: 25,000–25,750, with potential for a breakout toward 26,000 if resistance is cleared.
Bias: Sideways to moderately bullish, with risks of profit booking or volatility mid-week.
Probability:Bullish breakout (above 25,750): 40%
Consolidation (25,000–25,750): 50%
Bearish pullback (below 25,000): 10%
Long-Term Outlook (July 2025)Predictions suggest NIFTY could reach 26,055–26,484 by August, with a gradual climb to 28,400 by November 2025, driven by economic growth and sectoral strength. However, these are speculative and depend on sustained bullish momentum.
Disclaimer --
This analysis is based on recent technical data and market sentiment from web sources. It is for informational purposes only and not financial advice. Trading involves high risks, and past performance does not guarantee future results. Always conduct your own research or consult a SEBI-registered advisor before trading.
#Boost and comment will be highly appreciated
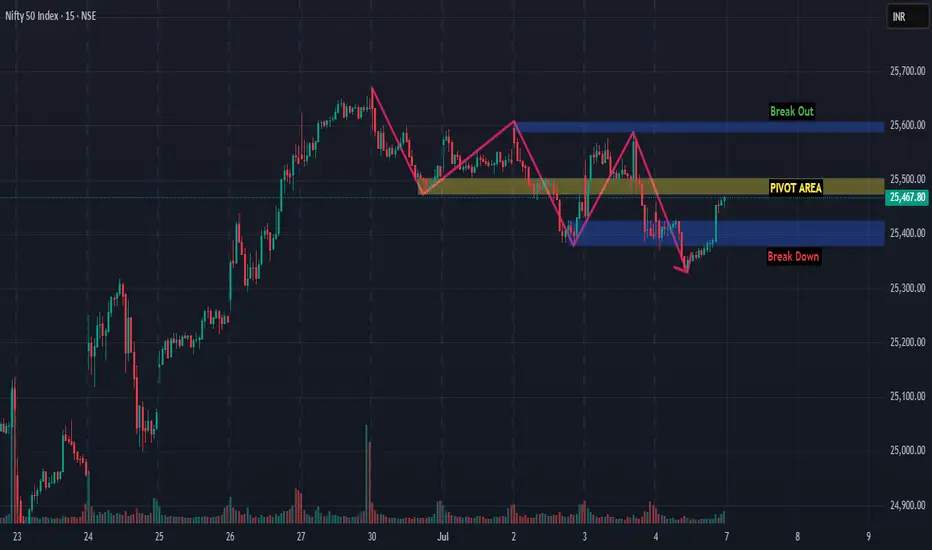
NIFTY ANALYSIS FOR 07-11/07 WEEKThis analysis based on purely zigzag drawing. As per drawing we can see nifty is still in a rangebound position but this phase is important.
from a neutral zone if we can make position with proper analysis and risk management then Break out or Break Down anything happen we can enjoy the ride.
I would like to encourage you just practice the simple drawing. Practice a lot.
On the basis of opening on Monday we can analyze further, till then learn and enjoy weekend.
Thanks for reading. 🙏
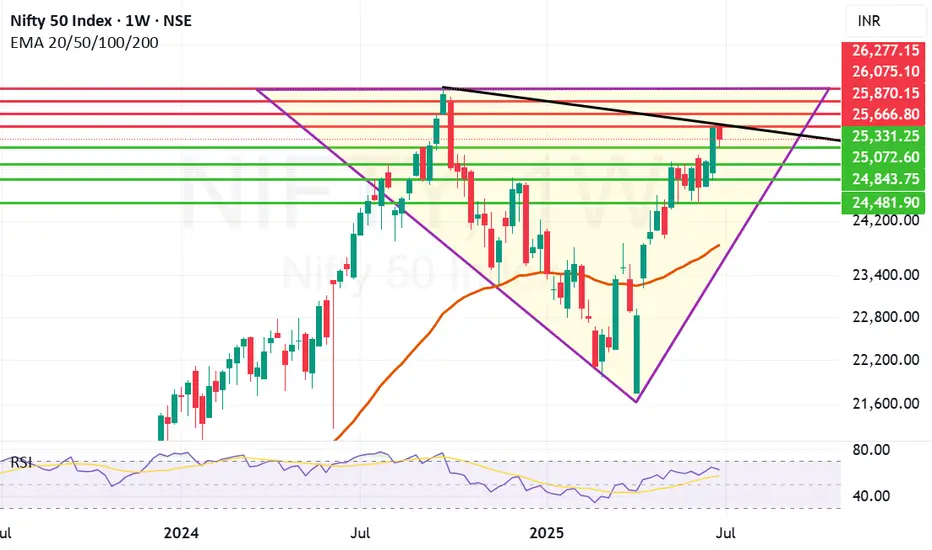
Good Closing by Nifty: Trump Tariff decision awaits us next weekNifty closed the week at 25461 well after gaining 130 points from Friday low of 25331. Overall Nifty closed 55 point positive from Thursday closing. This was a very smart recovery of Nifty from the lows of the day but we are heading towards Trump Tariff deadline of 9th July. That has potential to shake the market and move it any direction so investors should keep an eye on the developments and keep their stop losses and trailing stop losses in place. Overall Nifty is on the path to V shaped recovery as indicated in the chart. If everything works out in favour of India in the negotiation the 816 point gap from previous all time high will be bridged sooner than later. Once we reach the Previous All-time high the recovery will be complete. But we have to be cautiously optimistic.
Nifty supports currently remain at: 25331, 25072, 24843, 24481. If 24481 is broken than Bears will try to drag Nifty towards 23840 (Which is the Mother line of Weekly Chart).
Nifty Resistances currently remain at: 25666 (Trend line Resistance), 25870, 26075, 26277 (Previous All time high).
Disclaimer: The above information is provided for educational purpose, analysis and paper trading only. Please don't treat this as a buy or sell recommendation for the stock or index. The Techno-Funda analysis is based on data that is more than 3 months old. Supports and Resistances are determined by historic past peaks and Valley in the chart. Many other indicators and patterns like EMA, RSI, MACD, Volumes, Fibonacci, parallel channel etc. use historic data which is 3 months or older cyclical points. There is no guarantee they will work in future as markets are highly volatile and swings in prices are also due to macro and micro factors based on actions taken by the company as well as region and global events. Equity investment is subject to risks. I or my clients or family members might have positions in the stocks that we mention in our educational posts. We will not be responsible for any Profit or loss that may occur due to any financial decision taken based on any data provided in this message. Do consult your investment advisor before taking any financial decisions. Stop losses should be an important part of any investment in equity.