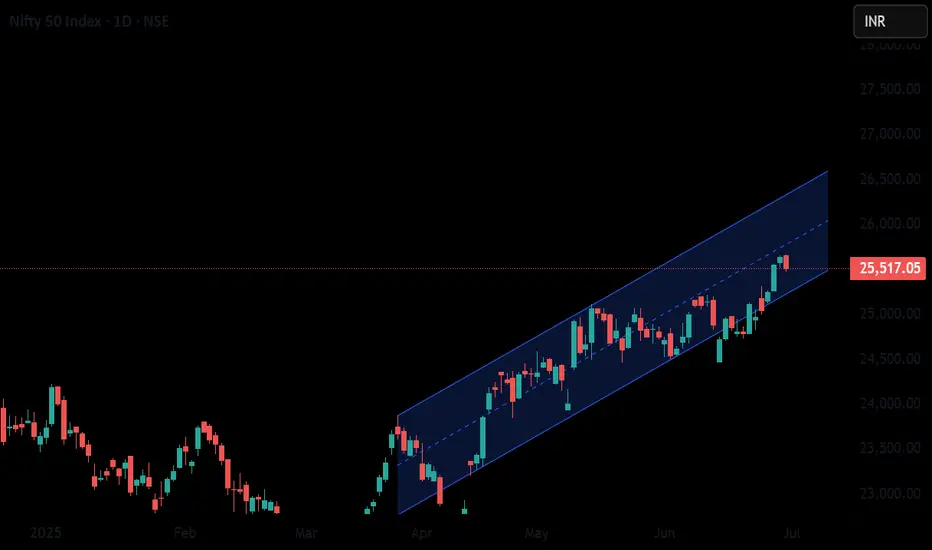
Nifty 50 moving in upward channel, with strong foundation Apparently NIfty 50 is moving in a upward channel to its all time high probably.
NIFTY trade ideas
Nifty levels - Jul 01, 2025Nifty support and resistance levels are valuable tools for making informed trading decisions, specifically when combined with the analysis of 5-minute timeframe candlesticks and VWAP. By closely monitoring these levels and observing the price movements within this timeframe, traders can enhance the accuracy of their entry and exit points. It is important to bear in mind that support and resistance levels are not fixed, and they can change over time as market conditions evolve.
The dashed lines on the chart indicate the reaction levels, serving as additional points of significance to consider. Furthermore, take note of the response at the levels of the High, Low, and Close values from the day prior.
We hope you find this information beneficial in your trading endeavors.
* If you found the idea appealing, kindly tap the Boost icon located below the chart. We encourage you to share your thoughts and comments regarding it.
Wishing you success in your trading activities!

nifty 50 intrady trading ideatoday we got 3 trade and showing you through chart.
how to took?
booked profit on support.

NIFTY Nearing Long-Term Resistance | RSI Divergence + Volume Anc📌 Chart: NIFTY – Monthly TF
I'm observing 3 major signals that could define the next few months for NIFTY:
1️⃣ Price Stretched Far from Anchored Averages (AVs):
Price is trading significantly above all major anchored levels — showing trend strength, but also a high risk of reversion if momentum weakens.
2️⃣ RSI Bearish Divergence Developing:
While NIFTY approaches the 26,000 zone, monthly RSI is diverging — a classic sign of slowing upside strength, often seen at major cycle tops.
3️⃣ Anchored Volume Node at ~17,788:
High volume accumulation took place here before the current rally. If correction begins, this level could act as structural support or a re-entry base.
⏳ My Conclusion:
We may be in the final leg of the current bullish run. 26,000 is a key psychological + technical level. I'm watching for exhaustion signs in July. If divergence plays out, a retest of AVs or volume anchor around 17,788 is not unlikely.
📉 Long-term caution with a plan to hedge or rotate into defensive themes may be wise.
💬 Would love to hear your thoughts — is this the early sign of a cycle top, or just another pause?

Nifty is Bearish for next week. But Why ? "Ask me in comments".Nifty is facing resistance at this level for a specific reason. this week it can be bearish and continue to go down side.

#NIFTY Intraday Support and Resistance Levels - 30/06/2025Nifty is expected to open on a flat note near the 25,630 zone. The market has shown strong bullish momentum in recent sessions, and prices are now hovering near the upper resistance band of 25,750. If Nifty manages to break and sustain above the 25,750 level, a fresh upward move can be expected, with targets around 25,850, 25,900, and 25,950+. This could offer good long opportunities, especially above the 25,750–25,770 breakout range.
On the downside, if Nifty faces resistance around 25,750 and starts to reverse from that level, a short opportunity could emerge in the 25,750–25,700 zone. In such a case, reversal targets can be seen at 25,650, 25,600, and 25,550. Support at 25,550 will act as a crucial level to watch.

#Nifty directions and levels for June 30:Good morning, Friends! 🌞
Here are the market directions and levels for June 30:
Market Overview
There have been no changes in the global or local markets. Both the global markets and our local markets are showing bullish sentiment.
Gift Nifty is indicating a positive start of around 20 points today.
So, what can we expect today?
The structures are still the same as what we saw in Friday’s session. We are currently in a minor consolidation zone, so if the market faces rejection near the immediate resistance, we can expect a retracement of around 38% to 50% in the minor swing.
On the other hand, if the market breaks the immediate resistance with a solid structure, then it could reach the next resistance level with the strong bullish bias.

NIFTY50.....Next move to ATH!Hello Traders,
The NIFTY50 has shown breake out of the trendchannel vs triangle structure! It has risen to my cited target area @ 25260 to 25300 points and overcome the targets as well!
Another goal!
Chart analysis:
The ATH @ 26277 points will be the next target, and as I wrote many times, this will be not the end of the structure. I will refrain from mentioning any further goals for the time being.
So, the next move should lead N50 to new ATH`s well above the 26277 range. The potential is given for another long-term wave!
On the downside there is, not so much, potential for a corrective move. While the structure doesn't look complete, I think for at maximum downside potential to 23935 area! It should come, but not yet!
More often than not, the diverging trend lines, possibly created by the triangle structure, will be touched again in the next 1-2 weeks! Well, we will see if so to come, and if...we will judge again!
Caused by a busy weekend, this should be all for today!
Have a great week.....
Ruebennase
Please ask or comment as appropriate.
Trade on this analysis at your own risk.

Market Recap: Nifty Breaks Out After 5 Weeks of Consolidation!The Indian stock market saw a strong bullish move this week, with Nifty 50 closing at 25,637, marking a significant gain of 525 points from the previous week's close. The index made a high of 25,654 and a low of 24,824, finally breaking out of the key resistance zone of 25,000–25,100 after five weeks of sideways consolidation.
This breakout is a critical technical development, signaling renewed strength in the broader market. However, to sustain this momentum and target the all-time high zone of 26,134–26,277, Nifty may need to either:
Consolidate within the previous week's range of 25,650–24,800, or
Retest the breakout level near 25,200 for confirmation.
Failing to do so could make this breakout a false one.
Weekly Outlook for Nifty:
For the coming week, the expected trading range is between 25,200 and 26,150. Price action around these levels will be key to watch.
On a broader sectoral view, out of 14 NSE indices, only Nifty Financial Services is showing relative strength on the monthly chart—a potential red flag for sustained bullish sentiment. When just one sector leads while others lag, it's often a sign to remain cautious.
Strategy Suggestion:
Consider booking partial profits and trailing stop losses on the remaining positions. Until the monthly time frame turns decisively bullish, it's wise to stay alert and manage risk actively.
Global Markets: S&P 500 Breaks Out!
In the U.S., the S&P 500 surged to close at 6,173, successfully breaking above its key resistance level at 6,013. This breakout, if sustained above 6,150 next week, opens up the path toward higher targets: 6,225 / 6,376 / 6,454 / 6,500.
However, traders should remain flexible. If the breakout fails, we could see a pullback to support zones near 6,013 or even 5,899.
Pro Tip:
Be ready to switch trading positions quickly if the breakout doesn’t hold—volatility is still very much in play in both Indian and U.S. markets.

Nifty : Strong Breakout MomentumBreaking out from a 5‑week consolidation, The Nifty ended positively.
Fading geopolitical tensions & Rising FII long-short ratio and futures rollover suggest bullish sentiment.
With key time-based levels and technical thresholds in focus, we could see Nifty scale toward 26,000 📈
📌 There is also a Poll & Flag pattern breakout visible on higher time frame. Which indicates targets towards 27200 / 28000.
These upper range open once Nifty starts sustain above ATH oh Daily & Weekly time frame on medium term

Nifty 50 Hourly Chart Update 📊 Nifty 50 Hourly Chart Update 📊
Nifty’s leap hits 25,600 🚀
But signs of a short-term pause are showing up… ⚠️
🔹 RSI at 75 🔼
🔹 ATR dropping 📉
🔹 Price at Pitchfork & Gann Square resistance 🎯
📉 A mild reversal may be on the cards before the next move.
⏳ A better entry opportunity might come in the next few days. Stay patient, stay sharp! ⚔️📅

Nifty Weekly Analysis as of 29/06/2025Nifty analysis
banknifty analysis
stocks analysis
dji nasdaq etc etc

Nifty in next 2-3 WeeksNifty 50 Index has given a sharp pull back from months lows. But there is a pull back expected but before that Index should touch 25700 and then a 500 point pull back in coming days.

NIFTY 50 INDEX CHART ANALYSIS FOR INTRADAYNIFTY 50 INDEX CHART ANALYSIS FOR INTRADAY.
here we are seeing of nifty 50 index chart, and one is resistance and one box is support that is yellow color and if price will come to support and then we will try to find of buy opportunity. if support zone breaks then we will plan for sell of nifty and if break of resistance, then we will see big rally.

Nifty July 1st Week Analysis Nifty is looking positive for the week ahead, and we can expect momentum to continue up to 26000-26148 levels.The Important level to watch for upside would be 25750-800, and if Nifty breaches downside support of 25550, then we can expect a small retracement up to 25200-300 on the downside.
All levels are marked in the chart posted.

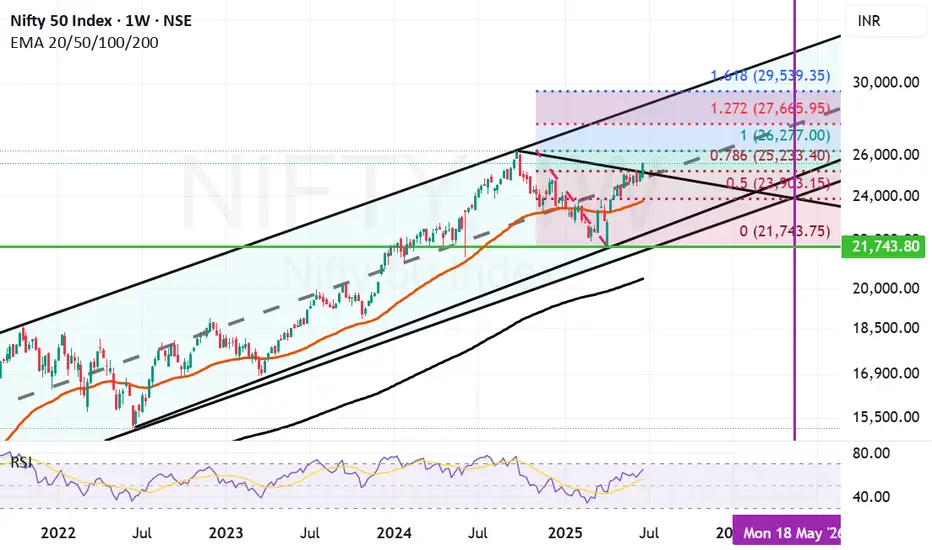
Medium to long term targets for Nifty. We have used parallel channel and Fibonacci retracement on Nifty weekly chart to gauge medium to long term targets for Nifty.
The Fibonacci retracement points out that the support for Nifty will remain at 25233(Fibonacci Support and mid channel support), 23903 (Important Fibonacci support), 23774 (Important Mother line support or 50 weeks EMA, channel bottom support). Nifty can go below these levels only in situation of another major global event or some major local event. If we get a closing below 23774 the Bear will be in commanding situation and will have the power to take Nifty further down towards 21743 which was the recent low we reached during Indo-Pak conflict.
The resistances for Nifty now are at 26277 (Major Resistance, Previous All Time high of Nifty), The next leap of faith for Nifty can be towards 27665 after we get a closing above 26277. (This will be a major hurdle and in next 1 year or so it is highly unlikely that we will cross this level unless we hit a euphoria zone.) This zone is also the current channel top zone. In very unlikely circumstance of Nifty crossing 27665 the next target for Nifty will be at 29539. (This looks possible in 18 to 24 months). We will be very lucky to reach this zone earlier. You never say never in the market.
As of now the local factors remain optimistic but there is a concern by experts related to valuation of market. As the Nifty PE currently is around 23. The results in the next couple of quarters will determine if Bull market stays active.
Disclaimer: The above information is provided for educational purpose, analysis and paper trading only. Please don't treat this as a buy or sell recommendation for the stock or index. The Techno-Funda analysis is based on data that is more than 3 months old. Supports and Resistances are determined by historic past peaks and Valley in the chart. Many other indicators and patterns like EMA, RSI, MACD, Volumes, Fibonacci, parallel channel etc. use historic data which is 3 months or older cyclical points. There is no guarantee they will work in future as markets are highly volatile and swings in prices are also due to macro and micro factors based on actions taken by the company as well as region and global events. Equity investment is subject to risks. I or my clients or family members might have positions in the stocks that we mention in our educational posts. We will not be responsible for any Profit or loss that may occur due to any financial decision taken based on any data provided in this message. Do consult your investment advisor before taking any financial decisions. Stop losses should be an important part of any investment in equity.
Rising Nifty momentum has broken major ResistanceRising Nifty momentum has broken major Resistance. Global cues are positive for Indian stock markets.

28 june Nifty50 brekout and Breakdown leval ✅ Level 1: ₹26,018
Above 10-Min Candle Closing
🔹 Indicates a short covering zone
🔸 Strategy: Close all PE positions, shift to CE or book profits
Below 10-Min Candle
🔹 Hold PE positions (Safe Zone)
🔸 Suggests market facing resistance here
✅ Level 2: ₹25,830
Above 10-Min Candle
🔹 Entry-level for holding CE positions
🔸 Possible bullish breakout
Below 10-Min Candle
🔹 Hold PE – but this is a Risk Zone
🔸 Caution: Trend reversal may happen
✅ Level 3: ₹25,670
Above 10-Min Candle
🔹 Indicates positive market sentiment
🔸 Hold CE (Calls)
Below 10-Min Candle
🔹 Indicates negative trade view
🔸 Hold PE (Puts)
✅ Level 4: ₹25,578
Above Opening S1 Level (10-Min Candle)
🔹 CE buy/hold confirmation
Below Opening R1 Level (10-Min Candle)
🔹 PE hold confirmation
🔸 Market turning weak
✅ Level 5: ₹25,478
Above 10-Min Candle
🔹 Buy/Hold CE
Below 10-Min Candle
🔹 Buy/Hold PE
🔸 Important pivot level – directional bias confirmation
✅ Level 6: ₹25,290
Above 10-Min Candle
🔹 Safe Zone to hold CE
Below 10-Min Candle
🔹 Unwinding zone
🔸 Exit CE positions, reduce longs – possible sharp fall
📊 Live Market Reference
Current Market Price (CMP): ₹25,632.45
Below ₹25,670 = Negative Bias
Strategy: Until price crosses ₹25,670 and sustains for 10 min, avoid CE entries or keep trailing SL on PE.
🎯 Sample Option Strategy (Example):
If price is below ₹25,670:
✅ Buy PE (Put Option)
Strike: ATM or slightly ITM (e.g., 25,600 PE)
Stop-Loss: If price moves above ₹25,670
Target: ₹25,478 / ₹25,290
If price is above ₹25,670:
✅ Buy CE (Call Option)
Strike: ATM or slightly OTM (e.g., 25,700 CE)
Stop-Loss: If price breaks back below ₹25,670
Target: ₹25,830 / ₹26,018
📌 Important Notes:
This strategy is intraday based on 5-min chart levels.
Levels like ₹25,478 and ₹25,290 are key for risk management.

One of the reason, Why I m saying 5th wave done?Here you can see the pitchfork tool applied, as u can see that Nifty has touched this pitchforks median line from below and taking a resistance from it. This is the final 5th wave resistance. For further more elaboration, here are two ways I applied this tool:
1. In this particular snapshot, I touched 3rd pivot of this tool on the 7th April 2nd lowest pivot on hourly TF.
2. And yesterday prediction was based on this same tool but the 3rd pivot of the tool was on 7 April lowest pivot means on 21742.
Thats why there is a slight difference between these two median lines from two different ways of applying.
As u can see nifty has taken support on this line multiple times and forming a wavy structure around it

Nifty levels - Jun 30, 2025Nifty support and resistance levels are valuable tools for making informed trading decisions, specifically when combined with the analysis of 5-minute timeframe candlesticks and VWAP. By closely monitoring these levels and observing the price movements within this timeframe, traders can enhance the accuracy of their entry and exit points. It is important to bear in mind that support and resistance levels are not fixed, and they can change over time as market conditions evolve.
The dashed lines on the chart indicate the reaction levels, serving as additional points of significance to consider. Furthermore, take note of the response at the levels of the High, Low, and Close values from the day prior.
We hope you find this information beneficial in your trading endeavors.
* If you found the idea appealing, kindly tap the Boost icon located below the chart. We encourage you to share your thoughts and comments regarding it.
Wishing you success in your trading activities!

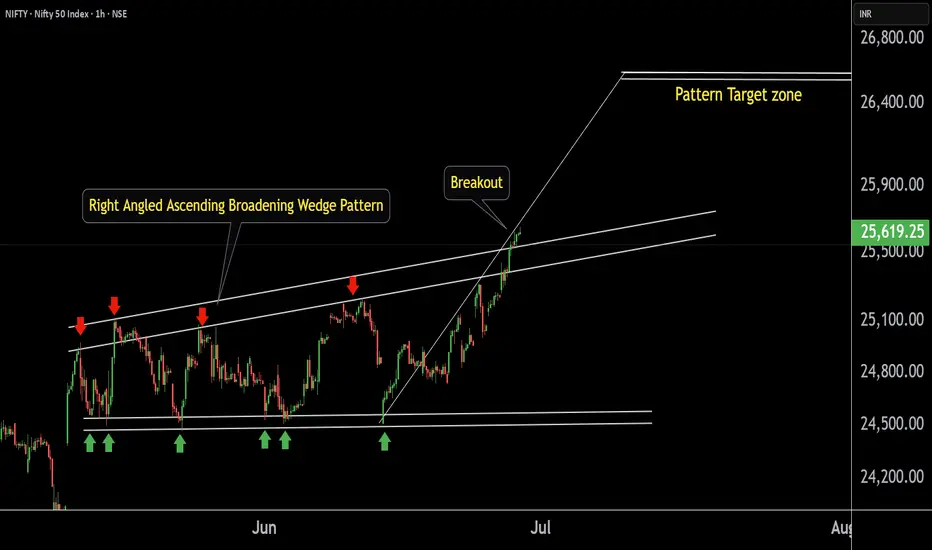
NIFTY 50 key level This is the 1 hour chart of NIFTY 50 .
NIFTY 50 has formed Right Angled Ascending Broadening Wedge Pattern.
Nifty 50 has given a breakout from its pattern.
If Nifty 50 sustains after a successful retest post-breakout, we may see higher prices in Nifty 50.
The target for this pattern is projected near the 26,600 level.
Thank You !!
Nifty - Reposting of previous Levels Again
This is just a "Reposting of #Nifty previous Levels Again" to help you to remember so that you can plan your activity accordingly. Every level plays a key level as target, support and resistance.
Previous Levels
Current Price: 24,461.15
Mid-point: 24413.83
Upside: 24913.61, 25115.13, 25378.11 and 25641.10
Downside: 23914.92, 23712.53, 23449.54 and 23186.55
Resistance: 24712.10
Stop loss: 24117.31
#Nifty

#Nifty - Pivot Point is 24850.48 | 23597.30 or 26103.65?Date: 06-06-2025
#Nifty Current Price 25000
Pivot Point: 24850.48 Support: 24548.09 Resistance: 25154.65
Upside Targets:
Target 1: 25360.61
Target 2: 25566.58
Target 3: 25835.11
Target 4: 26103.65
Downside Targets:
Target 1: 24341.23
Target 2: 24134.375
Target 3: 23865.8375
Target 4: 23597.30
