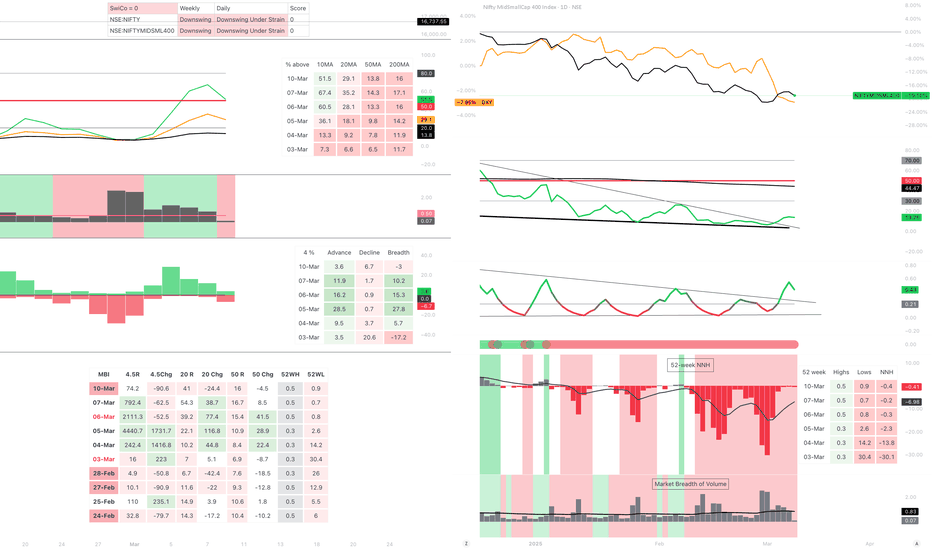
Technical Indicators & Market Breadth📈 Technical Indicators & Market Breadth
1️⃣ Moving Averages:
% Stocks Above 10MA: 51.5% ✅ (Improving)
% Stocks Above 20MA: 29.1% 🔻 (Weak)
% Stocks Above 50MA: 13.8% ❌ (Very Weak)
% Stocks Above 200MA: 16.0% ❌ (Bearish)
2️⃣ Advance-Decline Data:
Advancers: 3.6%
Decliners: 6.7%
Breadth: -3 (Negative

