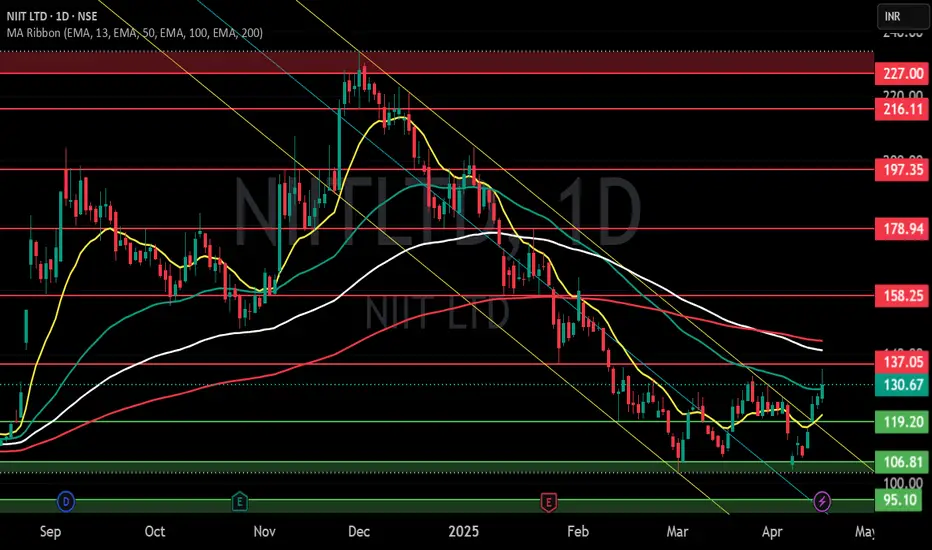
NIIT LTD S/RSupport and Resistance Levels:
Support Levels: These are price points (green line/shade) where a downward trend may be halted due to a concentration of buying interest. Imagine them as a safety net where buyers step in, preventing further decline.
Resistance Levels: Conversely, resistance levels (re
Next report date
—
Report period
—
EPS estimate
—
Revenue estimate
—
3.41 INR
461.25 M INR
3.58 B INR
64.97 M
About NIIT LTD
Sector
CEO
Pankaj Prabhakar Jathar
Website
Headquarters
Gurgaon
Founded
1981
ISIN
INE161A01038
FIGI
BBG000CWT1S1
NIIT Ltd. engages in the provision of education and training services. It offers multi-disciplinary learning management and training delivery solutions to corporations, institutions, and individuals. Its brands include Training.com, NIIT.tv, NIIT NGuru, IFBI, and NIIT Imperia. The company was founded by Rajendra Singh Pawar, Parappil Rajendran, and Vijay Kumar Thadani on December 2, 1981 and is headquartered in Gurgaon, India.
Related stocks
Cup and Handle in NIITNIIT has completed cup and handle formation.
It has broke out of handle and it is trying to re-test the breakout level, which will now act as support.
Dividing capital in small parts and keep adding in range of 217-200 might be be good strategy.
Can also added when price touches 21 EMA.
NEVER CHAS

Cup & Handle (C&S) Breakout in NIITLTDNSE:NIITLTD has given a nice C&H breakout today in daily with good volumes. If the move sustains then potential target for this breakout would be in 245/250 range.

NIIT Limited - Stock Analysis Here's a clear trading setup based on recent price action:
🔹 Buy Zone: ₹181.20
🔹 Sell Target: ₹246.45
🔹 Potential Upside: +25.31% 🚀
Analyze these levels, manage your risk, and trade wisely! 🐂
⚠️ Disclaimer: This is not financial advice. Always DYOR before investing.
CTA: "🔖 Save this post for fut

50 SMA Rising- Positional TradeDisclaimer: I am not a Sebi registered adviser.
This Idea is publish purely for educational purpose only before investing in any stocks please take advise from your financial adviser.
Its 50 SMA Rising Strategy. Suitable for Positional Trading Initial Stop loss lowest of last 2 candles and keep tra

[Bullish] Long term wave 5 in progressNSE:NIITLTD caught my attention last week due to multiple bulk deals and then today the stock skyrocketed to UC with 20% move.
We seem to be in last wave (5th) of current major cycle that started in 2013. Right now, we seem to be in minor wave 3rd of larger 5th. Ideal entry point would be >=155 th

#NIITLTD 113 TGT 130 #Coforge #MIT #FII #DII #stocks #tradingNIITLTD 113
TGT 130
TF < 3M
NSE:NIITLTD
If you like my work KINDLY LIKE SHARE & FOLLOW this page for free Stock Recommendations. With 💚 from Rachit Sethia

NIIT LTD NIIT is good in volume and previse breakout is positive after FII's & DII's Profit booking.
it is at good support and FIB level.
it could be silent for some days and wait for breakout.
this article is for education only not giving any advice.

NIIT poised for a 15-25% upmove The stock is in consolidation since Sep 2023, looks poised to break out of the 4 month old consolidation.
One may enter and look for,
Target 1 - 129
Target 2 - 133
Target 3 - 140
Target 4 - 150-154

NIITLTDAs per technical analysis and company's fundamental analysis, I suggest to buy this stock at 124 and hold for target 150 - 180.
All major points & downward levels mentioned on chart
Do your own research because I am not SEBI registered person and this is my personal opinion about this stock
Thank

See all ideas
Summarizing what the indicators are suggesting.
Neutral
SellBuy
Strong sellStrong buy
Strong sellSellNeutralBuyStrong buy
Neutral
SellBuy
Strong sellStrong buy
Strong sellSellNeutralBuyStrong buy
Neutral
SellBuy
Strong sellStrong buy
Strong sellSellNeutralBuyStrong buy
An aggregate view of professional's ratings.
Neutral
SellBuy
Strong sellStrong buy
Strong sellSellNeutralBuyStrong buy
Neutral
SellBuy
Strong sellStrong buy
Strong sellSellNeutralBuyStrong buy
Neutral
SellBuy
Strong sellStrong buy
Strong sellSellNeutralBuyStrong buy
Displays a symbol's price movements over previous years to identify recurring trends.
Frequently Asked Questions
The current price of NIITLTD is 118.53 INR — it has decreased by −2.49% in the past 24 hours. Watch NIIT LTD stock price performance more closely on the chart.
Depending on the exchange, the stock ticker may vary. For instance, on NSE exchange NIIT LTD stocks are traded under the ticker NIITLTD.
NIITLTD stock has fallen by −6.20% compared to the previous week, the month change is a −10.90% fall, over the last year NIIT LTD has showed a −7.83% decrease.
We've gathered analysts' opinions on NIIT LTD future price: according to them, NIITLTD price has a max estimate of 150.00 INR and a min estimate of 150.00 INR. Watch NIITLTD chart and read a more detailed NIIT LTD stock forecast: see what analysts think of NIIT LTD and suggest that you do with its stocks.
NIITLTD reached its all-time high on Dec 2, 2024 with the price of 233.80 INR, and its all-time low was 3.23 INR and was reached on Mar 9, 2009. View more price dynamics on NIITLTD chart.
See other stocks reaching their highest and lowest prices.
See other stocks reaching their highest and lowest prices.
NIITLTD stock is 2.87% volatile and has beta coefficient of 2.23. Track NIIT LTD stock price on the chart and check out the list of the most volatile stocks — is NIIT LTD there?
Today NIIT LTD has the market capitalization of 15.91 B, it has decreased by −1.06% over the last week.
Yes, you can track NIIT LTD financials in yearly and quarterly reports right on TradingView.
NIIT LTD is going to release the next earnings report on Aug 11, 2025. Keep track of upcoming events with our Earnings Calendar.
NIITLTD earnings for the last quarter are 1.00 INR per share, whereas the estimation was 0.50 INR resulting in a 100.00% surprise. The estimated earnings for the next quarter are 0.50 INR per share. See more details about NIIT LTD earnings.
NIIT LTD revenue for the last quarter amounts to 863.00 M INR, despite the estimated figure of 883.00 M INR. In the next quarter, revenue is expected to reach 895.00 M INR.
NIITLTD net income for the last quarter is 131.39 M INR, while the quarter before that showed 133.95 M INR of net income which accounts for −1.91% change. Track more NIIT LTD financial stats to get the full picture.
EBITDA measures a company's operating performance, its growth signifies an improvement in the efficiency of a company. NIIT LTD EBITDA is 32.34 M INR, and current EBITDA margin is 0.90%. See more stats in NIIT LTD financial statements.
Like other stocks, NIITLTD shares are traded on stock exchanges, e.g. Nasdaq, Nyse, Euronext, and the easiest way to buy them is through an online stock broker. To do this, you need to open an account and follow a broker's procedures, then start trading. You can trade NIIT LTD stock right from TradingView charts — choose your broker and connect to your account.
Investing in stocks requires a comprehensive research: you should carefully study all the available data, e.g. company's financials, related news, and its technical analysis. So NIIT LTD technincal analysis shows the sell today, and its 1 week rating is sell. Since market conditions are prone to changes, it's worth looking a bit further into the future — according to the 1 month rating NIIT LTD stock shows the sell signal. See more of NIIT LTD technicals for a more comprehensive analysis.
If you're still not sure, try looking for inspiration in our curated watchlists.
If you're still not sure, try looking for inspiration in our curated watchlists.