NMDC strong supportNMDC is at strong support and can ride slowly to the top... one can sell 82.5 PE at 1.65 if you see it is dropping below 83 then buy 85 PE to limit losses which is altogether a different cup of tea (Option Writers world) simply buy and hold with 80 stoploss
NMDC trade ideas

R-0148 NMDC LONGIntraday Cash Buy NMDC @ 88.50 - 88.80 SL 87.75 TGT 91
Above VWAP + TK cross over + MACD cross over + cloud break out GO LONG


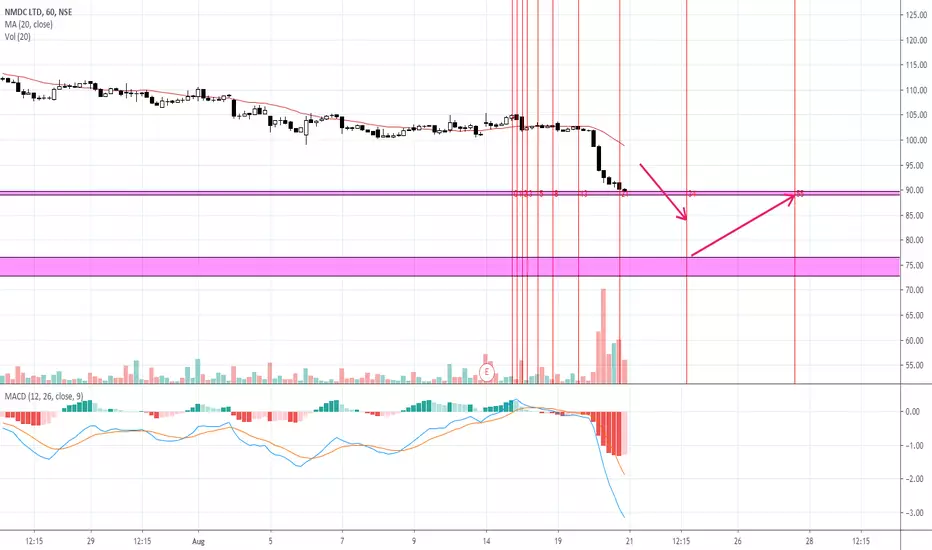
NMDC , Daily Analysis Evening Star Pattern On Top , With A HIGH Volume Shows Buyers Are Not Willing to Buy At Higher Levels , Nest Candle Down , With A Low Volume Indicating Buyer Strength Are Getting Excused .
On 75 Min We GET RSI Divergence But In Daily Divergence Are Yet To Show ,
1st Case :- Price Can Came Down Hold Near About 85 Zone Then Can Touch lower Trend-line Or If It Get Demand From 83-86 Levels It Can Make One More High And Enter In Supply Zone . there we can check For Daily Divergence And Shorting Opportunity .
As Down Volumes Are Really Low So I While Coming Down From Upper Levels , Now We Have to Check Levels Of 83-86 And Observe Price Action There .
Happy Trading .

NMDC - Destruction aheadFormation of an impulsive wave having 4th wave already completed. Currently the stock is trading in the 5th wave which is expected to be completed in the zone of 35-34. The idea will be invalidated if the stock sustained above the level of 86 till then it is sell on rise candidate.

Trends Suggests NMDC Could Fall 50% + Longer-TermThe weight of the evidence remains mixed and suggests that there will be winners on the long side, winners on the short side, and a lot of stocks in the middle that aren’t going anywhere. Here’s NMDC Ltd. breaking back below former support/resistance near 78 and starting to move lower again. With momentum in a bearish range and absolute and relative price action in a downtrend, we want to be short with a long-term target down near 35. This, combined with absolute and relative weakness from the Nifty Commodities and Nifty Metal Indexes continue to suggest further downside for the sectors and related stocks.


NMDC buy in dipsNMDC CMP 126.10
Add in dips if get 113 - 118 levels
TGT 138 / 148 / OPEN
SL 102 - 104


NMDCThere is bearish divergence on NMDC on RSI,MFI and Bollinger band, wait for MACD to turn negative and then go short with stop above 115 for the target of 91

NMDC SHORT | DOUBLE TOP PATTERN | 18-22/09/2019 |DATE 18-22/09/2019
NMDC SHORT@184
STOPLOSS@187
TARGET@179


743.. Is this the end of micro cSL compulsory
Long term investment 0.2% investment at 90 and another 1% of investment at 76.20