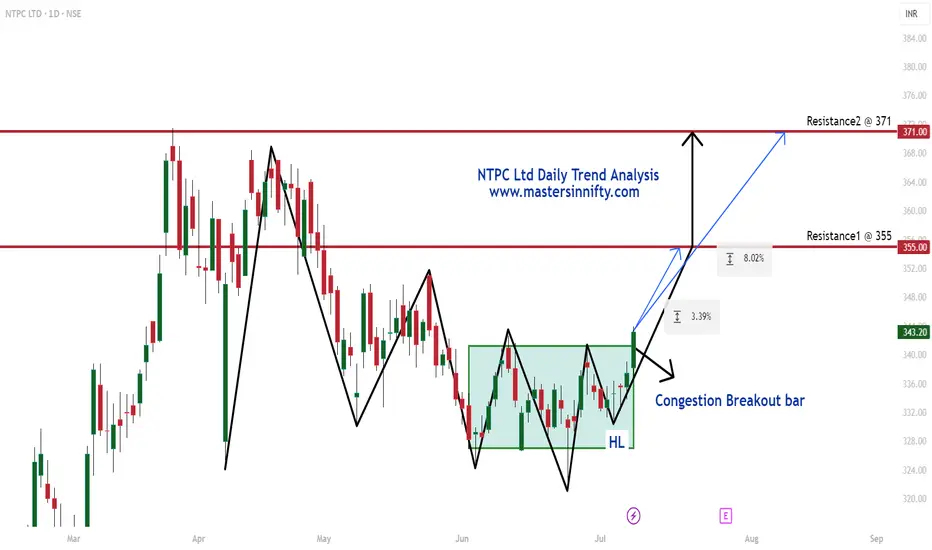
NTPC Daily Trend AnalysisNTPC Ltd has broken out of a 24-bar range, formed a new higher low, and closed above the range today.
This breakout signals a potential bullish trend over the next 7 trading sessions, with an initial target of ₹355. If the price sustains above ₹355, it may advance toward the next key resistance level at ₹371.
This is my personal view and not a buy or sell recommendation. Traders are encouraged to perform their own technical analysis before taking any trading decisions.
NTPC trade ideas
$NSE:NTPC : A Powerhouse with Multibagger Potential?I’ve been reviewing NTPC Ltd ( NSE:NTPC ), India’s largest power generation company, and I see promising long-term potential as the company pivots towards cleaner energy and expands capacity to support India’s growing energy needs.
Why I See Multibagger Potential
Green energy pivot: NTPC is transforming from a thermal-heavy player to a clean energy leader — the transition opens huge long-term value.
Undemanding valuation: Despite the growth visibility, NTPC trades at reasonable PE and PB multiples, offering valuation comfort.
Policy tailwinds: Strong government focus on energy security, renewables, and electrification will continue to favor NTPC.
Execution strength: NTPC has a long history of successfully executing large-scale projects on time and within budget.
Just Accumulate near it best support Green AREA !
oNLY IN cASH
tHANKS

NTPC📈 Trade Setup: BUY at 338
Parameter Value
Entry Price 338
Stop Loss (SL) 323
Risk 15
Target 494
Reward 156
Risk:Reward (RR) 10.4
Last High 448
Last Low 292
✅ Trade Interpretation
Entry Zone (338) is exactly at Weekly & Daily Demand.
SL (323) is just below this demand zone – protects from fake breakdowns.
Target (494) is ambitious, well above the previous high of 448, suggesting a potential breakout trade.
Risk-Reward Ratio (10.4) is exceptional – highly favorable trade.
📌 Key Observations
Stacked Demand Zones across all timeframes (from 323 to 338) give confidence in entry.
Momentum alignment across all timeframes (HTF, MTF, ITF) → indicates trend continuation.
Target (494) is logical if price breaks above last high (448) – breakout + momentum.
🔔 Suggested Strategy:
Entry near 334–338 zone, preferably on a bullish confirmation candle.
Trail SL once price crosses 360–380 range (monthly midpoint).
Partial booking near 448, and hold for extended target 494 if strength continues.
🔍 Multi-Timeframe (MTF) Analysis – NTPC
🔸 Higher Time Frame (HTF)
Trend: Strong UP across all (Yearly, Half-Yearly, Quarterly)
Key Demand Zones:
Yearly & Half-Yearly: 315–292 (Avg ~305)
Quarterly: 393–296 (Avg: 345)
HTF Average Demand Zone: 341–295, Avg 318
Interpretation: Robust long-term support zones, especially with demand logic and breakout structures forming.
🔸 Medium Time Frame (MTF)
Trend: All UP (Monthly, Weekly, Daily)
Zones:
Monthly: 360–296 (Avg: 328)
Weekly: 338–323 (Avg: 331)
Daily: 338–323 (Avg: 329)
These are all tightly stacked → indicates strong short- to mid-term support at 323–338.
🔸 Intraday Time Frame (ITF)
Trend: All UP (240M, 180M, 60M)
All have the same zone: 334–323 (Avg: 329)
Supports the entry zone very well — short-term traders are aligned with higher timeframe momentum.

NTPC TARGET NEARBY 35% Will JUMP Within next monthsNTPC SHARE TARGET AND SL PROVIDED . There is no any recomandation of buy or sell
#ntpc#target

NTPC- FOR SWING TRADE Currently price is moving in a zone. And it is also making a Cup & Handle type of pattern in daily time frame.
If price cross 350 next target can be 366 to 370.
Price is also following a curve line support.

NTPC Swing and short positional viewsWe can see in H1 chart, after 80% Fibonacci retracement taking, chart has formed H1 CHoCH (change of character). So, it ensure bullish market view started. After hitting H1 OB(order block) market has formed internal CHoCH (i-Ch) which reinforces bullish view. So, at this moment aggressive trader take market price long position and Safe trader will wait for internal inducement (i-X).
We can expect 5-6% profit in swing trading and 15-20% profit in short positional investment.

NTPC One can make an entry in NTPC after breakout from cup and handle pattern.
If you find this helpful and want more FREE forecasts in TradingView, Hit the 'BOOST' button
Drop some feedback in the comments below! (e.g., What did you find most useful?
How can we improve?)
Your support is appreciated!
Now, it's your turn!
Be sure to leave a comment; let us know how you see this opportunity and forecast.
Have a successful week
DISCLAIMER: I am NOT a SEBI registered advisor or a financial adviser. All the views are for educational purpose only

NTPC Trend directionNTPC 364 is on its resistance verge. We expect it will breakdown its support 347 to fall down its long tend support 290 in coming days.

NTPC cup and handle pattern•CMP: ₹375 Stop Loss: ₹350 Target:*410/425/440
DISCLAIMER: I am NOT a SEBI registered advisor or a financial adviser. All the views are for educational purpose only.
NTCP NTPC
*W* in the making on Weekly TF.
Price Breakout Need to be Watched.
Respective Resistance levels are the Target - Multiple.
*Trail SL with Upside*
*Book Profit as per Risk Appetite*
RSI: In Bullish Zone.
Strong Vol. Consolidation. Continued Traction.
Positive Energy Outlook too in favour.
*This is an Opinion. Do your own Research*
*_Happy Investing_*


NTPC Demand ZoneNTPC coming under a demand zone while matching with Nifty 50 suggests a potential buying opportunity, but it’s essential to analyze key factors before making a trading decision.
How to Validate NTPC's Demand Zone with Nifty 50?
✅ 1. Identify NTPC's Demand Zone
Look for strong support levels where price previously bounced.
Ensure high volume confirmation in the demand zone.
✅ 2. Compare with Nifty 50 Movement
If Nifty 50 is also in a demand zone, NTPC may follow the broader trend.
✅ 3. Confirmation with Price Action
Look for inside bars or reversal candlestick patterns in NTPC.
Check higher timeframes (weekly/monthly) for strong support levels.
If NTPC shows strength while Nifty is stable or rising, it adds confidence to the trade.
Would you like a deeper technical analysis on NTPC's current levels? 🚀

fist videos 🟢 **Support Levels**
Key Support**: Around **₹325.70** (marked as a potential bounce zone).
The recent price action indicates a double-bottom or rounding-bottom pattern 📉➡️📈. This is a bullish reversal signal.
📈 **Resistance Levels**
Immediate Resistance**: ₹343.70
The stock needs to break this level convincingly for further upward movement.
Next Major Resistance**: ₹446.35 (52-week high).
If momentum sustains, this is the next target for bulls 🚀.
🔵 **Volume Analysis**
Rising green volume bars recently suggest increasing buying interest at the support level 🔊.
A breakout above ₹343.70 with high volume would confirm the bullish trend 💪.
🛑 **Risk Factors**
Failing to hold above ₹325.70 may lead to further downside, potentially testing lower levels.
The broader trend (decline from October highs) suggests caution until key levels are crossed 🔺.
### 🧭 **Outlook**
The chart suggests a potential upward move if the stock stays above ₹343.70 and gains momentum 📊.
**Summary with Emojis**
📉➡️📈: Reversal in progress.
- 🔊: Buying interest is increasing.
🚀: Potential breakout above ₹343.70.
⚠️: Risk if ₹325.70 breaks.
no recommendation for buy and sell

NTPC- Ema 100 > 144 > 200 > 300NTPC- Ema 100 > 144 > 200 > 300
1) Nice pattern W and vcp
2) Strong support zone
3) Lets see target 412


NTPC--Trendline Support??This stock is trading near its trendline support
previously price bounces multiple times from the trendline.
Now we have to again look for buying opportunity in this stock for continuation.
we have to look this time will again bounce from the same trendline
or
price will grab the liquidity below this trendline and goes higher.
Find potential opportunities in this when price reaches these levels.
1st bounce is expecting at 340-345 levels.
On bottom side if price takes the liquidity, we have demand zone lies at 290 levels.
Find Long opportunities in this stock.

now in ntpc 350 is support and u can buy on this levelIn ntpc u can check support 350 so u can Cleary view and this is bottom so now target 400 ++

NTPCYear long trendline support. Please do your own analysis before entering a trade. Pls boost the post if you find this post helpful.

NTPC 1D TFNTPC has broken a strong support zone. As the market is also in a downtrend, shorting this stock for a quick return is a good idea.
As you can see in 1 Hour TF, it has also re-tested the zone and can reach lower support zones.
The first target can be 355 - 360 zones and below.
Trade safe. Manage risk. Be profitable.
Please follow us for more simple trading analysis and setups. Also, let me know in the comment if you have any queries.
Disclaimer:- This is my view. Please analyze the charts yourself and then decide to take any trades.

NTPC NSE:NTPC
NTPC (National Thermal Power Corporation) Ltd and its affiliated companies are mainly responsible for producing and distributing large amounts of electricity to state power utilities. The group also offers consultation, project management and supervision, energy trading, and exploration of oil and gas as well as coal mining.
The company's power plants portfolio as of June 2020 consists of approximately 63,000 MW from 70 power plants. Coal plants contribute around 83% of the total capacity, followed by gas/liquid fuel plants at 10%, hydro at 5%, and renewables at 2%. The company owns 17% of the total installed capacity in India, with a 22% share in electricity generation in the country. The company has a well-diversified allocated capacity across different regions, with no single region contributing more than 40% of the total allocated capacity as of April 2021.
The company has been operating at a higher PLF from its thermal power stations than the All India thermal PLF for the last 5 years. In FY20, it achieved a PLF of approximately 68%, while the All India Thermal PLF was only about 56% for the same year.
In terms of under-construction assets, as of June 2020, the company has approximately 20,500 MW of power projects under various construction phases. The majority of the under-construction capacity, around 76%, is from coal projects, followed by hydro at 13% and renewable energy (wind, solar) at 11%.
🔰
Sharing my weekly chart analysis for peaceful investing that I am following
disc: Invested for PWI - LAB portfolio , always focus on each trade to be a hero trade for long term.
do you own research no recommendation


NTPC LONGNTPC
MTF Analysis
NTPCYearly Demand 315
NTPC 6 Month Demand BUFL 315
NTPCQtrly Demand BUFL 393
NTPCMonthly Demand 393
NTPCWeekly Demand 407
NTPCDaily Demand DMIP 392
ENTRY -1 407
SL 385
RISK 22
Potential Target 499
First Target Points 442
First recovery Target Points 57
Last Swing Low 385
Last Swing High 442
RR 3
RR 23%
