Nykaa Long_Support @ 20 DEMANykaa Long:
- Price takes support @ 20 DEMA
- Earnings on Friday
- Enter when Price is favourable in lower timeframe
NYKAA trade ideas

NYKAA<>BreakoutA breakout is occurring with increasing volume. A high-volume close above the 221-222 level would confirm the breakout, potentially from a Cup & Handle pattern.
Keeping on radar.

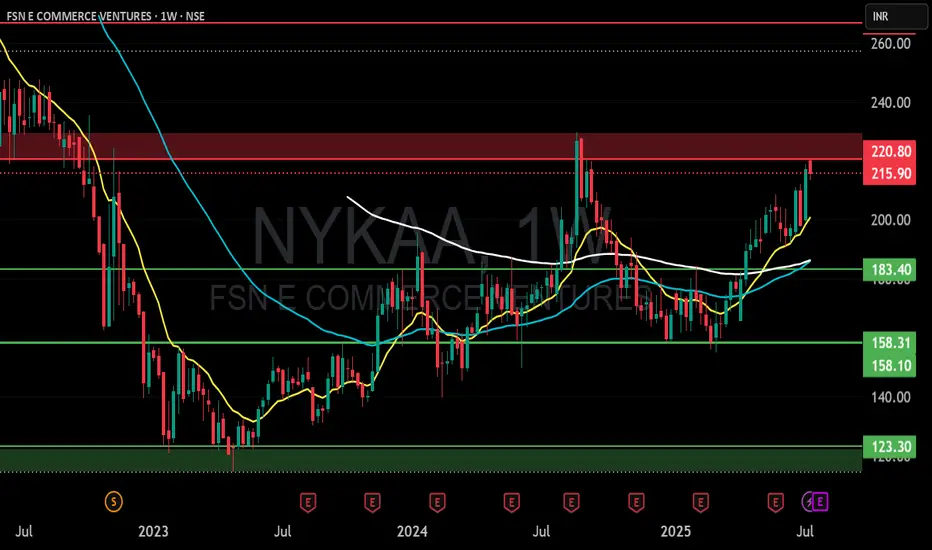
NYKAA (FSN COMMERCE VENTURES) S/RSupport and Resistance Levels:
Support Levels: These are price points (green line/shade) where a downward trend may be halted due to a concentration of buying interest. Imagine them as a safety net where buyers step in, preventing further decline.
Resistance Levels: Conversely, resistance levels (red line/shade) are where upward trends might stall due to increased selling interest. They act like a ceiling where sellers come in to push prices down.
Breakouts:
Bullish Breakout: When the price moves above resistance, it often indicates strong buying interest and the potential for a continued uptrend. Traders may view this as a signal to buy or hold.
Bearish Breakout: When the price falls below support, it can signal strong selling interest and the potential for a continued downtrend. Traders might see this as a cue to sell or avoid buying.
MA Ribbon (EMA 20, EMA 50, EMA 100, EMA 200) :
Above EMA: If the stock price is above the EMA, it suggests a potential uptrend or bullish momentum.
Below EMA: If the stock price is below the EMA, it indicates a potential downtrend or bearish momentum.
Trendline: A trendline is a straight line drawn on a chart to represent the general direction of a data point set.
Uptrend Line: Drawn by connecting the lows in an upward trend. Indicates that the price is moving higher over time. Acts as a support level, where prices tend to bounce upward.
Downtrend Line: Drawn by connecting the highs in a downward trend. Indicates that the price is moving lower over time. It acts as a resistance level, where prices tend to drop.
Disclaimer:
I am not a SEBI registered. The information provided here is for learning purposes only and should not be interpreted as financial advice. Consider the broader market context and consult with a qualified financial advisor before making investment decisions.
NYKAA - Cup and HandleGood candle today, valid entry for a swing trade. The volume candle on earnings day is hiding the high volume candles printed in the last week. Keep today's low as SL

Nykaa BuyNykaa stock (FSN e-Commerce) is taking support at trend line. Buy @CMP (203) with SL of 195 and target of 210 and 230.

FSN E COMMERCE VENTURES at Best Support Level | NYKAA !!This is the 4 hour Chart of Nykaa.
Nykaa having a good law of polairty near at 195-190 range.
Nykaa is forming ascending boradening wedge pattern with support at 190-195 range .
If this level is sustain , then we may see higher prices in Nykaa .
Thank You !!

NYKAACMP Mcap 58,000 cr
Sales: 8000 cr (ttm)
Growth Negative
Profits: Max 160 cr ( ttm)
FII constantly SElling !!
NYKAA LONG TRADE SETUP📊 Price Action & Trend Analysis
Analyzing market trends using price action, key support/resistance levels, and candlestick patterns to identify high-probability trade setups.
Always follow the trend and manage risk wisely!
Price Action Analysis Interprets Market Movements Using Patterns And Trends On Price Charts.
👉👉👉Follow us for Live Market Views/Trades/Analysis/News Updates.
uptrend be ready for it and take action own riskin long term also having the uptrend and this idea only for education purpose take action on the own risk if any one want to do analysis of any stock comment me name i will give you chart idea

Nykaa near target in just 1 day... 6% in 1 dayYesterday posted nykaa at 180 neckline breakout... Today hits target at 192... That is 6% movement


NYKAA LONG TRADE SETUP📊 Price Action & Trend Analysis
Analyzing market trends using price action, key support/resistance levels, and candlestick patterns to identify high-probability trade setups.
Always follow the trend and manage risk wisely!
Price Action Analysis Interprets Market Movements Using Patterns And Trends On Price Charts.
👉👉👉Follow us for Live Market Views/Trades/Analysis/News Updates.

Nykaa or KhalnykaaWhat a disaster this has been
ONly people who have made money are the promoters by selling their Overpriced stock to Gullible investors
Results by first week, would be a completde disaster.
This would touch a new low before in the first half of 2025.
Nykaa se KhalNykaa !!

NYKAA - A good buy with targets of 175NYKAA - A good buy with targets below
Targets
T1 - 176
T2 - 180
T3 -190
SL - 162

NYKAA - Downside View - Educational Purpose Only!This is a trap move to make retail traders bullish on this stock. Dont enter longs.
Note: Educational Purpose only!

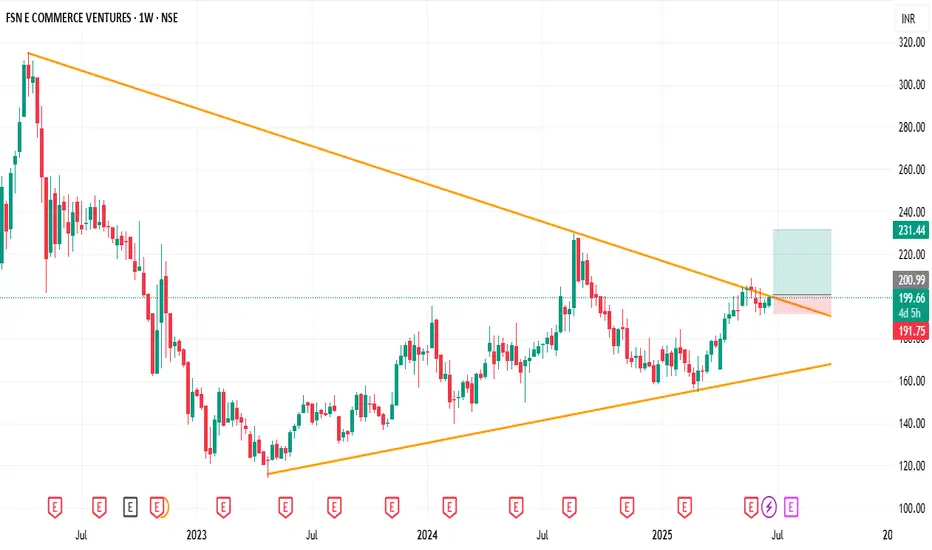
Strong bounce from support NYKAANSE:NYKAA
Recently big names bought in
Relative strength
Strong support
Above the triangle breakout
Buy for target of 235 and above
SL: Honestly go without SL and keep adding, but if you want to you can have 178 as SL

NYKAAOn this chart, there are lines called "Fibonacci retrenchment levels," which help predict where the price might go up or down.
Here's the simple breakdown:
The chart shows different levels where the price could stop and change direction. These levels are like markers on the chart.
The blue arrow on the chart suggests that the price might go up.
There's also a note saying that the price might increase.
In short, the chart is trying to predict that the price will go up and shows some important points where it might change direction. If you have any specific questions, feel free to ask!

this can be a false breakdown NSE:NYKAA the break is not reflected in the rsi that means there is hesitation for sellers this should be a false break down however 140/150 is next support zone my own strategy is to accumulate on dips for investment as for reasons to do so one can comment and know my reasons

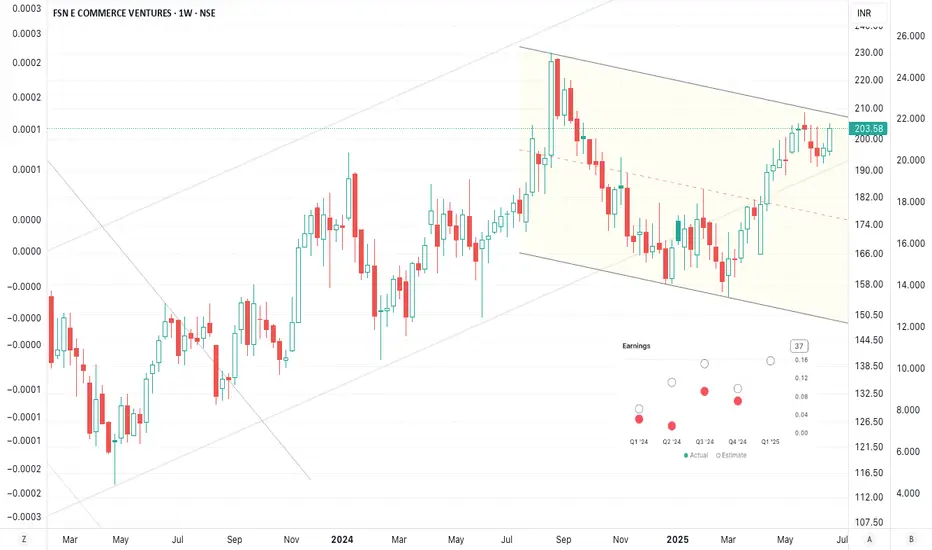
Nykaa Short term target to 205Based on current pattern Nykaa has short term potential to reach 205 with following stages.
190 - 200 - 205

Go long in NYKAA above 176We have noticed down a good level breakout in NYKAA. If it closes above 176 on hourly frame then we can expect targets of 180, 191 & 201 on the upper side.


NykaaTrade Setup:
- crossed resistance of 210 INR and sustained on weekly basis (price trading at support levels).
- 20 EMA crossed (or is above) 50 EMA on weekly basis, and the EMA's are steep in upward direction.
- RSI > 50
- RS is positive (>0)
Buy price = CMP (215 INR). Add on drips until near 50 EMA
Stop loss = trendline
Target = 310 INR
