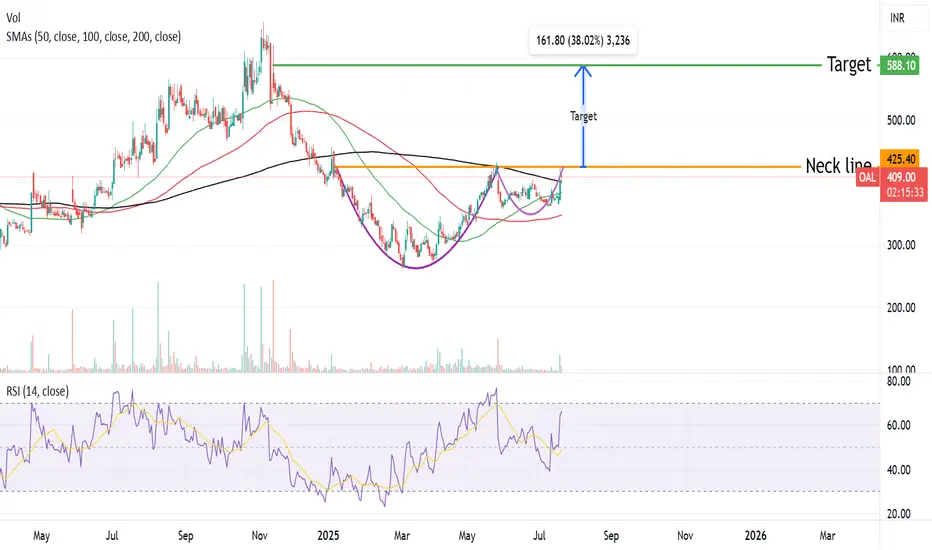
Oriental aromatic forming a CUP & HANDLE pattern Oriental aromatic forming a CUP & HANDLE pattern ,Breakout of this pattern will be above 425 level ,One can accumulate the stock with a stoploss of 360 for a Target of 580.
OAL trade ideas
ORIENTAL AROMATICS LTD S/RSupport and Resistance Levels:
Support Levels: These are price points (green line/shade) where a downward trend may be halted due to a concentration of buying interest. Imagine them as a safety net where buyers step in, preventing further decline.
Resistance Levels: Conversely, resistance levels (red line/shade) are where upward trends might stall due to increased selling interest. They act like a ceiling where sellers come in to push prices down.
Breakouts:
Bullish Breakout: When the price moves above resistance, it often indicates strong buying interest and the potential for a continued uptrend. Traders may view this as a signal to buy or hold.
Bearish Breakout: When the price falls below support, it can signal strong selling interest and the potential for a continued downtrend. Traders might see this as a cue to sell or avoid buying.
20 EMA (Exponential Moving Average):
Above 20 EMA(50 EMA): If the stock price is above the 20 EMA, it suggests a potential uptrend or bullish momentum.
Below 20 EMA: If the stock price is below the 20 EMA, it indicates a potential downtrend or bearish momentum.
Trendline: A trendline is a straight line drawn on a chart to represent the general direction of a data point set.
Uptrend Line: Drawn by connecting the lows in an upward trend. Indicates that the price is moving higher over time. Acts as a support level, where prices tend to bounce upward.
Downtrend Line: Drawn by connecting the highs in a downward trend. Indicates that the price is moving lower over time. It acts as a resistance level, where prices tend to drop.
RSI: RSI readings greater than the 70 level are overbought territory, and RSI readings lower than the 30 level are considered oversold territory.
Combining RSI with Support and Resistance:
Support Level: This is a price level where a stock tends to find buying interest, preventing it from falling further. If RSI is showing an oversold condition (below 30) and the price is near or at a strong support level, it could be a good buy signal.
Resistance Level: This is a price level where a stock tends to find selling interest, preventing it from rising further. If RSI is showing an overbought condition (above 70) and the price is near or at a strong resistance level, it could be a signal to sell or short the asset.
Disclaimer:
I am not a SEBI registered. The information provided here is for learning purposes only and should not be interpreted as financial advice. Consider the broader market context and consult with a qualified financial advisor before making investment decisions.

ORIENTAL AROMATICS LTD The global Camphor market size was valued at USD 479.39 million in 2021 and is expected to expand at a CAGR of 3.92 (Percent) during the forecast period, reaching USD 603.63 million by 2027.
List of Indian TOP Manufactures in Camphor Market are: -
● Kanchi Karpooram
● Camphor and Allied Products ( Oriental Aromatics LTD)
● Mangalam Organics
● Sapthagiri Camphor ( Unlisted)
- Among above 3 Listed scripts OAL and KANCHI shortlisted , Since OAL business is diversified its less risky , But Based on funadmentals Kanchi Karpooram is attractive /Cheap to buy.
Market Cap
₹ 1,361 Cr.
Current Price
₹ 404
Stock P/E
224
Book Value
₹ 186
Dividend Yield
0.14 %
ROCE
5.19 %
ROE
3.35 %
Face Value
₹ 5.00
Promoter holding
74.2 %
EPS last year
₹ 6.13
EPS latest quarter
₹ -1.76
Debt
₹ 231 Cr.
Pledged percentage
0.00 %
Net CF
₹ 3.33 Cr.
Price to Cash Flow
-64.0
Free Cash Flow
₹ -57.1 Cr.
Debt to equity
0.37
OPM last year
6.46 %
OPM 5Year
13.9 %
Reserves
₹ 610 Cr.
Price to book value
2.16
Int Coverage
1.59
PEG Ratio
-29.6
Price to Sales
1.68
Market Cap to Sales
1.68
Qtr Profit Var
-169 %

A breakout and retest technical tradePrice broken and retested almost 2 yrs consolidation with significant volume..
... sl below 477 closing basis buying zone 520-532 if comes .... Only for educational purposes and not any recommendation ....I am not a sebi registered RA

OAL potential breakout - Strong prior uptrend.
- Resting on 10EMA.
- Volume contraction.
- Inside bar formation.

Oriental Aromatics-Nice BreakoutOriental Aromatics-Nice Breakout
Capital to be deployed -20k
Investing Price -514
Breakout Price -514
Stoploss -419
Targets -681-898
#orientalaromatics #StockMarketindia #StockToWatch #StocksInFocus #stockstowatch #StocksToTrade


oalCamphor & Allied Products Ltd incorporated in 1961 is India’s largest manufacturers of variety of terpene chemicals and other speciality aroma chemicals. Its vast product range includes synthetic camphor, terpineols, pine oils, resins, astrolide, dihydromyrcenol, and several other chemicals finding applications in vast array of industries ranging from flavours & fragrances, pharmaceuticals, soaps & cosmetics, rubber & tyre, paints & varnishes and many more.
Product range of the company includes:
Fragrance Chemicals
Pharmaceutical Products
Aromatic Chemicals
Industrial Chemicals

trend line breakout with huge volumestock has broken trend line buy on dips as support of trend line huge volume seen on daily chart


triple top on daily charttriple top on daily chart, close above horizontal line stock can give quick upside

Channel patternIF it breaks out of the channel pattern it can achieve targets of 1047, 1237. The company is one of only ten completely integrated flavour, fragrance and aroma chemical manufacturing companies in the world. That is a big deal, but even if we discount all that information and see its growth it is good.. last March (2020) it slid down to 133...right now it is 943...that is big..I have mentioned IF in capitals because the broader market is choppy and is correcting so we wait and see...keep watching


Bullish on Oriental Aromatics Ltd(Daily)
- Above Long term and medium term moving averages
- Macd Crossover
🎯 Target - 1172


OAL- LONG TERM PERSPECTIVE FUNDAMENTALLY STRONGALL THE LEVELS AND PATTERNS ARE MARKED ON CHART, RED ZONES DENOTES SUPPLY ZONES AND GREEN IS FOR DEMAND ZONE.
STOCK IS NEAR 100 EMA IN 4 HOURS TF AND ALSO NEAR 50 DAILY EMA(GREY). GETTING SUPPORTED BY LONG TERM TRENDLINE AND ALSO COMPLETED 38.20% FIBO LEVEL. **KEEP IN MIND THAT THERE IS NO HIGHER HIGH FORMATION YET**
The indicator used:
1) Daily Lines plots Daily 20 (BLACK) & 50 EMA (GREY) on lower time frame charts
2) TE-REKAB
- PB : PULLBACK
If you like the analysis, do leave a like and follow for more such content coming up.
The analysis is my POV, hope you got bucks in your pocket to consult a financial advisor before investing :P :)
HAPPY TRADING!!!

