OBEROIRLTY trade ideas

Intraday view OBEROIRLTY for tomorrow 21st MayIntraday view OBEROIRLTY for tomorrow 21st May
Expecting buying opportunity above 1755
Stop loss area below 1740
Follow strict risk reward and stop loss
Charts for Educational purposes only.
Thanks,
V Trade Poin

OBEROIRLTY - Bullish setupStock name - Oberoi Realty Limited.
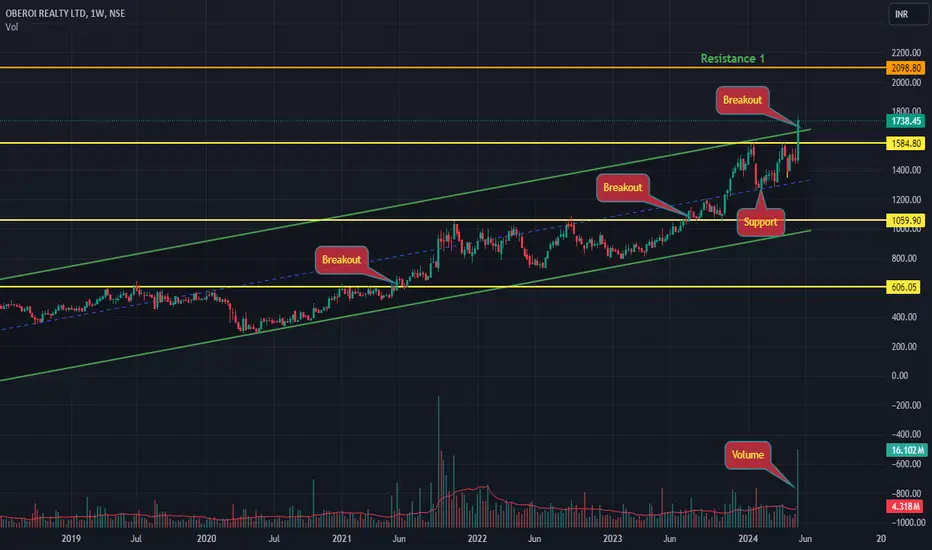
Weekly chart setup
Chart is self explanatory. Levels of breakout, possible up-moves (where stock may find resistances) and support (close below which, setup will be invalidated) are clearly defined.
Master Score - B
Disclaimer: This is for demonstration and educational purpose only. this is not buying and selling recommendations. I am not SEBI registered. please consult your financial advisor before taking any trade.
Oberoirlty view for tomorrow 17th MayOberoirlty view for tomorrow 17th May
Buying opportunity only above if sustain above 1722
Charts for Educational purposes only. Not a Trading Recommendation
Strictly follow Risk Reward and Stop Loss
Thanks,
V Trade Point

Double Moving Averages Crossover Swing Trade📊 Script: OBEROIRLTY
📊 Sector: Realty
📊 Industry: Construction
⏱️ C.M.P 📑💰- 1497
🟢 Target 🎯🏆 - 1586
⚠️ Stoploss ☠️🚫 - 1453
📊 Script: JUBLFOOD
📊 Sector: Quick Service Restaurant
📊 Industry: Hotels
⏱️ C.M.P 📑💰- 472
🟢 Target 🎯🏆 - 507
⚠️ Stoploss ☠️🚫 - 458
📊 Script: FIVESTAR
📊 Sector: Finance
📊 Industry: Finance & Investments
⏱️ C.M.P 📑💰- 781
🟢 Target 🎯🏆 - 838
⚠️ Stoploss ☠️🚫 - 760
📊 Script: KPITTECH
📊 Sector: IT - Software
📊 Industry: Computers - Software - Medium / Small
⏱️ C.M.P 📑💰- 1517
🟢 Target 🎯🏆 - 1625
⚠️ Stoploss ☠️🚫 - 1468
⚠️ Important: Always maintain your Risk & Reward Ratio.
✅Like and follow to never miss a new idea!✅
Disclaimer: I am not SEBI Registered Advisor. My posts are purely for training and educational purposes.
Eat🍜 Sleep😴 TradingView📈 Repeat 🔁
Happy learning with trading. Cheers!🥂

Broadening wedge pattern breakout in OBEROIRLTYOBEROI RELTY LTD
Key highlights: 💡⚡
✅On 1 Hour Time Frame Stock Showing Breakout of Broadening Wedge Pattern.
✅Strong Bullish Candlestick Form on this timeframe.
✅It can give movement up to the Breakout target of 1489+.
✅Can Go Long in this Stock by placing a stop loss below 1371-.

Oberoi Realty Ltd. - Management Quality and Economic Moat
About NSE:OBEROIRLTY
Oberoi Realty Ltd, a prominent real estate development company in India, has demonstrated a high level of management quality and has established a significant economic moat in its sector.
Management Quality:
Strategic Growth and Diversification: Oberoi Realty has strategically focused on developing a diverse range of real estate projects, including residential, commercial, hospitality, and retail segments. This diversification helps in mitigating market volatility and caters to a wide range of customer needs.
Financial Performance: The company has shown strong financial performance, with sales volume increasing by 104% year-on-year, driven by new project launches. For instance, the launch of Elysian Tower B in Goregaon significantly boosted sales.
Operational Efficiency: Oberoi Realty's operational efficiency is highlighted by its effective management of key projects and steady growth in various segments, including hospitality and commercial developments.
Economic Moat:
Market Position and Brand Recognition: Oberoi Realty is well-recognized for its premium projects and has established a strong brand in the real estate sector, especially in the Mumbai Metropolitan Region (MMR). This brand recognition contributes to its competitive advantage and customer loyalty.
Project Portfolio: The company's diverse project portfolio, including key residential projects like Exquisite by Oberoi Realty, Esquire by Oberoi Realty, and commercial projects like Oberoi Chambers, strengthens its market position and offers steady revenue streams.
Strong Sales and Development Pipeline: The company's ability to maintain a robust pipeline of ongoing and upcoming projects, such as the anticipated launch in Thane and subsequent phases in Borivali/Goregaon, positions it well for future growth.
Strengths and Weaknesses:
Strengths:
Strong operating performance with a focus on high-value projects.
A diverse range of ongoing projects, contributing to a stable growth outlook.
Positive outlook due to strong demand in upcoming projects and a robust brand value.
Weaknesses:
The challenge of increasing trade receivables, indicating potential issues in cash flow management.
Exposure to stringent rules and regulations in the Indian real estate sector, which can impact operational flexibility.
Conclusion
In summary, Oberoi Realty Ltd's management quality is characterized by its strategic focus on diversified real estate development, robust financial performance, and efficient project management. The company's economic moat is reinforced by its strong market position, brand recognition, and diverse project portfolio. While the company has notable strengths in its operational performance and project pipeline, it needs to manage its trade receivables effectively and navigate the regulatory landscape efficiently.

Testing resistance makes it Weak.When the supply pressure absorbs in coming time it will make new life highs.
bullish price action, holding the lower levels firmly.
sellers seems panicking, soon the pressure will absorb by the buyers. and we ll just ride the trend.
All the best.
Gratify if you appreciate the practice then you can like it, share it and
If you want me to investigate any chart for you then would cherish doing that for you.
Thank you for your time and support.
Stay safe.

OBEROI REALTY - ASCENDING TRIANGLEAscending triangle chart pattern has been formed at the top of Oberoi Realty.
Breakout above 1425, we can except price can move up to 1500

OBERIOIRLTYNSE:OBEROIRLTY
LIFE TIME BO!!!
One Can Enter Now ! Or Wait for Retest of the Trendline (BO) Or wait For better R:R ratio
Note :
1.One Can Go long with a Strict SL below the Trendline or Swing Low of Daily Candle.
2. Close, should be good and Clean.
3. R:R ratio should be 1 :2 minimum
4. Plan as per your RISK appetite
Disclaimer : You are responsible for your Profits and loss, Shared for Educational purpose

Ready to make it reality #superchartzKey Levels
Support: 1075
Resistance: 1300
Learning:
An arc breakout in a stock:
1. **Lucrative Trading Opportunity**: An arc breakout signifies a potential entry point for traders to capture a bullish price movement, presenting a promising opportunity for profits.
2. **Timing the Market**: Recognizing an arc breakout can give traders a chance to enter the market at an advantageous moment, maximizing potential gains.
3. **Visual Clarity**: The curvature of the arc breakout pattern offers a visually distinct and compelling signal, making it easier for traders to spot potential opportunities.
4. **Technical Analysis Validation**: As a well-known technical pattern, the arc breakout is supported by a community of traders and analysts, adding confidence to its potential effectiveness. NSE:OBEROIRLTY
5. **Confirmation through Volume**: When accompanied by an increase in trading volume, the arc breakout's validity is reinforced, making it a more compelling signal to act upon.
6. **Investor Sentiment Shift**: An arc breakout often indicates a shift in investor sentiment, where positive news or market sentiment drives the stock price higher.
7. **Risk Management**: The arc pattern can also serve as a reference point for setting stop-loss levels, enabling traders to manage risk effectively.
8. **Engaging Market Dynamics**: Engaging in arc breakout trading can add excitement and intrigue to one's stock market experience, making it an enjoyable endeavor.
Remember, while the arc breakout pattern can be enticing, it's vital to exercise caution and combine it with other forms of analysis for well-informed investment decisions. Always stay updated on market trends and consult with financial professionals to optimize your trading strategies.

OBEROI REALTY AnalysisRealty Sector outperforming the benchmark index
OBEROI REALTY forming new all time highs
Supertrend positive and it broke Pivot R1 and previous swing high around 1200 level. It also tried to break Pivot R2 level as well but could not manage to do it.
I am expecting the stock to give some retracement near 1200 level before the bullish journey resumes again

OBEROIRLTY - Stock AnalysisOberoi Realty Ltd. is currently exhibiting remarkable strength across various technical and fundamental indicators, making it an enticing prospect for investors. In terms of technical analysis, the stock shows a "Strong Bullish" sentiment in several areas.
The PriceVol indicator reflects "Strong Bullish" sentiment, with rising prices accompanied by increasing trading volume over the last few sessions. Additionally, the stock has achieved a "Bullish" signal by making a new one-year high, reinforcing the positive outlook.
In the short term, the one-day analysis is "Bullish," with the latest tick showing a strong price rise. However, caution is advised to monitor the volume to ensure the sustainability of the trend. The Parabolic SAR (PSAR) is "Bullish" with a bullish crossover and holding steady, while the KeltnerBand, MACD (Moving Average Convergence Divergence), DonchianBand, HighLowBand, AwesomeOscillator, MAChannelBand, Bollinger Bands, and Supertrend all exhibit "Strong Bullish" signals, indicating positive breakouts and bullish trends.
The ADI (Average Directional Index) is "Bullish" and trending up nicely, showing positive momentum. The HighLowMABand and CMF (Chaikin Money Flow) also demonstrate "Strong Bullish" trends, suggesting positive breakouts and bullish trend reversals.
Candlestick patterns on the daily, weekly, and monthly charts all reflect positive sentiment, with the weekly and monthly patterns displaying "Strong Bullish" signals.
From a fundamental perspective, Oberoi Realty Ltd. appears significantly undervalued, with a Price to Intrinsic Value of 0.613. The company has displayed tremendous growth in its Book Value over the last three years, indicating a strong financial position.
Over the past twelve months, the company has achieved a remarkable Return On Equity of 21.10% and a strong Net Margin of 41.57%. All key Trailing Twelve Months Margins have grown by 15%. The annual net profit has been on a consistent upward trajectory for the last three years. Earnings Before Interest, Taxes, Depreciation, and Amortization (EBITDA) has continuously increased for the last three years, further highlighting the company's strong financial performance.
Oberoi Realty Ltd. also maintains a good Return On Capital Employed of 10.43% and offers a very low dividend yield of 0.350%. However, it's important to note that the company has a relatively low Earning Yield of 5.03%, indicating a focus on reinvesting profits for growth.
Notably, the company has experienced a strong jump in net sales, with significant year-over-year (YoY) growth, and the YoY Net Margin has seen an impressive increase of 1097.94%. Additionally, there has been a steady increase in Total Assets over the last three years, underlining the company's consistent expansion and overall financial strength.
In summary, Oberoi Realty Ltd. is an attractive investment opportunity with strong technical and fundamental indicators. The stock's bullish technical signals, coupled with its undervaluation and impressive financial performance, make it a promising choice for investors seeking growth potential and value in the market.
Go Long above 1217.10
Stop Loss 1083

Cup and Handle pattern and Candles
The Cup and Handle pattern is a bullish reversal pattern that forms when the price opens and closes near the high of the day, but with a long lower wick. The lower wick indicates that the sellers were able to briefly push the price lower, but the buyers were able to take control and drive the price back up.
The Cup and Handle pattern is similar to the Hammer candlestick pattern, but it has a longer lower wick. This suggests that the buyers were even more aggressive in taking control of the price after the sellers briefly pushed it lower.
The Cup and Handle pattern is typically seen at the end of a downtrend or during a consolidation period. It is a sign that the buyers are taking control of the price and that the trend may be about to reverse.
Confirmation of the Cup and Handle Pattern
The Cup and Handle pattern is confirmed on weekly timeframe chart when the price closes above the high of the Cup and Handle candle. This indicates that the buyers are still in control of the price and that the trend is likely to reverse.
Candle Patterns:
The last candle in the chart show a bullish engulfing pattern. A bullish engulfing pattern is formed when a red candle is completely engulfed by a green candle. This is a strong bullish reversal signal that indicates that the buyers are taking control of the price.
Price Action Pattern Recognition
The Cup and Handle pattern and the bullish engulfing pattern are both bullish reversal patterns. This suggests that the price is likely to reverse and start an uptrend.
Trading the Cup and Handle Pattern
There are two ways to trade the Cup and Handle pattern:
Long Entry: Place a buy order above the high of the Cup and Handle candle.
Target: The target for the long trade is the next resistance level.
Stop Loss: The stop loss for the long trade is below the low of the Cup and Handle candle.
Conclusion
The Cup and Handle pattern is a powerful bullish reversal pattern that can be used to identify potential trading opportunities. By understanding how to recognize and trade the Cup and Handle candlestick pattern, you can improve your chances of success in the markets.
Additional Notes
It is important to note that no candlestick pattern is guaranteed to be successful. It is always important to use other forms of technical analysis and risk management techniques to protect your capital.

OBEROIRLTY BUY ABOVE 1160 LEVELS Oberoirlty Running In Upward Channel With A Good Momentum And Looks Like Continue So On With The Levels Of 1250 And Above In Short Term.
Hold Tightly

oberoi 1w buy cmp target 1078,1149,1202 riskreward 1:3oberoi 1w buy cmp target 1078,1149,1202
riskreward 1:3
sl 958

Oberoirlty - DailyDaily Chart for Education and Learning Purpose.
No Buying and Selling Recommendation on this stock.

Triangle Pattern breakdown in OBEROIRLTYOBEROI REALTY LTD
Key highlights: 💡⚡
✅On1hr Time Frame Stock Showing Breakdown of Triangle Pattern .
✅ Strong bearish Candlestick Form on this timeframe.
✅It can give movement up to the Breakdown target of 1010-.
✅Can Go short in this stock by placing a stop loss above 1110+

Oberoi Reality Bullish Breakout and RetestBULLISH BREAKOUT AND RETEST
See the price action.
Price broke out of the September 2022 all time high, went above and today retested the broken resistance as new support.
Although, today's candle is red but it is a bullish candle.
Colour of candle does not matter as much as the psychology behind that candle matters.
So, I am bullish on the stock.
Entry can be initiated above the current highs with stop loss below 1065.
Keep booking your profits and trail your stop losses.

Oberoi Realty Ltd
BREAKOUT OBSERVED
TARGETS MENTIONED IN CHART
STOPLOSS : CLOSURE BELOW TRIANGLE TREND LINE SUPPORT
Market Cap
₹ 38,551 Cr.
Current Price
₹ 1,060
Stock P/E
20.5
Book Value
₹ 336
Dividend Yield
0.38 %
ROCE
16.0 %
ROE
16.6 %
Face Value
₹ 10.0
Promoter holding
67.7 %
EPS last year
₹ 52.4
EPS latest quarter
₹ 13.2
Debt
₹ 3,944 Cr.
Pledged percentage
0.00 %
Net CF
₹ -539 Cr.
Price to Cash Flow
-16.2
Free Cash Flow
₹ -2,985 Cr.
Debt to equity
0.32
OPM last year
50.4 %
OPM 5Year
47.2 %
Reserves
₹ 11,847 Cr.
Price to book value
3.16
Int Coverage
14.0
PEG Ratio
0.63

Oberoi Reality-Nice BreakoutOberoi Reality-Nice Breakout
Capital to be deployed- 20k
Investing Price -1075-85
Breakout Price -1067
Stoploss -967
Targets -1301-1777
#oberoi #StocksInFocus #StocksToBuy #stockstowatch #stocks #StocksInNews #SwingTrading #BREAKOUTSTOCKS

Oberoi Realty on the cusp of breakout.Oberoi Realty has hit the 1000 price level multiple times on the monthly chart in the past two years. Will it break out this time?
