One Point One Sol : Rally continues surpassed the resistance ba
One Point One Sol : Rally continues surpassed the resistance band .
Next resistance is straight at 74 to 77 .
Already in a Buy trajectory
Closed above 200 SMA
( Not a Buy / Sell Recommendation
Do your own due diligence ,Market is subject to risks, This is my own view and for learning only .)
1.40 INR
331.57 M INR
2.56 B INR
81.55 M
About ONE POINT ONE SOL LTD
Sector
CEO
Akshay Gurucharanlal Chhabra
Website
Headquarters
Navi Mumbai
Founded
2008
ISIN
INE840Y01029
FIGI
BBG00JM14N79
One Point One Solutions Ltd. engages in the provision of process management services to telecommunication, banking, and financial services, travel, manufacturing, and e-commerce industries. It involves in outsourcing services which includes inbound and outbound call, back office and transaction processing, data management services and business analytics. The company was founded on May 13, 2008 and is headquartered in Navi Mumbai, India.
Related stocks

One Point One Sol : After a buy ,struggling to clear a resistancOne Point One Sol : After a buy ,struggling to clear a resistanc as seen on the chart.
Today's Hammer candle suggestive of a nice mild pull back .
(Not a Buy / Sell Recommendation
Do your own due diligence ,Market is subject to risks, This is my own view and for learning only .)

ONE POINT ONE SOL LTD bullish reversal pattern✅ Trade Setup (Swing Trade)
📌 CMP: ₹62.21
🟢 Entry (Buy Zone): ₹60–₹63
🎯 Targets:
Target 1: ₹69.80 (Fibo 0.382)
Target 2: ₹78.50 (Fibo 0.5)
Target 3: ₹87.30 (Fibo 0.618)
🛑 Stoploss: ₹55 (below wedge breakout and recent support)
⚖️ Risk-Reward Ratio:
Entry: ₹62 | SL: ₹55 | Target 1: ₹70 → ~1:1

One Point One Sol Ltd : Above 200 SMA ,in a Buy trajectory One Point One Sol Ltd : In a Buy trajectory
It just managed to stay above 200 SMA for past couple of days .
Sitting at a resistance as seen in the chart
MACD is +ve
( Not a Buy / Sell Recommendation
Do your own due diligence ,Market is subject to risks, This is my own view and for learning onl

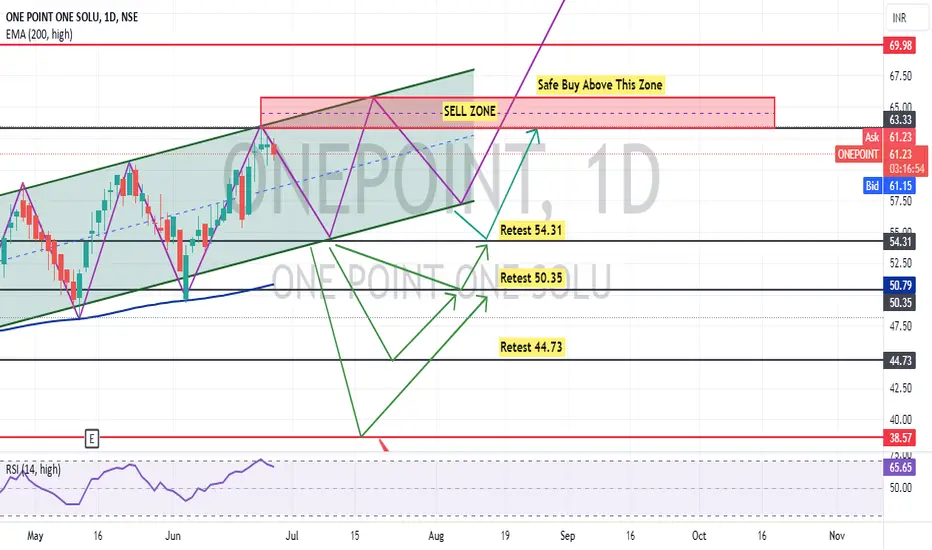
ONEPOINT - Bullish SetupStock name - One Point One Solution Limited.
Weekly chart setup
Chart is self explanatory. Levels of breakout, possible up-moves (where stock may find resistances) and support (close below which, setup will be invalidated) are clearly defined.
Master Score - B
Disclaimer: This is for demonstration

ONEPOINT - Mixed Indication - Buy with Stop Loss or Make AverageAs per previous chart history and current chart pattern, ONEPOINT is making Higher Highs in one day time frame. Soon it will give a breakout either side
You can buy this stock at current market price @61.23 and make average on every dip as shown on the chart or you can wait for a dip to enter i
One point one solution One point one solution
Buy for target 70
This recommendation is only for educational purposes


one point 2hr Time frame buy@ 64.85 target @ 69.70, 70.50 one point 2hr Time frame
buy@ 64.85 target @ 69.70, 70.50
decending triangle breakout
risk reward 1.1
its just a view trade @ your own risk
sl@59.85

Nice Chart Looks interesting Gratify if you appreciate the practice then you can like it, share it and
If you want me to investigate any chart for you then would cherish doing that for you.
Thank you for your time and support.
Stay safe.

See all ideas
Summarizing what the indicators are suggesting.
Oscillators
Neutral
SellBuy
Strong sellStrong buy
Strong sellSellNeutralBuyStrong buy
Oscillators
Neutral
SellBuy
Strong sellStrong buy
Strong sellSellNeutralBuyStrong buy
Summary
Neutral
SellBuy
Strong sellStrong buy
Strong sellSellNeutralBuyStrong buy
Summary
Neutral
SellBuy
Strong sellStrong buy
Strong sellSellNeutralBuyStrong buy
Summary
Neutral
SellBuy
Strong sellStrong buy
Strong sellSellNeutralBuyStrong buy
Moving Averages
Neutral
SellBuy
Strong sellStrong buy
Strong sellSellNeutralBuyStrong buy
Moving Averages
Neutral
SellBuy
Strong sellStrong buy
Strong sellSellNeutralBuyStrong buy
Displays a symbol's price movements over previous years to identify recurring trends.
Frequently Asked Questions
The current price of ONEPOINT is 49.03 INR — it has decreased by −0.65% in the past 24 hours. Watch ONE POINT ONE SOL LTD stock price performance more closely on the chart.
Depending on the exchange, the stock ticker may vary. For instance, on NSE exchange ONE POINT ONE SOL LTD stocks are traded under the ticker ONEPOINT.
ONEPOINT stock has fallen by −1.55% compared to the previous week, the month change is a −3.43% fall, over the last year ONE POINT ONE SOL LTD has showed a −29.97% decrease.
ONEPOINT reached its all-time high on Aug 27, 2024 with the price of 77.50 INR, and its all-time low was 0.99 INR and was reached on Dec 2, 2019. View more price dynamics on ONEPOINT chart.
See other stocks reaching their highest and lowest prices.
See other stocks reaching their highest and lowest prices.
ONEPOINT stock is 6.88% volatile and has beta coefficient of 1.07. Track ONE POINT ONE SOL LTD stock price on the chart and check out the list of the most volatile stocks — is ONE POINT ONE SOL LTD there?
Today ONE POINT ONE SOL LTD has the market capitalization of 12.87 B, it has increased by 5.24% over the last week.
Yes, you can track ONE POINT ONE SOL LTD financials in yearly and quarterly reports right on TradingView.
ONEPOINT net income for the last quarter is 87.36 M INR, while the quarter before that showed 84.33 M INR of net income which accounts for 3.59% change. Track more ONE POINT ONE SOL LTD financial stats to get the full picture.
ONE POINT ONE SOL LTD dividend yield was 0.00% in 2024, and payout ratio reached 0.00%. The year before the numbers were 0.00% and 0.00% correspondingly. See high-dividend stocks and find more opportunities for your portfolio.
EBITDA measures a company's operating performance, its growth signifies an improvement in the efficiency of a company. ONE POINT ONE SOL LTD EBITDA is 619.39 M INR, and current EBITDA margin is 24.16%. See more stats in ONE POINT ONE SOL LTD financial statements.
Like other stocks, ONEPOINT shares are traded on stock exchanges, e.g. Nasdaq, Nyse, Euronext, and the easiest way to buy them is through an online stock broker. To do this, you need to open an account and follow a broker's procedures, then start trading. You can trade ONE POINT ONE SOL LTD stock right from TradingView charts — choose your broker and connect to your account.
Investing in stocks requires a comprehensive research: you should carefully study all the available data, e.g. company's financials, related news, and its technical analysis. So ONE POINT ONE SOL LTD technincal analysis shows the sell today, and its 1 week rating is sell. Since market conditions are prone to changes, it's worth looking a bit further into the future — according to the 1 month rating ONE POINT ONE SOL LTD stock shows the neutral signal. See more of ONE POINT ONE SOL LTD technicals for a more comprehensive analysis.
If you're still not sure, try looking for inspiration in our curated watchlists.
If you're still not sure, try looking for inspiration in our curated watchlists.