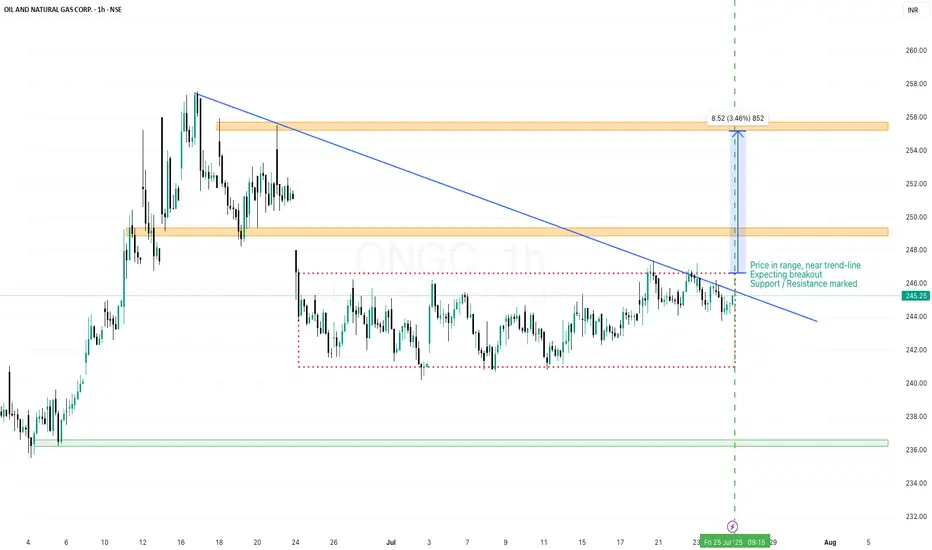
ONGC - Time to breakout from the Darvas boxONGC has been consolidating within Darvas box in recent days and nearing trend-line. We can expect breakout when trend line breaks. Nearest Support & Resistance marked for Target levels
ONGC trade ideas
ONGC BuyONGC seems to take support at its channel bottom. Buy @CMP (243.5) with SL of 240 and target of 255.

ONGC Swing Outlook Swing Trade Outlook – ONGC (Updated View)
📌 Key Levels and Observations
🔲 Major Resistance Zone:
The green zone (~₹252–₹258) has been a critical resistance area since October 2023.
Price has tested this zone multiple times but failed to close above it decisively—forming a long-term horizontal resistance.
🟢 Support Levels:
Near-term: ₹246 (support from PEMA cloud and prior reaction zone)
Stronger support: ₹240–₹232 zone (previous higher lows and EMA base)
🕯️ Candle Behavior:
The latest candles show rejection near resistance with a long upper wick, indicating supply pressure at highs.
Volumes are not spiking on this attempt—no strong breakout confirmation yet.
🎯 Trading Conclusion
Trader Type Action
Crude Oil Swing Trader Look for breakout above $78; trade long with tight SL
ONGC Investor Wait for ₹258 breakout; use dips toward ₹245 for positioning

ONGC available at fair value .. Good to BUY ONGC 239 is available at a FAIR VALUE with support 224. Fundamentally good stock and technically it could reach 290 which could give 20% return.

ONGCONGC
MTF MTF-Zone TREND MTF Analysis Logic Proximal
HTF Yearly UP ONGCYearly Demand RR 111
HTF Half-Yearly UP ONGC6 Month Demand BUFL 106
HTF Qtrly UP ONGCQtrly Demand BUFL BUFL 212
HTF Average UP 143
MTF Monthly UP ONGCMonthly Demand BUFL 212
MTF Weekly UP ONGCWeekly Demand DMIP 225
MTF Daily UP ONGCDaily Demand DMIP BUFL 235
MTF Average UP 224
ITF 240M UP ONGC240Mn Demand BUFL 235
ITF 180M UP ONGC180 Mn Demand BUFL 218
ITF 60M UP ONGC60 Mn Demand BUFL 213
ITF Average UP 222
Trade Points 196
Trade Plan BUY ONGC ENTRY-1
Entry-1 224
Entry-2 213
SL 200
RISK 24
REWARD 105
Target as per Entry 329
RR 4.4
Last High 305
Last Low 200

ONGC chart shows upside movement as price at demand zoneONGC chart shows upside movement as price at demand zone

ONGC is ready for 50% returnsONGC has fallen 30% from highs
And going down in falling down
Stock has given breakout of the channel and now currently around breakout area
Stock has huge potential to go up till 400
In a shorter term we can see 320 in days to come
Thank You !!

ONGC longOil & gas sector is outperforming and within that sector ONGC is picking up momentum.
historically in the month of Jan - Oil & energy sector performs well.
Buy above 275
Stop loss 250
target : 290/ 320

ONGC Looks good for a target of 274One can look at ONGC for an immediate target of 274 with SL at 259.
Post 274, it may touch 290

ONGC - Short the RallyAt this stage I am feeling ONGC has just made a Expanded flat on its daily time frame - Every bounce in Intraday is SHORT !!!!!!!!!!!!!!!!!!!!!!!!!!!
Beware of STOP LOSS
Alert: I follow stop loss on closing basis & my stop loss of 273-274 is on Daily Time Frame

BUY ONGC @ 264 | INTRADAY STOCK TRADE 10TH JANONGC is looking a good buy for today at 264 for the targets of 267 and 269 until 261 is intact on the downside.
To motivate us, Please like the idea If you agree with the analysis.
Happy Trading!
InvestPro India

ONGC reversal at supportIt is good to add up here as there is RSI divergence & a reversal at support
ideal SL would be,RSI closing below 30

ONGC LongTrade Plan:
Entry:
Breakout Confirmation: Enter above 265 for confirmation of sustained buying pressure.
Use smaller timeframes (e.g., 15 min or 1 hour) to confirm strong green candles with volume.
Stop Loss (SL):
Place your stop loss just below the support level at 260 to minimize risk in case of a fake breakout.
Targets:
Target 1: Aim for a 12% gain. Calculate the price level from the breakout point.
Target 2: If momentum sustains, hold for a 27% gain.
Position Sizing:
Risk no more than 1-2% of your capital on this trade.
Exit Strategy:
If the breakout fails (price closes below 264), exit immediately.
Trail your stop loss as the price approaches the targets to lock in profits.

ONGC chart analysis on daily time frameONGC chart analysis on daily time frame.
This stocks has bounced back from support zone and seems ready to go up.

LONGTrend change... RSI Positive divergence, volume surge. Has all ingredients to cook a positive story. lets how it performs

Decoding Reversals: Technical Analysis of ONGC: Educational postEDUCATIONAL POST
Technical Analysis of ONGC Stock
This post is for educational purposes only and should not be considered as investment advice.
In this post, we'll analyze the ONGC stock chart using technical indicators.
Key Points:
1. Bullish Divergence: Price and MACD are diverging, indicating a potential reversal.
2. Bullish Divergence: Price and RSI are also diverging, supporting the reversal idea.
3. Resistance Breakout: The stock has broken through a key resistance level with strong volume.
4. MACD Turns Positive: MACD has turned positive after the breakout, confirming the reversal.
5. Elliott Wave Counts: Wave counts suggest a potential reversal.
What to Expect:
Based on these indicators, we can see a potential reversal in ONGC's stock price. It may retrace to Fibonacci levels (50-61.8%) before continuing upward.
Conclusion:
This post is meant to illustrate how technical indicators can be used to analyze a stock chart. Please do your own research and consult with a financial advisor before making any investment decisions.
I am not Sebi registered analyst.
My studies are for educational purpose only.
Please Consult your financial advisor before trading or investing.
I am not responsible for any kinds of your profits and your losses.
Most investors treat trading as a hobby because they have a full-time job doing something else.
However, If you treat trading like a business, it will pay you like a business.
If you treat like a hobby, hobbies don't pay, they cost you...!
Hope this post is helpful to community
Thanks
RK💕
Disclaimer and Risk Warning.
The analysis and discussion provided on in.tradingview.com is intended for educational purposes only and should not be relied upon for trading decisions. RK_Charts is not an investment adviser and the information provided here should not be taken as professional investment advice. Before buying or selling any investments, securities, or precious metals, it is recommended that you conduct your own due diligence. RK_Charts does not share in your profits and will not take responsibility for any losses you may incur. So Please Consult your financial advisor before trading or investing.

ONGC is ready to bounce !!This is daily chart of ONGC
Stock is down almost 28% from highs
Stock is working in a rising channel and currently its around the support area
Support is coming around 230-240 levels
If stock bounce then we can see all time high in days to come
Thank You !!

buying opportunity in ONGCThis analysis is based on Dow Theory and multiple chart analysis. Buying and SL is on Hourly bases we will enter in the trade confirmed pivot of higher high. and Stop Loss will be low of Bullish Pivot and first target will be 335.60.
best of luck for trade

ONGC chart analysisONGC chart analysis on daily time frame.
This stock is at good support.
Almost seen 30% correction from top.

wait and buy @ zone - swing / intradayENTRY
- lines marked below is potential reversal zone ( PRZ)
- entry is strictly inside the zone
- look for buying confirmation in smaller time frame ( 15 minutes preferred )
EXIT
1. target
- mark fib retracement from C to latest swing low
- TGT 1 - 0.236 fib level ( intraday target )
- TGT 2 - 0.382 fib level
- TGT 3 - 0.5 fib level ( preferred target )
2. SL
- candle close below (PRZ)
- if u didn't get confirmation inside the zone , ignore this pick
- if candle close is below zone , this pattern becomes invalid . IGNORE THIS PICK
- RE-ENTRY can be done , if u again get buying confirmation inside the zone

ONGCHi guys,
In this chart i Found a Demand Zone in ONGC CHART for Positional entry,
Observed these Levels based on price action and Demand & Supply.
*Don't Take any trades based on this Picture.
... because this chart is for educational purpose only not for Buy or Sell Recommendation..
Thank you

ONGC--Support Area @250This stock is Trading near its demand and Support areas
this is a good opportunity to enter long side, Best area to invest in this stock.
It is also trading near its trendline break.
Potential targets on the upside are 350 and 400.
Keep Hold up to these target areas.

ONGCONGC
daily timeframe
i just shared my experience it is not an invite or recommendation to trade.
if youn any doubt means Please leave comments for any query.
best wishes
DYSON
