ONGC Buy for intraday tradingONGC Buy for intraday trading if stock breaks the given resistance level..........
ONGC trade ideas

ONGC Sell for intraday tradingONGC Sell for intraday trading if stock break the given resistence level.........

Short ONGC at 148Short ONGC at 148 for target of 142. approx 3 % in 2 weeks. If it breaks lower trend line then further downside possible.
ONGC view chart Government company stock
PROS
Stock is trading at 0.66 times its book value
Stock is providing a good dividend yield of 7.13%.
Company is expected to give good quarter
Company has been maintaining a healthy dividend payout of 38.3%
CONS
The company has delivered a poor sales growth of 11.7% over past five years.
Company has a low return on equity of 11.7% over last 3 years.
Contingent liabilities of Rs.76,693 Cr.
Promoter holding has decreased over last 3 years: -4.09%

ONGC is good for swing??as per nalysis ongc in good support 143 is good support and expected target 166

ONGC looks like a value buy. Oil and Natural Gas Corporation (ONGC) Ltd. is a public sector undertaking whose operations are monitored by Ministry of Operations and Natural gas, Government of India. ONGC is India’s largest government owned oil and gas explorer and producer. Its CMP is 143.75. Negatives of ONGC are such that there is a decline in quarterly net profits, decline in net cash flow and FII’s are decreasing their stake in the firm. Positives are followed by that they have no debt, book value per share is improving and MF’s are increasing their stake in the firm. Entry can be taken after closing above 145. Targets will be 154 and 166. Stop loss can be maintained at closing below 133. Dividend yield of the company at CMP is 8.2%.

ONGC swing tradeONGC is in good condition right now. After a long correction, it looks bullish and can escalate to 156-160.
NSE:ONGC

Oil & Natural Gas Corporation Ltd Long Fundamental Analysis
Oil and Natural Gas Corporation Ltd. is the largest crude oil and natural gas company in India, contributing almost seventy one percent to Indian domestic production, and is also the one of most profitable PSU in India.
Revenue Mix of the company
• Crude Oil - 70% of FY21 revenue
• Natural Gas - 17% of FY21 revenue
• Value Added Products(VAP) - 13%
VAP includes products such as LPG, Naphtha, Ethane – Propane, Butane, and superior kerosene oil. ONGC is catering 93.5% of revenue is from India and 6.5% through International Trade.
Key Data :
Stock PE Ratio 3.48
Industry PE Ratio 17.8
PB Ratio 0.67
Current Market Price INR 138
Book Value INR 206
ROE 19.50%
Dividend Yield 7.62%
High/Low 195/120
52W Index 24%
PEG Ratio 0.24
** Eye opening facts are, book value of company is INR 206 while stock is traded with stock exchange around INR 138.
** PE Ratio of stock is mere 3.48 as against Industry PE ratio of 17.8
** As per recent quarterly data, revenue is rising on quarter on quarter basis.
** Global Crude oil price is set on rise since couple of days. ONGC is one of the largest crude extraction companies as far as India is concerned. So, increase in crude price in global level favorable for ONGC.
As per Elliot Wave, stock is likely to touched INR 148 in couple of days. However with strong backing of fundamental data and global trend, stock may touched his 52 week high ( INR 195) once again in couple of days.
** I am not SEBI Registered Investor. This business analysis is for education purpose only. Your comments/suggestions are welcome.


ONGC Long Trendline BreakoutONGC good for long entry at CMP 136.5 with SL 132 and targets of 155, 167 and 200+ levels

ONGC - Supply emerged above 150 in Feb'22This was after more than 4x up from 40 in Mar'20 (to 180 in Mar'22)
Plan ahead => could consider to Buy above 150
- and/ or Rejections near 100
PB 0.7x
PE 4x
DE 0.5x
ROCE 15%
DivYld 7%

Ongc swing trade opportunity A break of structure and use increasing volume clearly indicates starting of a supplies zone.
Buy near the red horizontal line and expect a strong bull run from there

ONGC BREAK IT'S SUPPORT AND 200 EMA AND DOING RETESTONGC BREAK IT'S SUPPORT AND 200 EMA AND DOING RETEST
Target and Stoploss given

BULLISH HARMONIC PATTERN - ONGC - GREAT ENTRY !Bullish Harmonic Pattern Established, possible targets mentioned in the chart
Disclaimer - This is not a buy or sell advice. I am sharing what I see on the chat & what I am trading, based on my own knowledge & understanding. Please consult your financial advisor before taking any bets in the stock market. I will not be responsible for any profit/loss you incur on your trades based on my published ideas.


ONGC Positional view for upsideNSE:ONGC has retraced 50% on its monthly chart. My view that it can move up after some time of consolidation.
Best level to enter is 122.50-120
My upside target will be:
1st target : 139 & 2nd target: 160
Will exit if price goes below level of 113
Note: This is my personal analysis, only for learners

ONGC sell for intraday tradingONGC sell for intraday trading if stock break the given support level................


ONGC 1D TFONGC breaking the Higher high and Higher lows pattern. As the Indian markets are reversing from a important Resistance zone. We can see a good downfall in this stock for upcoming days.
We can expect the first nearby target of around 119 levels and further low can be seen in case the market falls drastically.
Trade safe. Manage risk. Be profitable.
Please follow us for more simple trading analysis and setups. Also let me know in the comment in case you have any queries.
Disclaimer :- This is just my view. Please analyze charts yourself and then decide to take any trades.

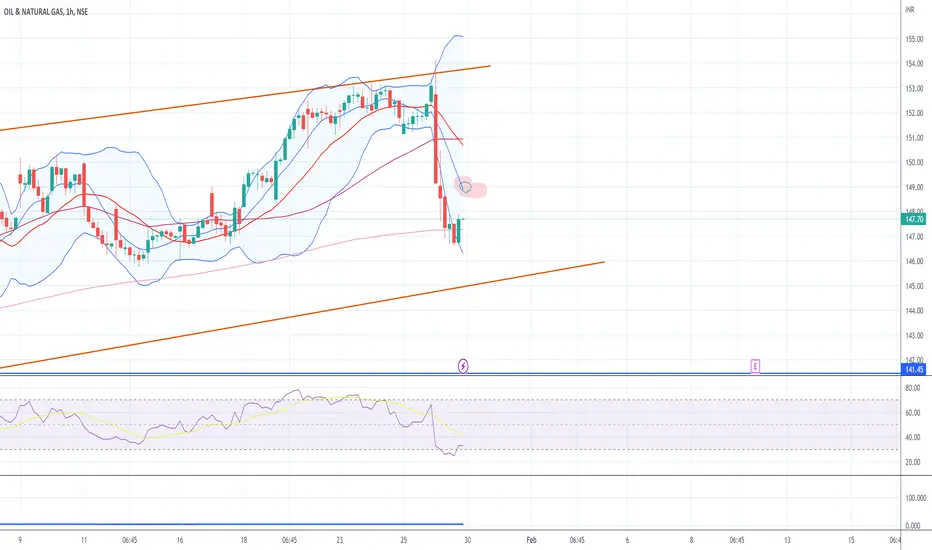
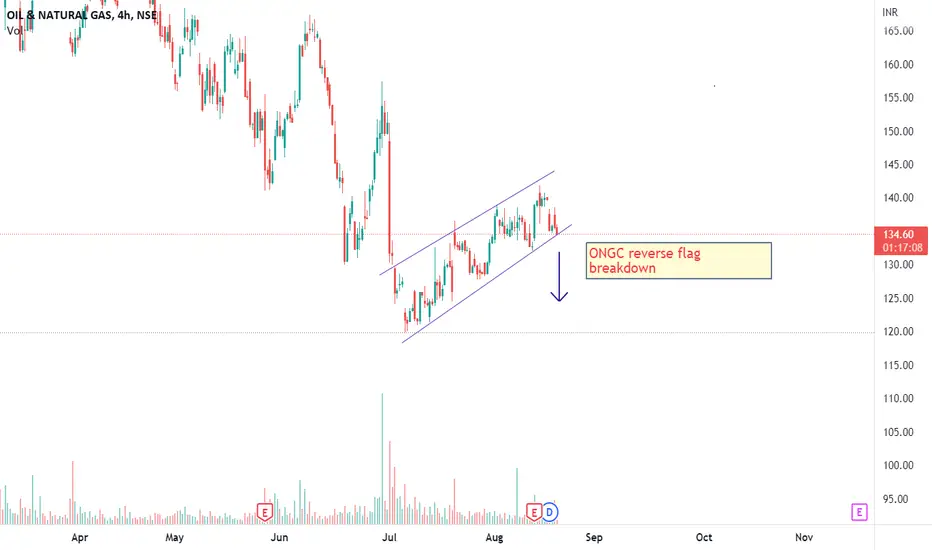
My view on ONGCONGC giving breakdown of reverse flag.Looking weak below 135.Target looking 132-130++ very soon.Also keeping on radar ONGC 135 PE
ONGC IndiaSSI Live Trading Series
Sun Storm Investment Trading Desk & NexGen Wealth Management Service Present's
Focus: Worldwide
By Sun Storm Investment Research & NexGen Wealth Management Service
A Profit & Solutions Strategy & Research
Trading | Investment | Stocks | ETF | Mutual Funds | Crypto | Bonds | Options | Dividend | Futures |
USA | Canada | UK | Germany | France | Italy | Rest of Europe | Mexico | India
Disclaimer: Sun Storm Investment and NexGen are not registered financial advisors, so please do your own research before trading & investing anything. This is information is for only research purposes not for actual trading & investing decision.
#debadipb #profitsolutions

ONGC sell for intraday tradingONGC sell for intraday trading if stock break the given support level then we will short the trade........

ONGC - Further fall possible - Windfall TAX & Falling Crude It appears that fall in ONGC will continue..
On 1st July, it was announced that taxes will be imposed on the export of petrol, diesel, and jet fuel shipped overseas by Indian companies. ONGC went down more than 15-17% within two trading sessions following this announcement. FYI- Reliance also saw more than 7-8% fall for the same reason.
There is huge Crude sell of globally - it has fallen more than 11% on 5th July. ONGC will see the impact of this as well on top of Winfall TAX.
On a chart, ONGC has broken the support trendline (weekly).. immediately heavy sell off after this. ONGC chart is also an example of failing inverse head & shoulder pattern. Also heavy call writing at 140 following 130 & 135 levels which will act as resistance for month of July.
Currently it's trading at 125, next support is at 117 and then 108 & 97. Breaking this could take it up to 86 (strong support & fib level) in near future.
LTP - 125, 117- S1, 108 - S2, 97 - S3.. 86 is a major support as per chart pattern.
Buying stocks at 108, 97 or 86 would be good idea for a long term investor though!
