Ye Chart Kuch Kehta Hai - Paradeep PhosphateWhat an amazing and clean chart this stock has got. Few perspective -
Stock Price Momentum:
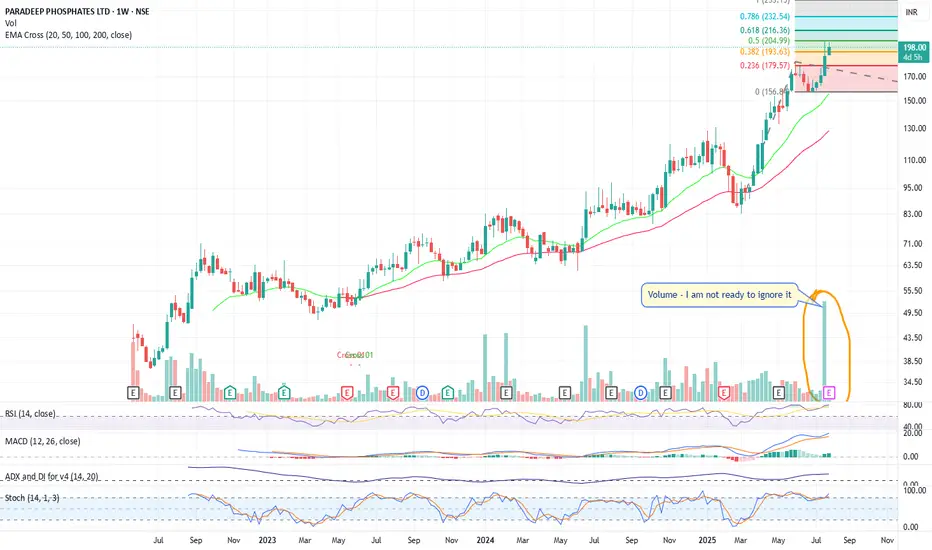
The stock is trading above its 5, 20, 50, 100, and 200-day moving averages, showing strong upward momentum.
Volume & Performance:
Past 1 month: +26.58%. Past 1 year: +125%–137%.
Outperforming the Sensex, especially in 2025.
Breakouts:
Currently consolidating between ₹190–₹205. Technical breakout above ₹205 could move it towards ₹296 in 3 months, if broader market conditions support and volumes confirm the move.
Volatility:
3.7x as volatile as Nifty, indicating high risk and high reward.
Position in Sector:
Outperformance within a strong fertilizer theme.
Business Model:
Second-largest private phosphatic fertilizer company in India, with a broad manufacturing and distribution presence.
Return Metrics:
ROCE: 13.9% | ROE: 14.4% (but 3-year average only 9.6%).
Growth:
3-year compounded sales growth: 21%.
3-year compounded profit growth: 11%.
TTM profit growth: 376% (driven by recent performance rebound).
Profitability:
Net Profit Margin (TTM): 3.99% | Gross Margin: ~26%.
Balance Sheet:
Debt/Equity: 106.5%—relatively high, though not uncommon in asset-heavy fertilizer industry.
Valuation:
PE is above market average, indicating some overvaluation vs. long-term average.
PB ratio significantly above book, dividend yield still modest.
Risks:
High volatility, cyclical earnings potential.
Returns on equity are improving but still modest for long-term holding expectations (Buffett style).
Institutional ownership and low insider ownership suggest broad investor interest, but not heavy inside conviction.
Momentum/Technical:
Positive: Strong technical momentum, recent breakouts, all moving averages showing uptrend.
Actionable: Watch for breakout above ₹205 with volume, as it may target ₹296 in 3 months.
Note: As a trend/momentum investor, position sizing and risk management are crucial due to elevated volatility and the stock’s sharp run-up.
Value/Long-Term:
Positive: Largest domestic fertilizer player, steady profit growth, improving operating margins, scale in an essential industry.
Cautious: Valuation is somewhat elevated (high PE & PB). Margins (ROE/ROCE) are decent but not exceptional. High debt and sector cyclicality are notable risks. Dividend yield is low.
Actionable: "Buy only at a fair price"—the current valuation seems a bit rich relative to its book and historical earnings multiples. Consider accumulating on dips, or if you have a very long-term horizon and conviction on sectoral tailwinds.
No investment is risk-free—conduct your own due diligence and consider your own risk appetite before making a move.
PARADEEP trade ideas
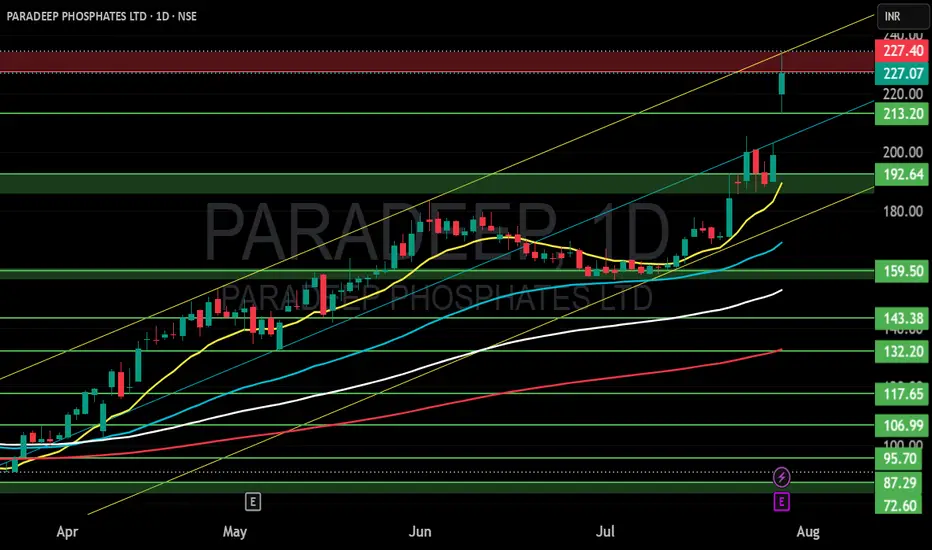
PARADEEP PHOSPHATES LTD S/RSupport and Resistance Levels:
Support Levels: These are price points (green line/shade) where a downward trend may be halted due to a concentration of buying interest. Imagine them as a safety net where buyers step in, preventing further decline.
Resistance Levels: Conversely, resistance levels (red line/shade) are where upward trends might stall due to increased selling interest. They act like a ceiling where sellers come in to push prices down.
Breakouts:
Bullish Breakout: When the price moves above resistance, it often indicates strong buying interest and the potential for a continued uptrend. Traders may view this as a signal to buy or hold.
Bearish Breakout: When the price falls below support, it can signal strong selling interest and the potential for a continued downtrend. Traders might see this as a cue to sell or avoid buying.
MA Ribbon (EMA 20, EMA 50, EMA 100, EMA 200) :
Above EMA: If the stock price is above the EMA, it suggests a potential uptrend or bullish momentum.
Below EMA: If the stock price is below the EMA, it indicates a potential downtrend or bearish momentum.
Trendline: A trendline is a straight line drawn on a chart to represent the general direction of a data point set.
Uptrend Line: Drawn by connecting the lows in an upward trend. Indicates that the price is moving higher over time. Acts as a support level, where prices tend to bounce upward.
Downtrend Line: Drawn by connecting the highs in a downward trend. Indicates that the price is moving lower over time. It acts as a resistance level, where prices tend to drop.
Disclaimer:
I am not SEBI registered. The information provided here is for learning purposes only and should not be interpreted as financial advice. Consider the broader market context and consult with a qualified financial advisor before making investment decisions.
PARADEEP Phosphates - Another Chemical Sector PlayThis stock is in exceptional momentum since the start of the year.
Another Chemicals sector Leader within its MCap.
Use every dip to accumulate.

ParadeepParadeep is approaching key resistance with momentum building—keep it on your radar as a breakout to a new ATH could be in play!
Breakout PARADEEP PHOSPHATESNSE:PARADEEP relative strength, chart pattern - wedge breakout
TGT: 121
SL: 110

Darvas Box Strategy - Break out Stock - Swing TradeDisclaimer: I am Not SEBI Registered adviser, please take advise from your financial adviser before investing in any stocks. Idea here shared is for education purpose only.
Stock has given break out. Buy above high. Keep this stock in watch list.
Buy above the High and do not forget to keep stop loss, best suitable for swing trading.
Target and Stop loss Shown on Chart. Risk to Reward Ratio/ Target Ratio 1:1
Stop loss can be Trail when it make new box / Swing.
Be Discipline, because discipline is the key to Success in Stock Market.
Trade what you See Not what you Think.

PARADEEP BREAKOUT CANDIDATE NOW READY TO SHOW STRENGTH.Nowadays chemical and fertilizers stocks are zooming... This baby doll ( 1 yr. 7 month old co.) is breaking stiff resistance 75.40 around today break and close above in daily time frame. From the last 4 candles close above 75.40 in 30 minutes chart.. Seems ready to fly for 81-90-96 when close above 96 review more for getting more ... till that can buy with sl weekly close below 65 . CMP 76.80. ( I know sl is far but target above 96 is blue sky zone)

Paradeep Phosphate : Looking Good with nice rewardThis stock is looking good for attractive risk reward.
Here you can enter at current levels also but if want you can wait for entry at 100 lelvel. But it does not look like it will touch 100 support level. If it does then buy with small SL of Rs.5
What can be better trade when SL is Rs. 5 but first target is Rs.20. That is 1:4 RR.
That is one good trade looking at past stock behaviour.
Entry : Rs. 100 or current levels
SL : Rs. 95
Target 1: Rs. 120

Darvas Box Strategy - Break out Stock - Swing TradeDisclaimer: I am Not SEBI Registered adviser, please take advise from your financial adviser before investing in any stocks. Idea here shared is for education purpose only.
Stock has given break out. Buy above high. Keep this stock in watch list.
Buy above the High and do not forget to keep stop loss, best suitable for swing trading.
Target and Stop loss Shown on Chart. Risk to Reward Ratio/ Target Ratio 1:2
Stop loss can be Trail when it make new box / Swing.
Be Discipline, because discipline is the key to Success in Stock Market.
Trade what you See Not what you Think.
Please check the Fundamental of the COMPANY before investing as Penny Stock are Easy to Manipulate.

PARADEEP1. Anything can happen.
2. You don't need to know what is going to happen next in order to make money.
3. There is a random distribution between wins and losses for any given set of variables that define an edge. No other thoughts
4. An edge is nothing more than an indication of a higher probability of one thing happening over another.
5. Every moment in the market is unique.

PARADEEP PHOSPHATES S/R Support and Resistance Levels:
Support Levels: These are price points (green line/shade) where a downward trend may be halted due to a concentration of buying interest. Imagine them as a safety net where buyers step in, preventing further decline.
Resistance Levels: Conversely, resistance levels (red line/shade) are where upward trends might stall due to increased selling interest. They act like a ceiling where sellers come in to push prices down.
Breakouts:
Bullish Breakout: When the price moves above resistance, it often indicates strong buying interest and the potential for a continued uptrend. Traders may view this as a signal to buy or hold.
Bearish Breakout: When the price falls below support, it can signal strong selling interest and the potential for a continued downtrend. Traders might see this as a cue to sell or avoid buying.
20 EMA (Exponential Moving Average):
Above 20 EMA(50 EMA): If the stock price is above the 20 EMA, it suggests a potential uptrend or bullish momentum.
Below 20 EMA: If the stock price is below the 20 EMA, it indicates a potential downtrend or bearish momentum.
Trendline: A trendline is a straight line drawn on a chart to represent the general direction of a data point set.
Uptrend Line: Drawn by connecting the lows in an upward trend. Indicates that the price is moving higher over time. Acts as a support level, where prices tend to bounce upward.
Downtrend Line: Drawn by connecting the highs in a downward trend. Indicates that the price is moving lower over time. It acts as a resistance level, where prices tend to drop.
RSI: RSI readings greater than the 70 level are overbought territory, and RSI readings lower than the 30 level are considered oversold territory.
Combining RSI with Support and Resistance:
Support Level: This is a price level where a stock tends to find buying interest, preventing it from falling further. If RSI is showing an oversold condition (below 30) and the price is near or at a strong support level, it could be a good buy signal.
Resistance Level: This is a price level where a stock tends to find selling interest, preventing it from rising further. If RSI is showing an overbought condition (above 70) and the price is near or at a strong resistance level, it could be a signal to sell or short the asset.
Disclaimer:
I am not a SEBI registered. The information provided here is for learning purposes only and should not be interpreted as financial advice. Consider the broader market context and consult with a qualified financial advisor before making investment decisions.

Pradeep Phosphate - Daily Up UP weekly Gapup SUndayPradeep Phosphate - Daily Up UP weekly Gapup SUnday
1) Lovely pattern
2) Expect 3x
3) Lets see

PRADEEP PHOSPHATEClear double bottom confirmation of weekly time frame. Followed by awsome volume.
followed by 20 MA on weekly time frame.
SL 67 for positional trade.
TARGET ON TRAILING BASES
it has gud potential for upside . Follow strict SL & Proper RISK REWARD RATIO. This is the only holy grail in the market.

Pradeep phosphate buy buy buyPradeep phosphate buy buy buy..
Have patience and enjoy the profit.........

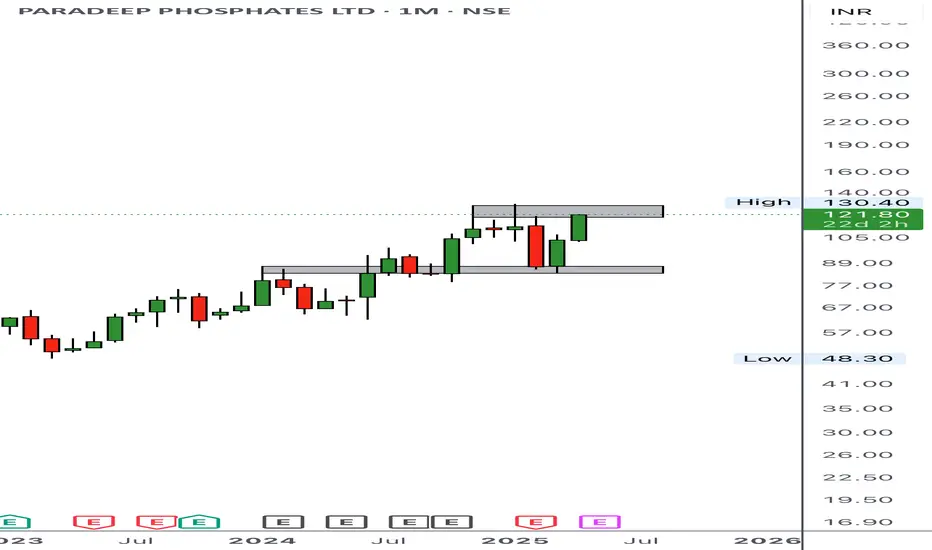
ParadeepStock name = Paradeep Phosphates Limited.
Weekly chart setup
Chart is self explanatory. Levels of breakout, possible up-moves (where stock may find resistances) and support (close below which, setup will be invalidated) are clearly defined.
Disclaimer: This is for demonstration and educational purpose only. this is not buying and selling recommendations. I am not SEBI registered. please consult your financial advisor before taking any trade.

Pradeep These are swing ideas which you can add your watchlist and analysis for yourself !
Keep on your radar!
This I am not sebi ragister I


Paradeep Phosphate if you missed it earlier it is not too late.Paradeep Phosphates Ltd. CMP – 66.10
Market Capitalization Rs 5,385.4Cr
Red Flags:🟥
High Valuation (P.E. = 33.7)
Declining annual net profit
Declining cash from operations annual
Promoter Holding decreasing
Green Flags:🟩
Low debt
Zero promoter pledge
FIIs are increasing stake
MFs are increasing stake
Previous Happy Candles Number – 35/100
New Happy Candles Number – 50/100
Fresh Entry/ averaging / compounding after closing above 67
Targets: 69 and 71
Long term target: 73 and 75
Stop loss: Closing below 58
The above information is provided for educational purpose, analysis and paper trading only. Please don't treat this as a buy or sell recommendation for the stock. We do not guarantee any success in highly volatile market or otherwise. Stock market investment is subject to market risks which include global and regional risks. We will not be responsible for any Profit or loss that may occur due to any financial decision taken based on any data provided in this message.

ATH BREAK OUT IN PRADEEP PHOSPHATEGoing to ready for run after crossing all time high. it has reached after at ATH with gud volume. buy on this price sl will be 68


$PARADEEP ready for a breakout to ATH ?NSE:PARADEEP ready for a breakout to ATH ?
the breakout has completed its retest and is it ready for a new ATH ?

Paradeep phosphate 82 Target 🎯
These are swing idea's which you can add your watchlist and analysis for yourself.
Keep on radar.
Potential upside stock!
