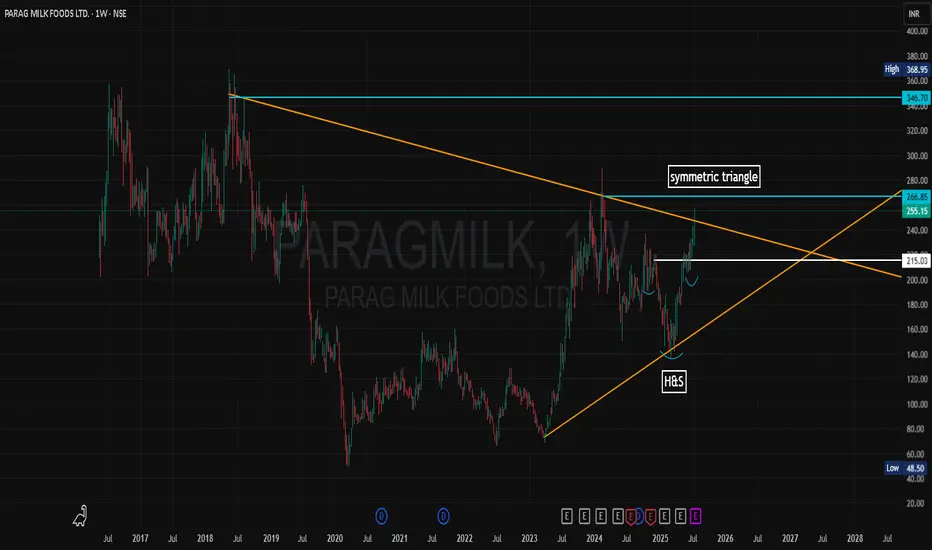
parag milk weekly time framesymetrical triangle bo on wtf ....
sl below 215
1tgt 266+
2tgt 346+
3tgt 440+
PARAGMILK trade ideas
Amazing breakout on WEEKLY Timeframe - PARAGMILKCheckout an amazing breakout happened in the stock in Weekly timeframe, macroscopically seen in Daily timeframe. Having a great favor that the stock might be bullish expecting a staggering returns of minimum 25% TGT. IMPORTANT BREAKOUT LEVELS ARE ALWAYS RESPECTED!
NOTE for learners: Place the breakout levels as per the chart shared and track it yourself to get amazed!!
#No complicated chart patterns
#No big big indicators
#No Excel sheet or number magics
TRADE IDEA: WAIT FOR THE STOCK TO BREAKOUT IN WEEKLY TIMEFRAME ABOVE THIS LEVEL.
Checkout an amazing breakout happened in the stock in Weekly timeframe.
Breakouts happening in longer timeframe is way more powerful than the breakouts seen in Daily timeframe. You can blindly invest once the weekly candle closes above the breakout line and stay invested forever. Also these stocks breakouts are lifelong predictions, it means technically these breakouts happen giving more returns in the longer runs. Hence, even when the scrip makes a loss of 10% / 20% / 30% / 50%, the stock will regain and turn around. Once they again enter the same breakout level, they will flyyyyyyyyyyyy like a ROCKET if held in the portfolio in the longer run.
Time makes money, GREEDY & EGO will not make money.
Also, magically these breakouts tend to prove that the companies turn around and fundamentally becoming strong. Also the magic happens when more diversification is done in various sectors under various scripts with equal money invested in each N500 scripts.
The real deal is when to purchase and where to purchase the stock. That is where Breakout study comes into play.
Check this stock which has made an all time low and high chances that it makes a "V" shaped recovery.
> Taking support at last years support or breakout level
> High chances that it reverses from this point.
> Volume dried up badly in last few months / days.
> Very high suspicion based analysis and not based on chart patterns / candle patterns deeply.
> VALUABLE STOCK AVAILABLE AT A DISCOUNTED PRICE
> OPPURTUNITY TO ACCUMULATE ADEQUATE QUANTITY
> MARKET AFTER A CORRECTION / PANIC FALL TO MAKE GOOD INVESTMENT
DISCLAIMER : This is just for educational purpose. This type of analysis is equivalent to catching a falling knife. If you are a warrior, you throw all the knives back else you will be sorrow if it hits SL. Make sure to do your analysis well. This type of analysis only suits high risks investor and whose is willing to throw all the knives above irrespective of any sectoral rotation. BE VERY CAUTIOUS AS IT IS EXTREME BOTTOM FISHING.
HOWEVER, THIS IS HOW MULTIBAGGERS ARE CAUGHT !
STOCK IS AT RIGHT PE / RIGHT EVALUATION / MORE ROAD TO GROW / CORRECTED IV / EXCELLENT BOOKS / USING MARKET CRASH AS AN OPPURTUNITY / EPS AT SKY.
LET'S PUMP IN SOME MONEY AND REVOLUTIONIZE THE NATION'S ECONOMY!

PARAGMILK BullishFLAG&POLE 3Y4M BObon DTF/WTF SWING/POSITIONALSTOCK Analysis
TRADE PLAN
ENTRY -211/220
SL -195
TARGET --01-263 , TGT02--354
Hold For a Year or TGT 2
Chart Pattern :
STOCK has recently broken out STRONG of a Flag Pattern on the DTF/WTF.
INDICATORS EMA :
The Price is Currently Trading above 20EMA, 50 EMA is lower than 200EMA in DTF. 20 EMA Has just crossed over the 50 and 200EMA indicating a Bullish Trend.
STOCK EMAs are currently in process of aligning in a ascending order, indicating a transition from a Bearish Short Tem trend to bullish Trend on DTF/WTF.
FIBO E :
Marking the FIBO Retracement on the Last Downtrend , The Prices has crossed 50% FIBO Retracement Level TODAY , with ChoCH at 192 on DTF and 211 on WTF..
Volumes: There is a uptrend in Volume on the Weekly Charts for 3 Weeks after the 32 weeks Retracement from the 11Months Bullish Streak.
Keep in your Priority Watch List
Disclaimer: For Education/Reference Purpose Only, Trade at your Own Risk with correct position sizing and SL based on your Risk apetite (Exit when price closes 7to8% below your Entry).
Trail Your SL progressively. Learn/Know and Review the Stock trading Technical Terminology. Check Verify the Financial fundamentals of the Stock and Seek Advice from a Certified Financial Advisor prior to Investing. Prefer Entry with 25% quantity, Add in Tranches of 25%-50% as prices moves upwards recommended.
MTFA- Multiple Time Frame Analysis
DTF -Daily Time Frame
WTF-Weekly Time Frame
MTF- Monthly Time Frame
ATH-All Time High
LTH -LifeTime High
RBC&H-Rounding Bottom Cup/Handle
BO- Breakout Close
EMA -Exponential Moving Average
FIBO R/E -Trend based Fibonacci Retracement/Extension
SL Stop Loss
TBD- To be Decided
CHoCH- Change of Character Bullish/Bearish
MSB/BOS -Break Out Structure
FVG Fair Value Gap
20VMA -20Volume Moving Average
SWING/POSITIONAL Trade

Technical Analysis of PARAG Milk Foods Ltd (PARAGMILK)Technical Analysis of PARAG Milk Foods Ltd (PARAGMILK)
Overview of the Stock - The chart shows a 1-hour timeframe chart of PARAG Milk Foods Ltd (PARAGMILK) on the National Stock Exchange (NSE) of India. The ticker symbol for the stock is "PARAGMILK."
Key Observations - Price Action : The stock price has been in a relatively sideways trend, fluctuating between support and resistance levels.
Support and Resistance:
Support: The 0.382 Fibonacci retracement level at around 204.61 and the 0.618 level at around 208.37 are potential support levels. The 200.00 level also acted as support in the past.
Resistance: The 1.618 Fibonacci extension level at around 227.00 and the 2.618 level at around 230.07 are potential resistance levels.
Moving Averages: The 20-period and 50-period moving averages are currently below the price, indicating a potential bullish bias. However, the price is not far above these averages, suggesting that the uptrend may be fragile.
Bollinger Bands: The price is currently trading near the upper Bollinger Band, indicating a potential overbought condition. A pullback towards the middle band or lower band could be expected.
Relative Strength Index (RSI): The RSI is currently above 50, suggesting a bullish momentum. However, it is not significantly overbought, indicating that the uptrend may have room to run.
Potential Scenarios
Breakout: If the price breaks above the 1.618 Fibonacci extension level, it could signal a bullish breakout. The next target would be the 2.618 level.
Pullback: If the price pulls back from the current levels, it could find support at the 0.382 or 0.618 Fibonacci retracement levels. A break below these levels could signal a bearish trend.
Sideways Consolidation: The price may continue to consolidate between the support and resistance levels, creating a trading range.
Conclusion - PARAG Milk Foods Ltd is currently in a sideways trend, with potential for both upside and downside movement. Traders and investors should monitor the price action closely, especially around the key support and resistance levels. A breakout above the 1.618 Fibonacci extension level could signal a bullish trend, while a break below the 0.382 or 0.618 retracement levels could indicate a bearish trend.
Warning Note: This analysis is based on the provided chart and does not consider other factors that may influence the stock price, such as news, economic indicators, and company fundamentals.
Disclaimer:- This analysis is based on the provided chart and is for informational purposes only. It does not constitute financial advice. Always consult with a financial advisor before making investment decisions. Do your own research before buying this stock because I am not SEBI registered person and this is just for educational purposes. We are not responsible for your loss.
Thanks for your support as always

BUY PARAG MILK & FOODSStock moved today above 200EMA. Parag Milk Foods has demonstrated strong financial performance and strategic growth initiatives, positioning itself for continued success in the dairy and FMCG sector


PARAGMILK Long Target 250 Timeframe 2-3 monthsPARAGMILK Long Target 250 Timeframe 2-3 months
It has formed a strong base at 193 to 195 levels and bounces off to upside target of 250 in 2 to 3 months

Parag Milk Foods is looking bullishPARAGMILK is looking bullish on 75 mins time frame. It would be a good swing trade.
Monthly and weekly RSI is above 60, and daily RSI takes support on 50.
The trend has been up since the last few months. The stock has been corrected recently and started making higher highs and lows. A swing trade with RRR above three can be taken if the trend continues. The stop loss can be a recent low or the previous low. If you observe price action closely & compare it with RSI, there is a slight sign of "Positive Reverse Divergence" (RSI making lower lows and price making higher highs).

NSE:PARAG Parag milk - time to milk 🥛Time to milk? 🥛 #paragmilk NSE:PARAGMILK
Disc: Invested , first trance with tight stoploss
#investing #trading #pwinvest

#PARAGMILK - Seems to be a nice buy at current levels#PARAGMILK
Seems to be a nice buy at current levels.
Consolidation near support and back inside the old parallel channel.
Forming higher lows and higher highs on lower timeframes. I think this eventually goes to new ATH in coming months.
Buying here at CMP i.e. $217.90 with SL of ₹187 and Targets of 234-268-317-357
#DoYourOwnResearch before investing

paragmilk bullparag milk showing good quarterly result and also strong on charts as all daily , weekly and monthly rsi is positive. also do your analysis

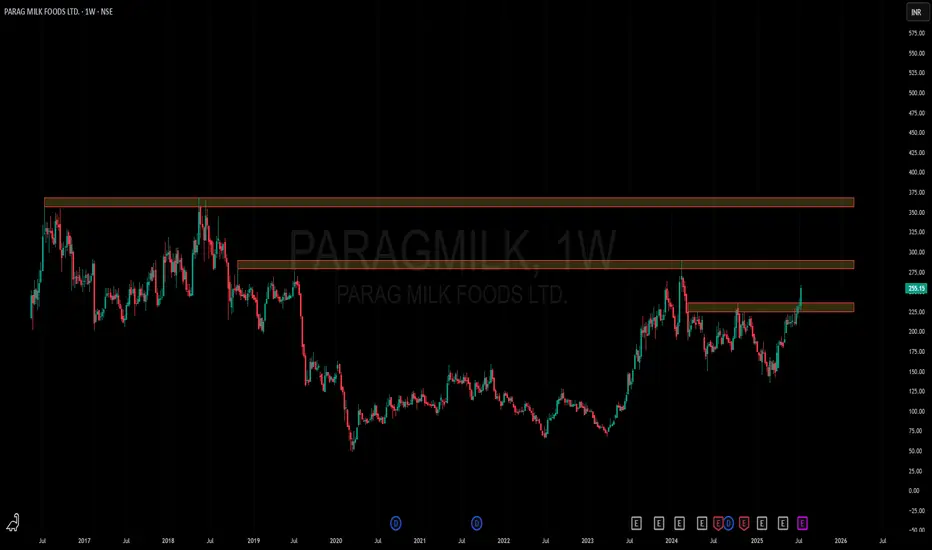
Long term BreakoutThe stock has broken a 4 year downtrend with 7x volumes. Buy ar 112 for a short term target of 158/198/344

Consolidation broke After long consolidation
Here Clearly can see the break-out of resistance level
Before try to break multiple time , but failed to break.
Volumes and price action is good
Buy on pullback or retest structure.
Target is huge like dodala dairy one can see.
I'm sharing for educational only

Resistance BreakoutPlease look into the chart for a detailed understanding.
Consider these for short-term & swing trades with 2% profit.
For BTST trades consider booking
target for 1% - 2%
Please consider these ideas for educational purpose
Comment below if you are looking for any answers

PARAG MILK FOODS - 240 MINS TIME FRAMEThe Structure looks good to us, waiting for this instrument to correct and then give us these opportunities as shown on this instrument (Price Chart).
Note: Its my view only and its for educational purpose only. Only who has got knowledge about this strategy, will understand what to be done on this setup. its purely based on my technical analysis only (strategies). we don't focus on the short term moves, we look for only for Bullish or Bearish Impulsive moves on the setups after a good price action is formed as per the strategy. we never get into corrective moves. because it will test our patience and also it will be a bullish or a bearish trap. and try trade the big moves.
we do not get into bullish or bearish traps. We anticipate and get into only big bullish or bearish moves (Impulsive Moves). Just ride the Bullish or Bearish Impulsive Move. Learn & Know the Complete Market Cycle.
Buy Low and Sell High Concept. Buy at Cheaper Price and Sell at Expensive Price.
Keep it simple, keep it Unique.
please keep your comments useful & respectful.
Thanks for your support....
Tradelikemee Academy

PARAGMILK Swing Trade SetupThis will be my personal trade Setup, This is not an advice of any kind to initiate trade according to this setup. This is for only for my learning purpose and maintaining my trading journal.
PARAGMILK is in downtrend from 2018 and Forming Descending Triangle and broke trendline resistance with good volume.
CMP is 112.30
Nearby Support is at 98.
Nearby Resistance is at 128.
Not Defining any targets or SL just posting views of stock charts which are looking good for trade setups.
Always do your analysis and trust your own analysis.

PARAGMILK : Stock AnalysisPARAGMILK declining
Weekly: its declining since many weeks and making LH LL pattern
Daily : Tried to go up but after forming double top its rejected and now trading near resistance zone. its trading in triangle pattern.
Hourly : Formed mother candle and now trading inside it. whenever break UP/Down side its good to enter trade.
Our daily zone is near 88-92 and can go till 126-130 if able to break up side. So best R:R.
Study at your end this is just my personal view and it can be wrong 100%
Like, Share, Comment for regular updates.
Disclaimer
I am not sebi registered analyst
My studies are Educational purpose only
Please consult with your Financial advisor before trading or investing
First Learn and then remove "L"

PARAG MILK AND FOODDo you own analysis before investing
Stock want to Bull 🐂
Only for educational purposes

breakout after long term consolidation and now at strong supportA turnaround company can be multi-bagger as improving Cash Flow and Reserves.


