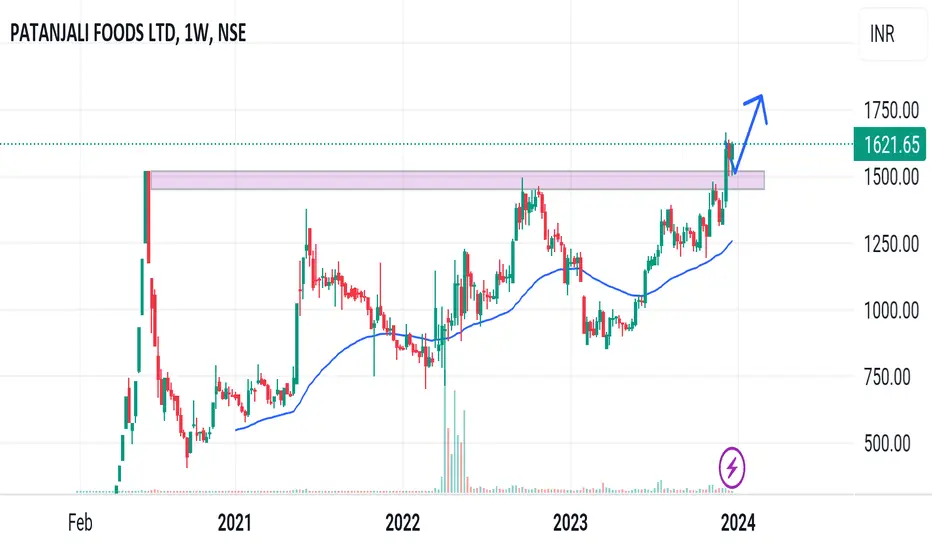
Patanjali Foods: A Potential Reversal Brewing Near Demand Zone?The price has now retraced back into a key value zone between 1,610 - 1,635, which has previously acted as a strong base. This zone also coincides with high volume activity on the visible range volume profile - suggesting accumulation interest.
Technically, the stock is near the 0% Fibonacci extension with multiple confluences of past support and volume, forming a potential base.
If this holds, look for retracement targets:
• First bounce zone: ₹1,687 (50% Fib)
• Further recovery: ₹1,745–₹1,775 (Fib 61.8–78.6%)
Long-term: ₹1,861 (161.8% Fib extension), ₹2,016 (261.8%)
Fundamentals Snapshot:
• Market Cap: ~₹58,000 Cr
• P/E: ~34x | P/B: ~3.8x
• Promoter Holding: 80.82% (No pledging)
• Debt-to-Equity: ~0.25
• ROCE: ~13.2% | ROE: ~10.4%
• FII Holding: 3.6%, DII Holding: 6.3%
Patanjali’s brand strength in edible oils, packaged foods, and growing FMCG integration offers secular demand visibility. The recent correction seems sentiment-driven, not structural.
Keep in Focus:
A decisive close above 1,660 could indicate a short-term reversal.
This chart is for educational use only and not a buy/sell recommendation.
PATANJALI trade ideas

PATANJALI | Buy if Close above 1910 with Strict SL below 1800 | Disclaimer:
This is not financial advice. Please do your own research or consult with a financial advisor before making any investment decisions. Investments in stocks can be risky and may result in loss of capital.

Patanjali - The Dark Horse?Patanjali showed resilience while the broader market was deep in the red.
Its downside was relatively limited.
However, today, the stock suddenly dropped 10%, hitting the lower circuit.
It's attempting a recovery and remains in a decisive zone.
The price structure still looks promising for now.
What’s your take on this?
Disclaimer: This analysis is purely for educational purposes and does not constitute trading advice. I am not a SEBI-registered advisor, and trading involves significant risk. Please consult with a financial advisor before making any investment decisions.

"Channel Pattern" **|| Patanjali Foods Ltd||**
* 4 Year Consolidation touched on resistance multiple times trend line Year Oct-2020 TO July-24. and given Morning star Breakout in weekly Candle closing.
* Expected To reach at the next level. Price level - 4500

PATANJALI FOODS S/RSupport and Resistance Levels:
Support Levels: These are price points (green line/shade) where a downward trend may be halted due to a concentration of buying interest. Imagine them as a safety net where buyers step in, preventing further decline.
Resistance Levels: Conversely, resistance levels (red line/shade) are where upward trends might stall due to increased selling interest. They act like a ceiling where sellers come in to push prices down.
Breakouts:
Bullish Breakout: When the price moves above resistance, it often indicates strong buying interest and the potential for a continued uptrend. Traders may view this as a signal to buy or hold.
Bearish Breakout: When the price falls below support, it can signal strong selling interest and the potential for a continued downtrend. Traders might see this as a cue to sell or avoid buying.
20 EMA (Exponential Moving Average):
Above 20 EMA(50 EMA): If the stock price is above the 20 EMA, it suggests a potential uptrend or bullish momentum.
Below 20 EMA: If the stock price is below the 20 EMA, it indicates a potential downtrend or bearish momentum.
Trendline: A trendline is a straight line drawn on a chart to represent the general direction of a data point set.
Uptrend Line: Drawn by connecting the lows in an upward trend. Indicates that the price is moving higher over time. Acts as a support level, where prices tend to bounce upward.
Downtrend Line: Drawn by connecting the highs in a downward trend. Indicates that the price is moving lower over time. It acts as a resistance level, where prices tend to drop.
RSI: RSI readings greater than the 70 level are overbought territory, and RSI readings lower than the 30 level are considered oversold territory.
Combining RSI with Support and Resistance:
Support Level: This is a price level where a stock tends to find buying interest, preventing it from falling further. If RSI is showing an oversold condition (below 30) and the price is near or at a strong support level, it could be a good buy signal.
Resistance Level: This is a price level where a stock tends to find selling interest, preventing it from rising further. If RSI is showing an overbought condition (above 70) and the price is near or at a strong resistance level, it could be a signal to sell or short the asset.
Disclaimer:
I am not a SEBI registered. The information provided here is for learning purposes only and should not be interpreted as financial advice. Consider the broader market context and consult with a qualified financial advisor before making investment decisions.

PatanjaliIs the Storm Over ??
Or More Selling is to Come along ??
When will new BS /PL will be there ??
No Recommendation. Just watch it !!

PATANJALI All Targets Done and Dusted!Nice move in Patanjali caught.
All 4 targets met. Closed 50% position and holding the remaining 50%
Trailing stop loss at 1768
Enjoy the ride! ;)

CUP & HANDLE break out in Patanjali Food Ltd given CUP & Handle Pattern breakout with good volume ,Can give good return from here

Patanjali Foods Ltd: Bullish Breakout with Strong VolumePatanjali Foods Ltd has demonstrated a significant bullish breakout supported by strong volume. The ascending trend line confirms the upward momentum. This breakout signals potential for further upward movement, as indicated by the strong buying interest and RSI close to the overbought zone.

Patanjali on 4hrs good bullish viewAs per technical we have market both the sides. But market going up towards our direction so stay tuned guyz for updates like this

PATANJALILook out for Patanjali, this stock is breaking out, if it cross the 1,520rs, then it is good to buy for short term, additionally this move nice in favour of ruling party.
if you get benifited from this, feed a small portion to poor.
am not a SEBI register adviser, this is only my view

Patanjali Foods Limited at resistancePFL has formed a long-term Flag pattern and has reached a resistance level. A breach of this resistance shall entail a rise in price level by another INR 1000 from current levels. Let us keep track of it.
#patanjalifoodsltd #patanjalifoods #patanjali #patanjalitechnicalstudy #patanjaliflagpattern #patanjalipricelevel #patanjalipricetarget

PATANJALI Likely to hit all targets within 1 weekPATANJALI gave a clear entry on April 16, good breakout with volume.
Has hit our 3rd target so far and is likely to hit all targets in a weeks time.

Patanjali for uptrend Patanjali we can expect to see in upside upto 2600 Rs from current price. Current monthly trend for Ascending Triangle pattern breakout, Current price 1600 Rs, Target 2650 Rs and Stop loss 1100 Rs

Patanjali baba ka stock Looks good as it has crossed its all time high and is staying above it
might take one or two days to confirm its new trend
definitely will give a good long uptrend if we can get a green candle tomorrow.
Hoping for a uptrend in it.

Patanjali ready to FLY !!!!Hello All,
I am glad you have liked my post and I am sure everyone who have traded on these post would have made profits.
Sorry, I was banned by the moderators for not following the house rules ... But here I am back again :-)
Patanjali ready to FLY ... Forming Cup and Handle have charted down Patanjali Movement ....
If you like my Idea, Don't forget to Boost and comment on my Analysis.. The recommendations are purely for educational purpose only, consult you financial advisor before trading.
Gautam Khanna
Technical Analyst by Passion :-)

Breakout in PATANJALI FOODS.PATANJALI FOODS giving a breakout of its all time high. after making ascending triangle pattern. Consolidated for a long time and finally gave a breakout maybe because of the latest investors meet. the company is under regulatory investigation so be cautious. just good to observe and learn the price behaviour.


PATANJALI SWING TRADE IDEAPATANJALI ready to break its all time high look abv 1520 to play for swing with ur RR.

PATANJALI follow FAB. point I personally follow patanjali last few months that share hold multiple setup but pure shot on fab points
1. hold triple top on monthly
2. same triple top on weekly on H4
3 .Range breakout
4. perfect take support on fab. 0.5 point
5. upper fab point is very exited
hope for the best in negative sentiment market.

High Risk and High PE Stock Patanjali Foods looking Positive. Patanjali Foods is one of the leading FMCG (Fast Moving Consumer Goods) player in India for producer and marketer of range of healthy edible oils and pioneer of Soya food products . The company owns 22 manufacturing plants that gives a strength of manufacturing and packaging 11000 tones material per day. It also one of the largest palm plantation company in India.
Patanjali Foods CMP is 1144.50. Negative aspects of the company are high valuation (P.E. = 46.7) and MFs are decreasing stake. Positive aspects of the company are improving annual net profits, no debt, improving cash from operations, FIIs are increasing stake and zero promoter pledge.
Entry after closing above 1152. Targets in the stock will be 1231 and 1297. Long term target in the stock will be 1370. Stop loss in the stock should be maintained at closing below 1000.

Patanjali Foods is going to be explode soonHere in Patanjali Foods, we can see that price action is headed towards a narrow range and soon it will be explode either ways. One can be accumulate this share with the following target (but only after breakout from Rs 970 level)
1st target - Rs 1000
2nd target - Rs 1031
Stop Loss - Rs 930
Enjoy your Trade well and be profitable with short targets in Share market.
