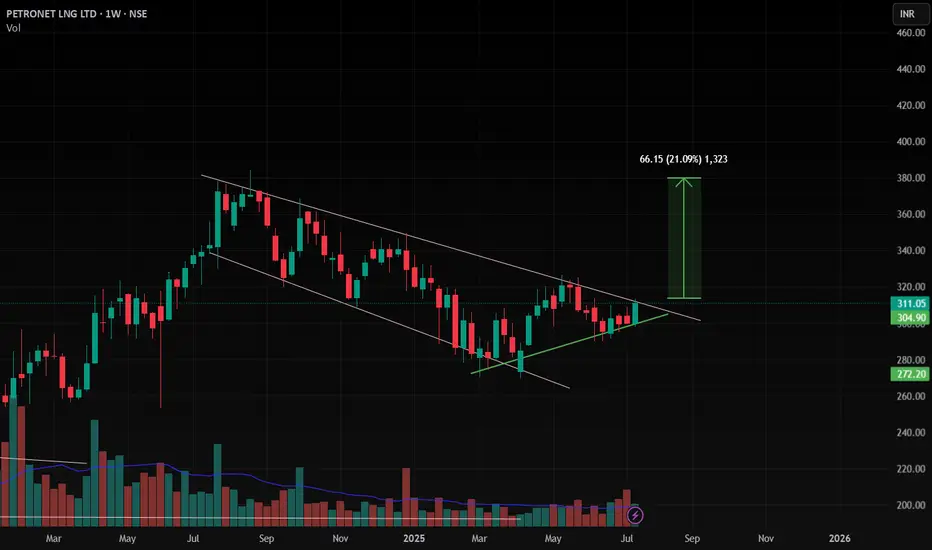
Petronet , 1W , BullishAs the Pattern is Formed and Ready for Breakout , enter after strong candle close in weekly Timeframe and put SL below Swing low . follow proper risk management
follow for more swing ideas like this
PETRONET trade ideas
Pteronet Lng bullish Pole and FlagEntry- 303-304
Support- 298-300
Target- 310, 312, 315
Pattern- Bullish Pole N Flag in 1hr Time Frame and a bullish engulfing candlestick.
Disclaimer- This is just for educational purpose please take advice from you own financial advisor before making any decision.
Note- Market sentiment is bearish. Focus on fundamentally strong oversold stocks which have corrected 50 percent or more.
Jai Shree Ram

Petronet LNGBuy on Condition
1. RSI above 56
2. OBV & PVT give Breakout.
Stop Loss - 333
TGT 1 - 365
TGT 2 - 383
TGT 3 - 430
I am not SEBI Registered.

Cup and Handle Breakout in PETRONETPETRONET has formed a classic Cup and Handle pattern on the hourly chart, signaling a potential bullish breakout.
Pattern Breakdown:
Cup Formation: A smooth rounding bottom from ₹310 to ₹337, indicating strong accumulation.
Handle Formation: A slight retracement near ₹330, forming a consolidation zone before the breakout.
Indicators:
RSI: Currently above 70, showing bullish momentum.
Volume: Increased significantly, confirming buying pressure.
Key Levels:
Breakout Level: ₹337
The price has broken above this resistance, confirming the breakout.
Targets:
Target 1: ₹350
Target 2: ₹360
Stop-Loss: Below ₹330 (handle low).
💡 Disclaimer: This is for educational purposes and not financial advice. Please perform your due diligence before entering any trade.

Petronet - Falling wedgePetronet after breakout and runup, consolidating and ready for a good run up now.
Making falling wedge and ready for a new run.

PETRONET Bullish Flag Buy Bullish flag formed in petronet in 30 mins chart. stock expected to touch 356 as target.

$PETRONET 7R will it work ?NSE:PETRONET 7R will it work ? will the upper liquidity be taken first to trigger a larget sell off?

SWING IDEA - PETRONET LNGThis presents an attractive opportunity for swing traders to capitalize on the potential uptrend in Petronet LNG .
Reasons are listed below :
Breakout of Strong Resistance at 300 : Petronet LNG has successfully broken above a significant resistance level at 300, signaling potential bullish momentum.
Bullish Marubozu Candle on Weekly Timeframe : The presence of a bullish Marubozu candlestick pattern on the weekly timeframe suggests strong buying momentum and potential upward movement.
Breakout from 6+ Years of Consolidation : The stock has broken out from a consolidation phase lasting over 6 years, indicating a significant shift in market sentiment and potential for sustained upward movement.
Trading Above 50 and 200 EMA : Petronet LNG is trading above both the 50 and 200 Exponential Moving Averages (EMA), confirming bullish bias and indicating potential for trend continuation.
Support from 0.382 Fibonacci Level : Finding support at the 0.382 Fibonacci level and bouncing back reinforces the bullish outlook and provides a solid foundation for potential upward movement.
Trading at All-Time High (ATH) : Petronet LNG is trading at its all-time high, indicating strong bullish momentum and potential for further gains.
Constant Higher Highs : The stock consistently forms higher highs, reflecting increasing bullish momentum and reinforcing the potential for further gains.
Target - 340 // 380
Stoploss - weekly close below 260
DISCLAIMER -
Decisions to buy, sell, hold or trade in securities, commodities and other investments involve risk and are best made based on the advice of qualified financial professionals. Any trading in securities or other investments involves a risk of substantial losses. The practice of "Day Trading" involves particularly high risks and can cause you to lose substantial sums of money. Before undertaking any trading program, you should consult a qualified financial professional. Please consider carefully whether such trading is suitable for you in light of your financial condition and ability to bear financial risks. Under no circumstances shall we be liable for any loss or damage you or anyone else incurs as a result of any trading or investment activity that you or anyone else engages in based on any information or material you receive through TradingView or our services.
@visionary.growth.insights

Darvas Box Strategy - Breakout Stock.Disclaimer: I am Not SEBI Register adviser, please take advise from your financial adviser before investing in any stocks.
Stock has given break out buy above the High and do not forget to keep stop loss best suitable for swing trading. Keep this stock in watch list.
Target and Stop loss Shown on Chart.
Be Discipline, because discipline is the key to Success in Stock Market.
Trade what you See Not what you Think.

PETRONET LNG LTD S/RSupport and Resistance Levels:
Support Levels: These are price points (green line/share) where a downward trend may be halted due to a concentration of buying interest. Imagine them as a safety net where buyers step in, preventing further decline.
Resistance Levels: Conversely, resistance levels (red line/shade) are where upward trends might stall due to increased selling interest. They act like a ceiling where sellers come in to push prices down.
Breakouts:
Bullish Breakout: When the price moves above resistance, it often indicates strong buying interest and the potential for a continued uptrend. Traders may view this as a signal to buy or hold.
Bearish Breakout: When the price falls below support, it can signal strong selling interest and the potential for a continued downtrend. Traders might see this as a cue to sell or avoid buying.
20 EMA (Exponential Moving Average):
Above 20 EMA: If the stock price is above the 20 EMA, it suggests a potential uptrend or bullish momentum.
Below 20 EMA: If the stock price is below the 20 EMA, it indicates a potential downtrend or bearish momentum.
Trendline: A trendline is a straight line drawn on a chart to represent the general direction of a data point set.
Uptrend Line: Drawn by connecting the lows in an upward trend. Indicates that the price is moving higher over time. Acts as a support level, where prices tend to bounce upward.
Downtrend Line: Drawn by connecting the highs in a downward trend. Indicates that the price is moving lower over time. It acts as a resistance level, where prices tend to drop.
RSI: RSI readings greater than the 70 level are overbought territory, and RSI readings lower than the 30 level are considered oversold territory.
Combining RSI with Support and Resistance:
Support Level: This is a price level where a stock tends to find buying interest, preventing it from falling further. If RSI is showing an oversold condition (below 30) and the price is near or at a strong support level, it could be a good buy signal.
Resistance Level: This is a price level where a stock tends to find selling interest, preventing it from rising further. If RSI is showing an overbought condition (above 70) and the price is near or at a strong resistance level, it could be a signal to sell or short the asset.
Disclaimer:
I am not a SEBI registered. The information provided here is for learning purposes only and should not be interpreted as financial advice. Consider the broader market context and consult with a qualified financial advisor before making investment decisions.

PETRONET- AnalysisBullish Levels -Day closing above (early entry-risky) 305 or 344 safe entry above 373
Long term major expected targets :- 879 or 952 and may be 1025
Intermittency targets :- 445, 518, 59, 664, 737, 810,
Bearish Level - Below 287 then 258 then 224 then 188 below this more bearish
*Comment or message me if you wish to see my analysis for any stocks.
**Disclaimer -
I am not a SEBI registered analyst or advisor. I does not represent or endorse the accuracy or reliability of any information, conversation, or content. Stock trading is inherently risky and the users agree to assume complete and full responsibility for the outcomes of all trading decisions that they make, including but not limited to loss of capital. None of these communications should be construed as an offer to buy or sell securities, nor advice to do so. The users understands and acknowledges that there is a very high risk involved in trading securities. By using this information, the user agrees that use of this information is entirely at their own risk.
Thank you.

Petronet setting up for a good entryPetronet has been setting up for a good entry on the 240 mins chart. The election results have forced the price to correct from higher levels. Would be nice to get a retracement into the demand zone for a good entry

Petronet LNG19/05/2024
Petronet LNG on Monthly chart
CMP: 313.50
Target : 405
SL: 290
Information is only for study Purpose

Petronet has been refueled!Petronet has completed its 60 months cycle and is ready for the next ride

PETRONET LNGThis stock breakout nearly 5 years consolidation level with huge volume
and this is only for educational purpose

Multiyear range breakout petronet lng has given multi year breakout in monthly chart. New all time high has been formed and price action also show range breakout. In daily time frame also there is W pattern breakout and it has also retested that level. In coming months we can see good up move in this stock.

Petronet all time high breakout Please consult your financial advisor before any investment we are not sebi registered this is only chart learning purpose..

Strong Buy Petronet cmp 214, target 300, Timeframe 1 month.Petronet is into developing, designing, construction, operation of owned and import Liquified Natural Gas(LNG) terminals in India.
The company is in the niche business of transportation, storage and regasification of LNG. It owns and operates 2 regasification terminals at Dahej (Gujarat) and Kochi (Kerala) with a combined capacity of 22.5 MMTPA. It accounts for 40% of gas supplies in the country and handles ~75% of LNG imports in India. The company's major customers are GAIL, IOCL and BPCL.
Petronet LNG has pioneered the concept of consumption of LNG as liquid ONLY in long distance heavy duty trucks and inter city buses. Small Scale LNG (SSLNG) includes supply of natural gas in the form of LNG to small consumers through unconventional transportation methods like trucks, small vessels etc
Petronet is taking initiatives for promoting environment friendly LNG as a fuel in road transportation. It has commissioned India's first LNG dispenser stations inside Dahej & Kochi LNG terminals and has also commissioned the first commercially approved LNG powered buses of the Country.It has signed MOU's with IOCL, Indraprastha Gas Limited, Sabarmati Gas Limited, State Roadways Corporation like KSRTC for running few buses on LNG and establishing LNG dispensing stations at their locations.
Petronet LNG is planning for construction of LNG regasification terminal at Bangladesh. It has submitted detailed feasibility report for construction of storage and gasification terminal in South Andaman. Similarly it is planning for setting up a Floating storage & regasification terminal at Colombo, Sri Lanka along with Japanese consortium.
Petronet is planning for expansion of the capacities at Dahej Terminal to 22.5 MMTPA from the current 17.5 MMTPA.
Key Ratios:
ROCE - 26.6 %
ROE - 22.8 %
EPS - ₹ 22.7
Dividend Yield - 3.27 %
Debt to equity - 0.20
Price to book value - 2.00
Stock P/E - 9.44
Industry PE - 18.1
Conclusion:
With such a high ROCE and good dividend yield, Petronet is just trading at PE of 9.44 which is considerably undervalued as compared to Industry PE of 18. Technically the stock is poised to give a sharp movement upside as it started rising from strong support zone which is a double bottom pattern and the trend bullish structure is intact. Earlier the breakout of trendline is acting as as support. Trendline connecting lows was taken out for a few days only to grab a liquidity and exit weak hand and to retest strong support levels and from there it has risen sharply with high volumes and it iss again above lower trendline indicating a sharp reversal and good momentum to follow in coming days. The target expected is 300 in timeframe of 1 month which comes to 40% return in just 1 month.

petronet lngpetronet is ready to blast from inverse head and shoulder pattern . We have a target of 410-420

Petronet Crosses All time highSo... Petronet just crossed its all time high and that is exactly one of the 2 things I trade - All time high and Patterns so count me in the trade

PETRONET- Mulityear Resistance Breakout Stock Name- PETRONET
Mulityear Resistance Breakout
Weekly Time Frame
Holding period - 6 to 12 months
Potential Upside Stock
Good Dividend History
Disclaimer: This is for demonstration and educational purpose only. this is not buying and selling recommendations. I am not SEBI registered. please consult your financial advisor before taking any trade.

PETRONET LONGPrice close above the zone in 4H TF.
Target 242 ,254 Short term.
Disclaimer : This is not a Buy or Sell recommendation. Please consult your financial advisor before making any investments . This is for Educational purpose only

short term1) short-term target
2) target and stop loss mentioned in chart
3) no recommendation fir buy and sell
4) All-time high
5) how where marjet mood stock can move
6) be careful.
