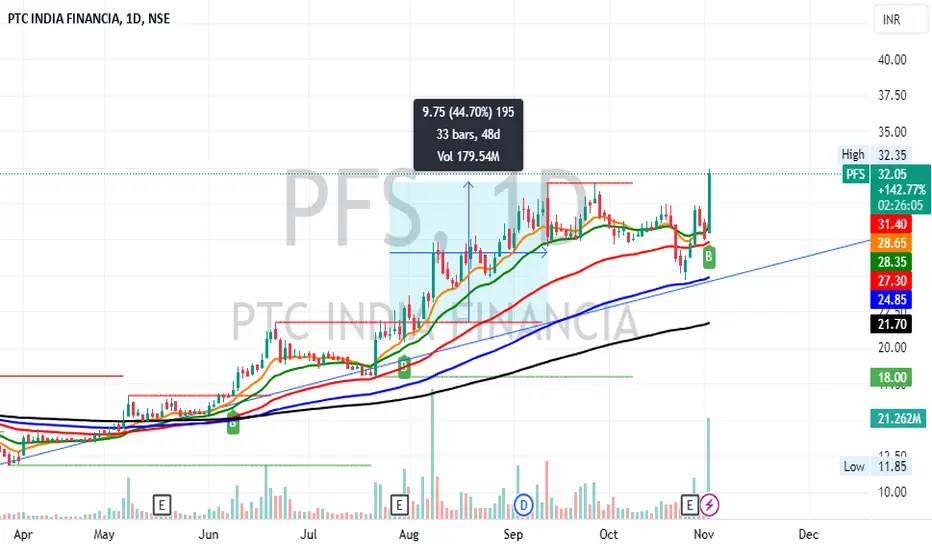
SWING IDEA - PFSStock NSE:PFS has had a MACD crossover in the weekly timeframe. This could indicate the stock to start going up in the coming weeks.
Although keep note of the Market sentiments this week, as it could impact this stock's movement too.
If all is well, this could go up all the way until its Swing Hi
4.82 INR
2.17 B INR
6.33 B INR
224.83 M
About PTC INDIA FIN SERV LTD
Sector
Industry
CEO
Rangachari Balaji
Website
Headquarters
New Delhi
Founded
2006
ISIN
INE560K01014
FIGI
BBG001CMKS38
PTC India Financial Services Ltd. engages in the provision of total financing solutions to the energy value chain. The firm is also involved in investing in equity or extending debt to road infrastructure projects and power projects in generation, transmission, distribution, fuel resources, and fuel related infrastructure. The company was founded on September 8, 2006 and is headquartered in New Delhi, India.
Related stocks


PFS BREAKOUT Here is my chart for PFS. The stock has given an EMA contraption and is starting to breakout. I have attached my technical analysis targets here. however, the stock may extend and go beyond that. I have entered in at 45.55. Follow along if you may. No buy sell reco NSE:PFS

PFS - Ichimoku BreakoutStock Name - Ptc India Financial Services Limited
Ichimoku Cloud Setup :
1). Today's close is above the Conversion Line
2). Future Kumo is Turning Bullish
3). Chikou span is slanting upwards
All these parameters are showing bullishness at Current Market Price
and more bullishness AFTER crossing

PFS Stock Price is Approaching the next big hit The Stock price of PFS is approaching the immediate first target of Rs 31. Above this bullish hurdle, this stock price can be a next bit thing until the next resistance of 70 range as per the Harmonic pattern.

PFS for swing trade A good consolidation can be seen after a good move, a good breakout can give atleast 15% from the breakout level. keep watch. Also on daily timframe its a massive breakout, one can buy at retest levels. Its a flag pole pattern on daily tf.
Buy - 33 and above ( swing )
- 29 ( short term )

PTC India 1 year support line PTC India 1 year support line and 200 sma support good opportunity but wait for confirmation

PTC INDIA BREAKOUTNSE:PFS has a good price action structure. It was consolidating in a bullish ascending triangle pattern from which it broke out and gave huge momentum.
Volumes are the highest since 52 weeks. A good sign of strength.
Similar to Adani green, I expect some sort of retrace in the coming days to mak


See all ideas
Summarizing what the indicators are suggesting.
Oscillators
Neutral
SellBuy
Strong sellStrong buy
Strong sellSellNeutralBuyStrong buy
Oscillators
Neutral
SellBuy
Strong sellStrong buy
Strong sellSellNeutralBuyStrong buy
Summary
Neutral
SellBuy
Strong sellStrong buy
Strong sellSellNeutralBuyStrong buy
Summary
Neutral
SellBuy
Strong sellStrong buy
Strong sellSellNeutralBuyStrong buy
Summary
Neutral
SellBuy
Strong sellStrong buy
Strong sellSellNeutralBuyStrong buy
Moving Averages
Neutral
SellBuy
Strong sellStrong buy
Strong sellSellNeutralBuyStrong buy
Moving Averages
Neutral
SellBuy
Strong sellStrong buy
Strong sellSellNeutralBuyStrong buy
Displays a symbol's price movements over previous years to identify recurring trends.
Frequently Asked Questions
The current price of PFS is 38.07 INR — it has decreased by −0.76% in the past 24 hours. Watch PTC INDIA FIN SERV LTD stock price performance more closely on the chart.
Depending on the exchange, the stock ticker may vary. For instance, on NSE exchange PTC INDIA FIN SERV LTD stocks are traded under the ticker PFS.
PFS stock has fallen by −8.49% compared to the previous week, the month change is a −6.00% fall, over the last year PTC INDIA FIN SERV LTD has showed a −28.56% decrease.
PFS stock is 3.28% volatile and has beta coefficient of 1.67. Track PTC INDIA FIN SERV LTD stock price on the chart and check out the list of the most volatile stocks — is PTC INDIA FIN SERV LTD there?
Today PTC INDIA FIN SERV LTD has the market capitalization of 24.47 B, it has decreased by −4.34% over the last week.
Yes, you can track PTC INDIA FIN SERV LTD financials in yearly and quarterly reports right on TradingView.
PFS net income for the last quarter is 1.37 B INR, while the quarter before that showed 581.60 M INR of net income which accounts for 134.92% change. Track more PTC INDIA FIN SERV LTD financial stats to get the full picture.
PTC INDIA FIN SERV LTD dividend yield was 0.00% in 2024, and payout ratio reached 0.00%. The year before the numbers were 0.00% and 0.00% correspondingly. See high-dividend stocks and find more opportunities for your portfolio.
As of Aug 9, 2025, the company has 58 employees. See our rating of the largest employees — is PTC INDIA FIN SERV LTD on this list?
EBITDA measures a company's operating performance, its growth signifies an improvement in the efficiency of a company. PTC INDIA FIN SERV LTD EBITDA is 2.75 B INR, and current EBITDA margin is 94.83%. See more stats in PTC INDIA FIN SERV LTD financial statements.
Like other stocks, PFS shares are traded on stock exchanges, e.g. Nasdaq, Nyse, Euronext, and the easiest way to buy them is through an online stock broker. To do this, you need to open an account and follow a broker's procedures, then start trading. You can trade PTC INDIA FIN SERV LTD stock right from TradingView charts — choose your broker and connect to your account.
Investing in stocks requires a comprehensive research: you should carefully study all the available data, e.g. company's financials, related news, and its technical analysis. So PTC INDIA FIN SERV LTD technincal analysis shows the sell today, and its 1 week rating is sell. Since market conditions are prone to changes, it's worth looking a bit further into the future — according to the 1 month rating PTC INDIA FIN SERV LTD stock shows the neutral signal. See more of PTC INDIA FIN SERV LTD technicals for a more comprehensive analysis.
If you're still not sure, try looking for inspiration in our curated watchlists.
If you're still not sure, try looking for inspiration in our curated watchlists.