PGEL trade ideas
PGEL ANALYSIS: WAIT FOR RIGHT MOMENT FOR HUGE GAINSThanks for stopping by.
All analysis here is done strictly from an investor’s perspective — focusing on risk, return, valuation, and potential upside.
The notes cover key details. I’ve backed every thesis with my own analysis — no fluff, just what matters to investors.
If you find the idea useful or have suggestions, feel free to leave a comment. Always open to fresh insights.
Kind regards,
Psycho Trader
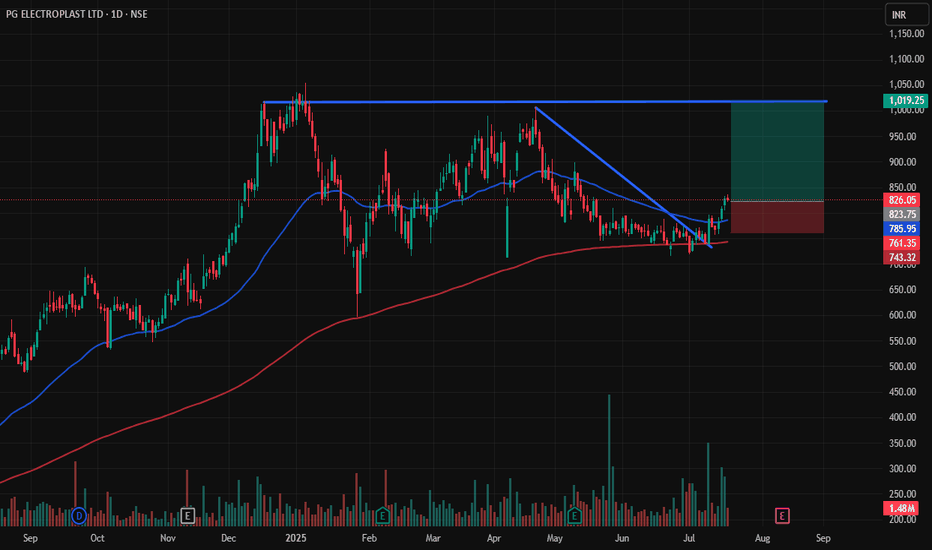
PG ELECTROPLAST LTD🚀 PG ELECTROPLAST LTD (NSE) - VCP Breakout Incoming? 🚀
📈 Volatility Contraction Pattern (VCP) in action!
💥 Stock testing resistance near 52WH
✅ RS Rating: 91.0 | Alpha Signal: BUY
📊 Strong base formation—momentum building for the next leg up!
Is this the next breakout opportunity? Let’s discuss! 👇🔥
#VCP #Breakout #Trading #PGEL #StockMarket
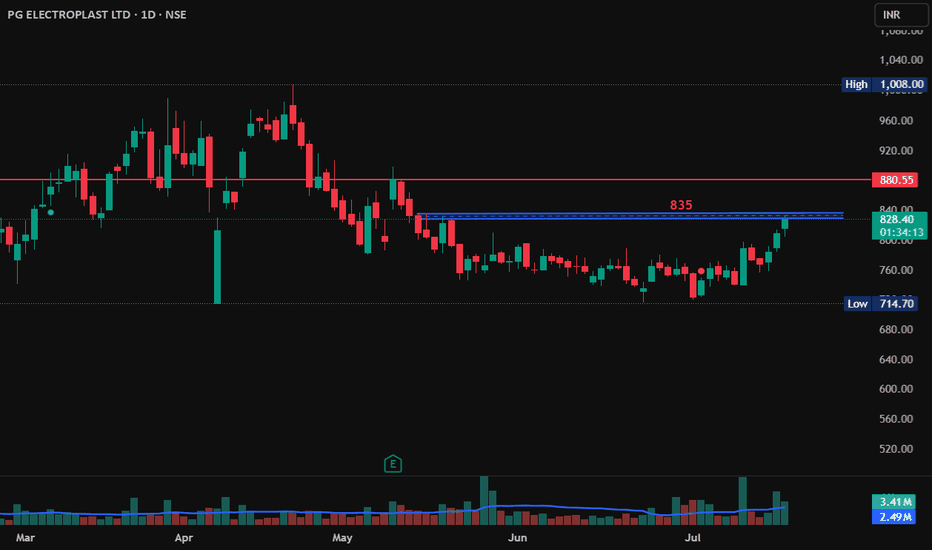
PG ELECTROPLAST LTD S/RSupport and Resistance Levels:
Support Levels: These are price points (green line/shade) where a downward trend may be halted due to a concentration of buying interest. Imagine them as a safety net where buyers step in, preventing further decline.
Resistance Levels: Conversely, resistance levels (red line/shade) are where upward trends might stall due to increased selling interest. They act like a ceiling where sellers come in to push prices down.
Breakouts:
Bullish Breakout: When the price moves above resistance, it often indicates strong buying interest and the potential for a continued uptrend. Traders may view this as a signal to buy or hold.
Bearish Breakout: When the price falls below support, it can signal strong selling interest and the potential for a continued downtrend. Traders might see this as a cue to sell or avoid buying.
20 EMA (Exponential Moving Average):
Above 20 EMA(50 EMA): If the stock price is above the 20 EMA, it suggests a potential uptrend or bullish momentum.
Below 20 EMA: If the stock price is below the 20 EMA, it indicates a potential downtrend or bearish momentum.
Trendline: A trendline is a straight line drawn on a chart to represent the general direction of a data point set.
Uptrend Line: Drawn by connecting the lows in an upward trend. Indicates that the price is moving higher over time. Acts as a support level, where prices tend to bounce upward.
Downtrend Line: Drawn by connecting the highs in a downward trend. Indicates that the price is moving lower over time. It acts as a resistance level, where prices tend to drop.
RSI: RSI readings greater than the 70 level are overbought territory, and RSI readings lower than the 30 level are considered oversold territory.
Combining RSI with Support and Resistance:
Support Level: This is a price level where a stock tends to find buying interest, preventing it from falling further. If RSI is showing an oversold condition (below 30) and the price is near or at a strong support level, it could be a good buy signal.
Resistance Level: This is a price level where a stock tends to find selling interest, preventing it from rising further. If RSI is showing an overbought condition (above 70) and the price is near or at a strong resistance level, it could be a signal to sell or short the asset.
Disclaimer:
I am not a SEBI registered. The information provided here is for learning purposes only and should not be interpreted as financial advice. Consider the broader market context and consult with a qualified financial advisor before making investment decisions.
MIC Electronics: A Comprehensive Analysis for Investors**Company Overview**
MIC Electronics Limited, a pioneering company in the design, development, and manufacturing of LED video displays and high-end electronic equipment, has been a significant player in the industry since 1988. With a strong focus on innovation and quality, the company has established itself as a leader in true color display technology and has even received RDSO approval for its railway coach lighting products.
**Financial Growth and Performance**
Revenue and Profitability
MIC Electronics has shown remarkable financial growth in recent years. For the fiscal year 2023-24, the company reported a total revenue of `5656.61 Lakhs, a substantial increase from the previous year's `779.75 Lakhs. This growth is largely driven by the company's success in securing significant orders, particularly from Indian Railways for Passenger Information System (PIS) displays, which contributed `4549.90 Lakhs to the revenue.
The net profit for FY 2023-24 stood at `6183.88 Lakhs, a significant jump from the previous year's `14.56 Lakhs. This impressive profit growth is a testament to the company's efficient operations and strategic business decisions.
Historical Financial Performance
Historically, MIC Electronics has demonstrated robust revenue and profit growth. The company's annual revenue growth has been impressive, with a 3-year CAGR of 269% and a 5-year CAGR of 62%. The net profit has also seen substantial growth, with a 3-year CAGR of 130% and a 5-year CAGR of 32%.
Value and Ratios Analysis
**Key Financial Ratios**
1. **Price to Earnings (P/E) Ratio:**
- The P/E ratio of MIC Electronics stands at 31.43, indicating that the stock is trading at a premium but still within reasonable valuations considering its growth trajectory.
2. **Return on Equity (ROE):**
- The company's ROE for the year ending March 31, 2024, was 50.7%, outperforming its 5-year average of 33.93%. This high ROE indicates efficient use of shareholder equity to generate profits.
3. **Return on Assets (ROA):**
- The ROA of 72.77% highlights the company's ability to generate profits from its assets, reflecting strong operational efficiency.
4. **Debt to Equity Ratio:**
- With a debt to equity ratio of 0.18, MIC Electronics maintains a healthy capital structure with low debt levels.
5. **Current Ratio:**
- The current ratio of 3.32 indicates that the company has sufficient short-term assets to cover its short-term liabilities, ensuring liquidity and stability.
Technical Analysis
Price Action and Trends
- **Current Price:** The stock is currently trading at around `81.62, with a 52-week high of `99.94 and a 52-week low of `22.85.
- **Short-Term Trends:** The stock has shown significant growth in the past year, with a 1-year return of 163.53%.
- **Support and Resistance:** Key support levels include `70 and `60, while resistance levels are around `90 and `100.
Technical Indicators
1. **Moving Averages:**
- The 50-day moving average is above the 200-day moving average, indicating a bullish trend.
- The Relative Strength Index (RSI) is around 50, suggesting that the stock is neither overbought nor oversold.
2. **Volume Analysis:**
- Trading volumes have been increasing, which is a positive sign for the stock's momentum.
Potential Support and Resistance
**Support Levels:**
1. **`70:** This level has acted as a strong support in the past and is likely to provide support again if the stock corrects.
2. **`60:** A psychological support level that could attract buyers if the stock falls to this range.
**Resistance Levels:**
1. **`90:** A significant resistance level that the stock needs to break through to continue its upward trend.
2. **`100:** The 52-week high, which could act as a strong resistance if the stock reaches this level again.
Conclusion
MIC Electronics Limited has demonstrated impressive financial growth, driven by its strong performance in securing and executing significant orders. The company's financial ratios indicate healthy operational efficiency and a robust capital structure. From a technical perspective, the stock shows a bullish trend with potential support and resistance levels that investors should monitor.
Investment Strategy:
- **Long-term Investors:** Given the company's strong financial performance and growth prospects, long-term investors can consider MIC Electronics as a promising addition to their portfolio.
- **Short-term Traders:** For short-term traders, buying on dips around the support levels of `70 and `60 could be a good strategy, with a target to break through the resistance levels of `90 and `100.
**Disclaimer:**
This analysis is for informational purposes only and should not be considered as investment advice. Always conduct thorough research and consult with a financial advisor before making any investment decisions.
PG ELECTROPLAST BTST TRADENSE:PGEL broke out from a rising channel pattern on hourly timeframe. Price is currently consolidating after the breakout. A BTST(Buy today sell tomorrow) trade can be taken in view of price hitting upper circuit tomorrow.
Another bullish sign is the fake breakdown price gave from this pattern.
Volumes looks good. Daily chart is also very bullish. Enter at C.M.P, stoploss below the channel pattern, below 770 levels.
Follow strict risk management. HAPPY TRADING!


