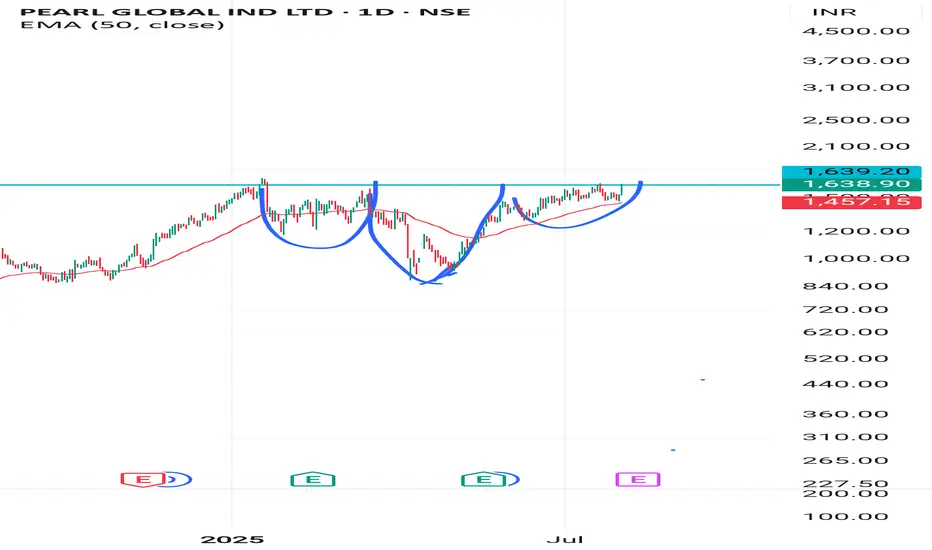
PGIL IS FORMING HEAD AND SHOULDER IN DAILY CANDLE ANALYSISAfter a long consolidation and up and downs , a bullish pattern is formed and ready to breake the neck line.
Above neckline
Target 1 1999.
Target 2 2349
PGIL trade ideas
earl global next target 5000Pearl Global (PGIL)
One of the cleanest cup formations of the year.
CMP ₹1,400 — targeting ₹5,000 in 2 years.
Institutions are entering quietly.
Will you wait for the breakout or lead before it’s obvious?
#StockMarket #BreakoutStocks #PGIL #CupAndHandle #Multibag

PGIL CMP 1350. (Swing with strict stoploss)PGIL Multibagger till covid with strong fundamentals.Consistent frofit generartor every year.Now in correction on hourly candels making a range.With higher lows it indicate strenth in price again.Now we can see this for a swing trade with strict stoploss.

PEARL GLOBEL IND LTD S/RSupport and Resistance Levels:
Support Levels: These are price points (green line/shade) where a downward trend may be halted due to a concentration of buying interest. Imagine them as a safety net where buyers step in, preventing further decline.
Resistance Levels: Conversely, resistance levels (red line/shade) are where upward trends might stall due to increased selling interest. They act like a ceiling where sellers come in to push prices down.
Breakouts:
Bullish Breakout: When the price moves above resistance, it often indicates strong buying interest and the potential for a continued uptrend. Traders may view this as a signal to buy or hold.
Bearish Breakout: When the price falls below support, it can signal strong selling interest and the potential for a continued downtrend. Traders might see this as a cue to sell or avoid buying.
MA Ribbon (EMA 20, EMA 50, EMA 100, EMA 200) :
Above EMA: If the stock price is above the EMA, it suggests a potential uptrend or bullish momentum.
Below EMA: If the stock price is below the EMA, it indicates a potential downtrend or bearish momentum.
Trendline: A trendline is a straight line drawn on a chart to represent the general direction of a data point set.
Uptrend Line: Drawn by connecting the lows in an upward trend. Indicates that the price is moving higher over time. Acts as a support level, where prices tend to bounce upward.
Downtrend Line: Drawn by connecting the highs in a downward trend. Indicates that the price is moving lower over time. It acts as a resistance level, where prices tend to drop.
Disclaimer:
I am not a SEBI registered. The information provided here is for learning purposes only and should not be interpreted as financial advice. Consider the broader market context and consult with a qualified financial advisor before making investment decisions.

PGIL S/R Support and Resistance Levels:
Support Levels: These are price points (green line/shade) where a downward trend may be halted due to a concentration of buying interest. Imagine them as a safety net where buyers step in, preventing further decline.
Resistance Levels: Conversely, resistance levels (red line/shade) are where upward trends might stall due to increased selling interest. They act like a ceiling where sellers come in to push prices down.
Breakouts:
Bullish Breakout: When the price moves above resistance, it often indicates strong buying interest and the potential for a continued uptrend. Traders may view this as a signal to buy or hold.
Bearish Breakout: When the price falls below support, it can signal strong selling interest and the potential for a continued downtrend. Traders might see this as a cue to sell or avoid buying.
20 EMA (Exponential Moving Average):
Above 20 EMA(50 EMA): If the stock price is above the 20 EMA, it suggests a potential uptrend or bullish momentum.
Below 20 EMA: If the stock price is below the 20 EMA, it indicates a potential downtrend or bearish momentum.
Trendline: A trendline is a straight line drawn on a chart to represent the general direction of a data point set.
Uptrend Line: Drawn by connecting the lows in an upward trend. Indicates that the price is moving higher over time. Acts as a support level, where prices tend to bounce upward.
Downtrend Line: Drawn by connecting the highs in a downward trend. Indicates that the price is moving lower over time. It acts as a resistance level, where prices tend to drop.
RSI: RSI readings greater than the 70 level are overbought territory, and RSI readings lower than the 30 level are considered oversold territory.
Combining RSI with Support and Resistance:
Support Level: This is a price level where a stock tends to find buying interest, preventing it from falling further. If RSI is showing an oversold condition (below 30) and the price is near or at a strong support level, it could be a good buy signal.
Resistance Level: This is a price level where a stock tends to find selling interest, preventing it from rising further. If RSI is showing an overbought condition (above 70) and the price is near or at a strong resistance level, it could be a signal to sell or short the asset.
Disclaimer:
I am not a SEBI registered. The information provided here is for learning purposes only and should not be interpreted as financial advice. Consider the broader market context and consult with a qualified financial advisor before making investment decisions.

PGIL - Bullish Setup oNStock name - Pearl Global Industries Limited.
✅#PGIL trading above Resistance of 864.
✅Next Resistance is at 1200.
✅Moved 31% in 4 weeks.
Weekly chart setup
Chart is self explanatory. Levels of breakout, possible up-moves (where stock may find resistances) and support (close below which, setup will be invalidated) are clearly defined.
Master Score - B
Disclaimer: This is for demonstration and educational purpose only. this is not buying and selling recommendations. I am not SEBI registered. please consult your financial advisor before taking any trade.

PGIL SWING TRADE IDEAPGIL bullish cup with handle chart pattern breakout done with gud volume spurt and strong bullish candle retest done and swing high took off can play for swing trade with ur prefered RR.

PGILRound Bottom Pattern Breakout.
Good Accumulation Done.
Huge Volumes.
Above all Key EMA.
Good for Short Term.
Do Like ,Comment , Follow for regular Updates...
Keep Learning ,Keep Earning...
Disclaimer : This is not a Buy or Sell recommendation. I am not SEBI Registered. Please consult your financial advisor before making any investments . This is for Educational purpose only.

PGIL - BULLISH SetupStock name - Pearl Global Industries Limited.
Weekly chart setup
Chart is self explanatory. Levels of breakout, possible up-moves (where stock may find resistances) and support (close below which, setup will be invalidated) are clearly defined.
Master Score - B
Disclaimer: This is for demonstration and educational purpose only. this is not buying and selling recommendations. I am not SEBI registered. please consult your financial advisor before taking any trade.

creat new life highcomplete chart study on chart
we never recomenda any stock to buy and sell
chart breakout rounding bottom with volume
looking volume stock performance and creating new highs

parl global
House of Pearl Fashions is a multinational ready to wear apparel manufacturing conglomerate. The company also provides supply chain solutions for the fashion industry globally along with warehousing and distribution networks in the UK and the US. They currently operate in 11 strategic locations and six continents, leveraging the strengths of each country in creating a strong value for its clients. They provide global supply chain solutions for the fashion industry. They have a complete control on the entire value chain from design and development, manufacturing or sourcing till offering a range of pre-retailing services, warehousing and delivering at the door step on a call off basis. On October 24, 2000, pursuant to a scheme of merger approved by the Delhi High Court, the company acquired the properties, rights and claims of Seth Real Estates, Passion Estates, India Watch Company, Atlanta Estates, Pearl Housing (India) and J R Apparel and the Transferor Companies merged with and into the company effective April 1, 1999. They have teams of international designers working in New York, Los Angeles, London, Hong Kong and India, who are constantly looking at the latest fashion trends, exchanging ideas and feeding design inputs to all its offices across the globe. They manage two brands Kool Hearts, DCC in the United States of America. The brand Kool Hearts focuses on the young fashion, whereas the focus of DCC is more towards Missy segment.

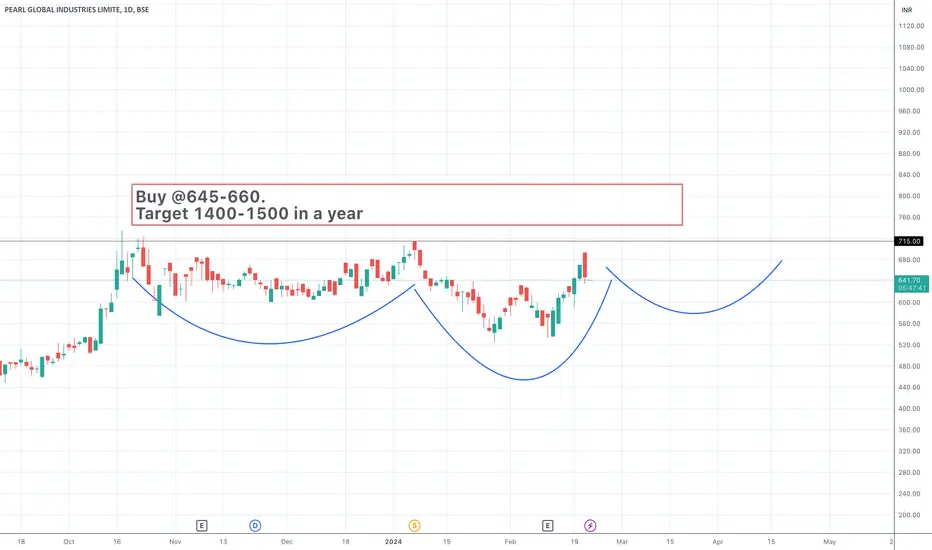
Buy @645-660. Target 1400-1500 in a yearBuy @645-660.
Target 1400-1500 in a year.
tight consolidation at 600-700 range .
start buying at given range .
Trendline Breakout (Weekly TF) - PGILPlease look into the chart for a detailed understanding.
Consider these for short-term & swing trades with 4% profit (In my observation, I found that most of the stocks reached 3% to 4% on weekly basis)
Please consider these ideas for educational purposes.

Resistance BreakoutPlease look into the chart for a detailed understanding.
Consider these for short-term & swing trades with 2% profit.
For BTST trades consider booking
target for 1% - 2%
For long-term trades look out for resistance drawn above closing.
Please consider these ideas for educational purpose

Pearl Global Industries-Nice breakout.Pearl Global Industries-Nice breakout.
Capital to be deployed- 20k
Investing Price -580/585
Breakout Price -570
Stoploss-490
Targets-778/1069
#pearlglobal #nifty50 #NiftyBank #investment #StockMarket #StocksToBuy

PGIL NSE Pearl Global BULLISHVIEW ABOVE 430 CMP 462PGIL NSE Pearl Global is bullish if 430 holds. Near 52 weeks high. Positive Trend. Fresh breakout.
**** Educational purpose only. Not Buy/Sell Recommendation.


Pearl Global: Buy set up.Stock has formed a nice inverted H&S formation on weekly charts. Buy it only above 172 with stop at 145 for tgts of 198, 239 and 306.
