Phoenix Mills - Long Set-UPNSE:PHOENIXLTD
𝐓𝐡𝐞 𝐏𝐡𝐨𝐞𝐍𝐢𝐱 𝐌𝐢𝐥𝐥𝐬
𝐄𝐧𝐭𝐫𝐘 After Breakout Or Between 1485-1560
𝐒𝐋 Below 1436
𝐓𝐚𝐫𝐠𝐞𝐭 Above 1700+
PHOENIXLTD trade ideas

PhoenixLTD, 1W & 1DLooking very Good Channel Pattern and it is ready to Breakout
Enter into it after the upper trendline Breakout
it is Combination of Both Triangle and Channel Patterns , it can Break any time
so look an eye on it or make an Alert above trendline broke
Follow For More Swing Trade Ideas Like This

PHONIX MILLS S/RSupport and Resistance Levels:
Support Levels: These are price points (green line/shade) where a downward trend may be halted due to a concentration of buying interest. Imagine them as a safety net where buyers step in, preventing further decline.
Resistance Levels: Conversely, resistance levels (red line/shade) are where upward trends might stall due to increased selling interest. They act like a ceiling where sellers come in to push prices down.
Breakouts:
Bullish Breakout: When the price moves above resistance, it often indicates strong buying interest and the potential for a continued uptrend. Traders may view this as a signal to buy or hold.
Bearish Breakout: When the price falls below support, it can signal strong selling interest and the potential for a continued downtrend. Traders might see this as a cue to sell or avoid buying.
20 EMA (Exponential Moving Average):
Above 20 EMA(50 EMA): If the stock price is above the 20 EMA, it suggests a potential uptrend or bullish momentum.
Below 20 EMA: If the stock price is below the 20 EMA, it indicates a potential downtrend or bearish momentum.
Trendline: A trendline is a straight line drawn on a chart to represent the general direction of a data point set.
Uptrend Line: Drawn by connecting the lows in an upward trend. Indicates that the price is moving higher over time. Acts as a support level, where prices tend to bounce upward.
Downtrend Line: Drawn by connecting the highs in a downward trend. Indicates that the price is moving lower over time. It acts as a resistance level, where prices tend to drop.
RSI: RSI readings greater than the 70 level are overbought territory, and RSI readings lower than the 30 level are considered oversold territory.
Combining RSI with Support and Resistance:
Support Level: This is a price level where a stock tends to find buying interest, preventing it from falling further. If RSI is showing an oversold condition (below 30) and the price is near or at a strong support level, it could be a good buy signal.
Resistance Level: This is a price level where a stock tends to find selling interest, preventing it from rising further. If RSI is showing an overbought condition (above 70) and the price is near or at a strong resistance level, it could be a signal to sell or short the asset.

PHONIX MILLS LTD S/R Support and Resistance Levels:
Support Levels: These are price points (green line/shade) where a downward trend may be halted due to a concentration of buying interest. Imagine them as a safety net where buyers step in, preventing further decline.
Resistance Levels: Conversely, resistance levels (red line/shade) are where upward trends might stall due to increased selling interest. They act like a ceiling where sellers come in to push prices down.
Breakouts:
Bullish Breakout: When the price moves above resistance, it often indicates strong buying interest and the potential for a continued uptrend. Traders may view this as a signal to buy or hold.
Bearish Breakout: When the price falls below support, it can signal strong selling interest and the potential for a continued downtrend. Traders might see this as a cue to sell or avoid buying.
20 EMA (Exponential Moving Average):
Above 20 EMA(50 EMA): If the stock price is above the 20 EMA, it suggests a potential uptrend or bullish momentum.
Below 20 EMA: If the stock price is below the 20 EMA, it indicates a potential downtrend or bearish momentum.
Trendline: A trendline is a straight line drawn on a chart to represent the general direction of a data point set.
Uptrend Line: Drawn by connecting the lows in an upward trend. Indicates that the price is moving higher over time. Acts as a support level, where prices tend to bounce upward.
Downtrend Line: Drawn by connecting the highs in a downward trend. Indicates that the price is moving lower over time. It acts as a resistance level, where prices tend to drop.
RSI: RSI readings greater than the 70 level are overbought territory, and RSI readings lower than the 30 level are considered oversold territory.
Combining RSI with Support and Resistance:
Support Level: This is a price level where a stock tends to find buying interest, preventing it from falling further. If RSI is showing an oversold condition (below 30) and the price is near or at a strong support level, it could be a good buy signal.
Resistance Level: This is a price level where a stock tends to find selling interest, preventing it from rising further. If RSI is showing an overbought condition (above 70) and the price is near or at a strong resistance level, it could be a signal to sell or short the asset.
Disclaimer:
I am not a SEBI registered. The information provided here is for learning purposes only and should not be interpreted as financial advice. Consider the broader market context and consult with a qualified financial advisor before making investment decisions.

The Phoenix Mills Limited The Phoenix Mills Limited Bullish Make sure to trade with proper trade management.

Phoenix Mills Ltd1 TG 4664.50, 5958.95,
2 SL 3112.25
Phoenix Mills Ltd is engaged in the operation & management of malls, construction of commercial & residential property and hotel business in India. India's leading retail mall developer and operator with approximately 0.64 million square meters of retail space spread across 9 malls in 6 gateway cities of India. It has developed over 2.11 million square meters
Segment Wise Revenue in FY23
Property & Related Services - 81%
Hospitality Services - 19%
Shopping Centre Portfolio
Co. has 10 malls in India as of Q4FY23 spread across Mumbai, Lucknow, Pune, Indore, Bareilly, Chennai and Ahmedabad, with the most profitable being Phoenix Palladium Mumbai.
Commercial Portfolio
Company has 7 commercial projects running in Mumbai and Pune, with 60% of the net leasable area already leased out. Office portfolio to grow from ~2 MSFT to ~7.1 MSFT by FY27. Commercial Offices on top of the mall, Bengaluru to be operational in FY24. Phase 1 ~0.80 msft, Phase 2: ~0.40 msft.
Residential Portfolio
It comprises premium and large-scale developments, with a 3.44 mn sq. ft. total saleable area. It recorded a cumulative sale of 1.58 mn sq. ft. for the year ended 31st March 2020. It has 4 residential assets. (3 in Bangalore and 1 in Chennai).
Hospitality Portfolio statistics for H1FY24
1 The St. Regis Mumbai - 395 rooms;
Avg occupancy: 82%,ARR: Rs. 15767.
2 Courtyard Marriot Agra - 193;Avg occupancy: 70%,ARR: Rs. 4303.
New Launches
The company launched a luxury mall Palladium Ahmedabad which commenced operations in Feb 2023. The mall has over 250 national and international brands and over 35 luxury brands like TUMI, Michael Kors, Kate Spade, Coach, etc. for the first time in
Ahmedabad. Tra Trading occupancy ~77% as of Oct,23.
Phoenix Citadel Indore commenced its operations on Dec 22. It is the first retail asset in India to achieve the IFC Edge Advanced Certification. It is the first asset in the PML portfolio to avail of a green loan. Trading occupancy ~90% as of Oct,23.
Phoenix Mall of Asia, Bengaluru was launched on Oct,23 with a retail GLA of ~1.2 msft. It is the largest retail-led mixed space in Bengaluru with a wide range of luxury brands. The mall has ~93% leased occupancy and ~43% trading occupancy as of Oct,23.
Phoenix Mall of the Millennium Pune was launched on Sept, 23. It has 350+ brands with 177 stores operational as of Oct,23 and ~50% trading occupancy.
Under Development
1 Alipore, Kolkata:commenced construction; As of Oct,23, excavation & foundation work under progress.It will have ~1 msft. retail space.
2 Project Rise at Lower Parel, Mumbai: It will be a mixed use development. As of Oct,23, Civil works under advanced stage. It will have a retail GLA of ~0.25 msft.
3 Asia Towers Bangalore : With a GLA of 1.2mnsqft. The first phase of offices is expected to be operational in FY24.
4 Millennium Towers Pune: Construction already started and it is expected to be launched in FY25
5Project Rise Mumbai: construction work commenced in June 2022
6 ISML - Offices,Whitefield,Bangalore: ✓ excavation nearing completion.
7 Palladium Offices Chennai: construction commenced and targeted in FY25.
Key Acquisitions
1) Surat to make it 2nd retail destination of Gujarat. Acquired land parcel of 7acres at a cost of Rs.501crs. Construction to commence in Q3 FY24.
2) Residential space in Hidco, Alipore. It won an auction for a 5.5-acre prime land parcel at a cost of Rs. 414crs.
3) Warehousing space in Sohna, NCR. It has acquired 33 acres of land parcels for Rs. 54crs.
Exceptional Items(FY23)
1. The co. surrendered a part of its land in lower Parel, Mumbai to BMC measuring 1920sqmtrs for FOC. The Company has recognized an exceptional gain of Rs 48.5 crs on the grant of the FSI by MCGM against the surrender of land to BMC on a fair value basis.
2. In May 22, the Company acquired a balance 50% equity stake ln CMDCL from Crest Ventures Limited (46.35%) & Escort Developers (P)Ltd. (3.65%). Thereafter, CMDCL has become the WOS of the Company. The co. measured its previously held equity stake i.e. 50% in CMDCL at fair value on 5th May 2022 resulting in a net gain of Rs. 556.75crs. Cons
Stock is trading at 6.97 times its book value
Company has a low return on equity of 9.88% over last 3 years.
Working capital days have increased from 65.2 days to 114 days
Focus
The company is revamping its brand mix and strengthening its entertainment offerings, with new anchors like Uniqlo opening in the second half of FY24.
Last edited 8 months, 3 weeks ago
Request an update
Pros
Company is expected to give good quarter
Company has delivered good profit growth of 23.8% CAGR over last 5 years
Debtor days have improved from 42.7 to 24.8 days.

Pheonix Mills - Ready to fly like a Pheonix? :))Pheonix Mills is on the verge of breakout. target can be 1900. Lets observe and see todays closing.
PS: Educational purpose only.

Phoenix Mills ready for quick 5 % gainsThe stock has compressed and poised to move out of the compression zone. One may consider to enter at around 2600, target 2720 and further trail.

Resistance BreakoutPlease look into the chart for a detailed understanding.
Consider these for short-term & swing trades with 2% profit.
For BTST trades consider booking
target for 1% - 2%
For long-term trades look out for resistance drawn above closing.
Please consider these ideas for educational purpose

Bullish Breakout in Phoenix MillsThe stock has given a bullish breakout. Reality sector looks strong so further upside in Phoenix Mills is expected.
Entry can be made at current market price
Stop loss- below 1434
Target- Near 1550
Let me know in the comments section if you want me to analyse any other financial instrument.
WARNING:-
ALWAYS FOLLOW RISK MANAGEMENT AND POSITION SIZING WHILE TAKING ANY TRADE.

PHOENIXLTDNSE:PHOENIXLTD
Note :
1.One Can Go long with a Strict SL below the Trendline or Swing Low of Daily Candle.
2. Close, should be good and Clean.
3. R:R ratio should be 1 :2 minimum
4. Plan as per your RISK appetite
Disclaimer : You are responsible for your Profits and loss, Shared for Educational purpose!

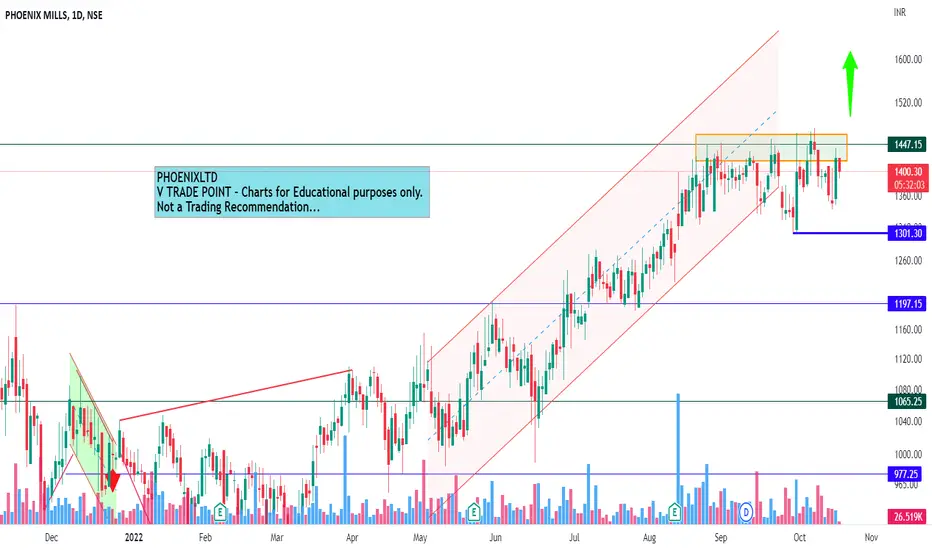
Strong support breakout expectation in Phoenix ltdStrong support breakout expectation in Phoenix ltd
Follow strict risk reward and stop loss if follow chart level
Thanks,
V Trade Point
Phoenix MillsStock broke out. strong RS
on weekly it was a buy above 1244 as box break.
expecting a good move

PHOENIX MILLS NSE BULLISHVIEW BOVE 1200 CMP 1218PHOENIX MILLS PHOENIXLTD NSE is bullish if 1200 holds. New Lifetime High. Fresh Breakout. Positive trend.
Disclaimer: Educational purpose only. Not Buy/Sell Reco. Not Sebi Registered.

Fibonacci & previous support and resistanceFrom here price might move to 1100 level, might fall till 980, but still looks like a good buy with target of 1100. If it crosses 1100 level then it will definitely move forward to 1200 level.

PHOENIXLTDNSE:PHOENIXLTD
please note that we are not a SEBI Registered Investor Adviser/PMS/ Broking House.
All the contents over here are for educational purposes only and are not investment advice or recommendations
offered to any person(s) with respect to the purchase or sale of the stocks / futures and options.
You are also requested to apply your prudence and consult your advisers in case you choose to act on
any such content available as WE claims no responsibilities for any of your actions or any outcome of
such action

Phoenix Mills Trendline BreakoutSHORTING
If the 05 or 15 mins candle breaks the trend line and if we have enough sellers than the buyers (red volume bar-prev 3-4 bars) a 1:2 risk-reward ratio can be booked.

Quite a chart to look, either 1dtf or 1wtf***Those lines which are marked, I call them as HIGH-TENSION lines.
**These lines form when there is equal pressure from buyers and sellers, levels are between (924 and 999).
*Until and unless there is no one giving up the pressure will be same between them, so that's the reason I called It as High-Tension strategy.
*Wait for the perfect break out to happen depending upon the direction of volumes, if the break-out happens LONGSIDE the target I think is huge (>15%).
Note: Know about these kind of moves, watch the pattern I had posted a while ago on "ADANI TRANS".

Phoenix Mills BreakoutThe stock has broken out and retested, therefore may undergo a reversal rally. Trade is supported by Supports Nearby.
Risk Reward Ratio - 2:1
SL is placed below the support zone & the lower trendline. The target is placed near resistance.

PHOENIXLTD 1DNSE:PHOENIXLTD
please note that we are not a SEBI Registered Investor Adviser/PMS/ Broking House.
All the contents over here are for educational purposes only and are not investment advice or recommendations
offered to any person(s) with respect to the purchase or sale of the stocks / futures and options.
You are also requested to apply your prudence and consult your advisers in case you choose to act on
any such content available as WE claims no responsibilities for any of your actions or any outcome of
such action

PHOENIXLTD 1DNSE:PHOENIXLTD
Please note that we are not a SEBI Registered Investor Adviser/PMS/ Broking House.
All the contents over here are for educational purposes only and are not investment advice or recommendations
offered to any person(s) with respect to the purchase or sale of the stocks / futures and options.
You are also requested to apply your prudence and consult your advisers in case you choose to act on
any such content available as WE claims no responsibilities for any of your actions or any outcome of
such action

Phoenixltd : Going long at 923 with small Stop loss Going long with support line as Closing basis stop loss. This month stop-loss going to be wider because market is trending and supports levels are far. Please keep in mind on position size before initiating the trade.
