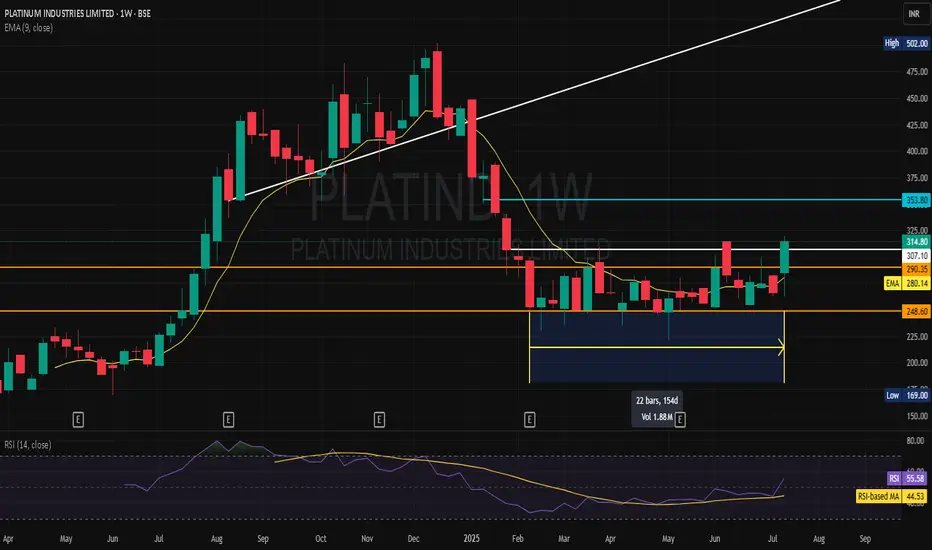
PLATINUM INDbreak out after 22 weeks consolidation
immediate support 307
stop loss closing below290
tgt 350
9.05 INR
498.00 M INR
3.92 B INR
14.74 M
About PLATINUM INDUSTRIES LTD
Sector
Industry
Website
Headquarters
Mumbai
Founded
2016
ISIN
INE0PT501018
FIGI
BBG01LN0NWZ2
Platinum Industries Ltd. engages in the manufacturing of stabilizers. It operates through the following segments: Polyvinyl Chloride (PVC) Stabilizers, Chlorinated Polyvinyl Chloride (CPVC) Additives, and Lubricants segments. The PVC Stabilizers segment provides chemical additives used in the production of PVC based products to enhance its performance and durability. The CPVC Additives and Lubricants segment offers chemical substances added to enhance the properties and performance of CPVC materials. The Lubricants segment is engaged in the manufacturing of both internal and external lubricants. The company was founded on August 19, 2016 and is headquartered in Mumbai, India.
Related stocks
#platinum industry for month As we can have clear picture of bull flag pattan the stock performance is very good and ready to make next higher high in upcoming month hold for 2 to 3 months for good return
The stock will give at less 50 percent return in few months
Buy on your risk and have small Stop-loss
Good luck

Platinum Industies - Long*Platinum Industries CMP - 464.65 / Positional Trade*
*Buy Range 460 - 465 ONLY / Stop Loss 350 in weekly candle closing*
*Target 1 - 500*
*Target 2 - 525*
*Target 3 - 550 / 575 / 600+*
Disclaimer: This is my view and for educational purpose only.

Short Term Range Breakout - PLATINDShort Term range Breakout observed in NSE:PLATIND along with Volumes > 20 Days Volumes
1. Volumes > 20 days Volume
2. RS 55 Nifty Positive
3. RSI > 60
Entry - 451
Target - ~500
SL 1: RS 21 NIFTY turns Negative
SL 2: Super Trend (10, 3) turns Negative

Platinum Industries LtdPlatinum Industries Ltd
Leading Manufacturer of PVC Stabilisers The company is the third largest Indian manufacturer of PVC stabilizers in terms of sales with 13.0% market share in FY23. Top 3 manufacturers account for 50-55% of market share and top 2 manufacturers are Baerlocher and Goldstab.

Platind - Weekly Break out chart with volumePlatind - Weekly Breakout chart with volume . One can buy it for medium term horizon.

IPO base BraekoutIPO base breakout
Entry: price close above first IPO candle
Stoploss: below the first ipo candle
Target: 10% to 30%

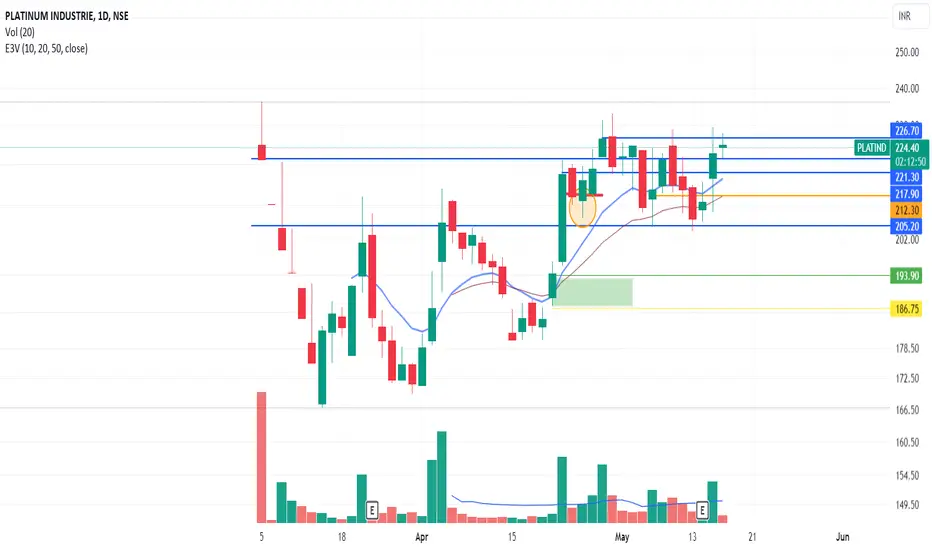
PLATINUM INDUSTRIEPLATINUM INDUSTRIE
IPO Breakout stock
above 226 to 230 on a day-closing basis
.
.
.
SL 15 may low (day closing basis)
See all ideas
Summarizing what the indicators are suggesting.
Oscillators
Neutral
SellBuy
Strong sellStrong buy
Strong sellSellNeutralBuyStrong buy
Oscillators
Neutral
SellBuy
Strong sellStrong buy
Strong sellSellNeutralBuyStrong buy
Summary
Neutral
SellBuy
Strong sellStrong buy
Strong sellSellNeutralBuyStrong buy
Summary
Neutral
SellBuy
Strong sellStrong buy
Strong sellSellNeutralBuyStrong buy
Summary
Neutral
SellBuy
Strong sellStrong buy
Strong sellSellNeutralBuyStrong buy
Moving Averages
Neutral
SellBuy
Strong sellStrong buy
Strong sellSellNeutralBuyStrong buy
Moving Averages
Neutral
SellBuy
Strong sellStrong buy
Strong sellSellNeutralBuyStrong buy
Displays a symbol's price movements over previous years to identify recurring trends.
Frequently Asked Questions
The current price of PLATIND is 278.95 INR — it has increased by 2.26% in the past 24 hours. Watch PLATINUM INDUSTRIES LTD stock price performance more closely on the chart.
Depending on the exchange, the stock ticker may vary. For instance, on NSE exchange PLATINUM INDUSTRIES LTD stocks are traded under the ticker PLATIND.
PLATIND stock has fallen by −5.25% compared to the previous week, the month change is a 2.50% rise, over the last year PLATINUM INDUSTRIES LTD has showed a −9.14% decrease.
PLATIND reached its all-time high on Dec 16, 2024 with the price of 502.05 INR, and its all-time low was 166.75 INR and was reached on Mar 14, 2024. View more price dynamics on PLATIND chart.
See other stocks reaching their highest and lowest prices.
See other stocks reaching their highest and lowest prices.
PLATIND stock is 3.59% volatile and has beta coefficient of 1.44. Track PLATINUM INDUSTRIES LTD stock price on the chart and check out the list of the most volatile stocks — is PLATINUM INDUSTRIES LTD there?
Yes, you can track PLATINUM INDUSTRIES LTD financials in yearly and quarterly reports right on TradingView.
PLATIND net income for the last quarter is 63.65 M INR, while the quarter before that showed 116.51 M INR of net income which accounts for −45.37% change. Track more PLATINUM INDUSTRIES LTD financial stats to get the full picture.
No, PLATIND doesn't pay any dividends to its shareholders. But don't worry, we've prepared a list of high-dividend stocks for you.
EBITDA measures a company's operating performance, its growth signifies an improvement in the efficiency of a company. PLATINUM INDUSTRIES LTD EBITDA is 577.56 M INR, and current EBITDA margin is 14.72%. See more stats in PLATINUM INDUSTRIES LTD financial statements.
Like other stocks, PLATIND shares are traded on stock exchanges, e.g. Nasdaq, Nyse, Euronext, and the easiest way to buy them is through an online stock broker. To do this, you need to open an account and follow a broker's procedures, then start trading. You can trade PLATINUM INDUSTRIES LTD stock right from TradingView charts — choose your broker and connect to your account.
Investing in stocks requires a comprehensive research: you should carefully study all the available data, e.g. company's financials, related news, and its technical analysis. So PLATINUM INDUSTRIES LTD technincal analysis shows the sell today, and its 1 week rating is sell. Since market conditions are prone to changes, it's worth looking a bit further into the future — according to the 1 month rating PLATINUM INDUSTRIES LTD stock shows the sell signal. See more of PLATINUM INDUSTRIES LTD technicals for a more comprehensive analysis.
If you're still not sure, try looking for inspiration in our curated watchlists.
If you're still not sure, try looking for inspiration in our curated watchlists.