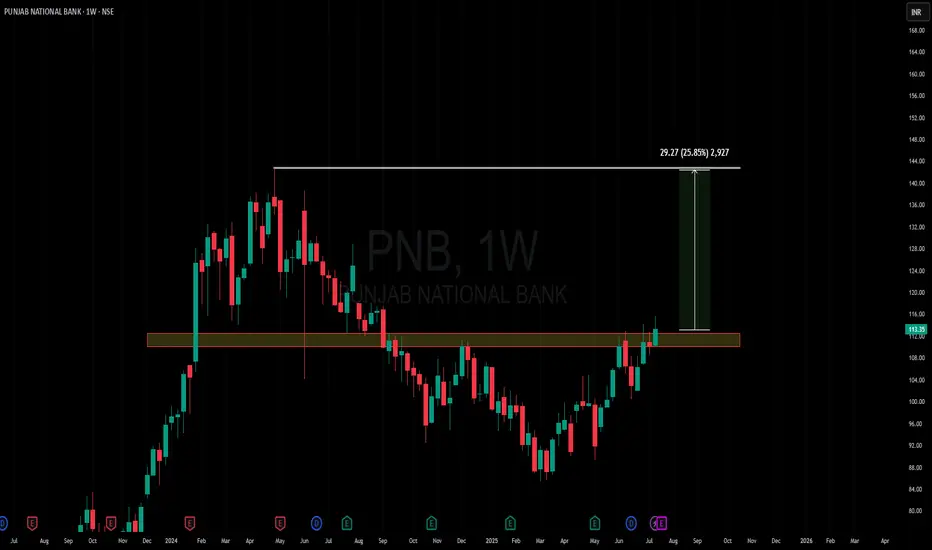
Amazing breakout on WEEKLY Timeframe - PNBCheckout an amazing breakout happened in the stock in Weekly timeframe, macroscopically seen in Daily timeframe. Having a great favor that the stock might be bullish expecting a staggering returns of minimum 25% TGT. IMPORTANT BREAKOUT LEVELS ARE ALWAYS RESPECTED!
NOTE for learners: Place the breakout levels as per the chart shared and track it yourself to get amazed!!
#No complicated chart patterns
#No big big indicators
#No Excel sheet or number magics
TRADE IDEA: WAIT FOR THE STOCK TO BREAKOUT IN WEEKLY TIMEFRAME ABOVE THIS LEVEL.
Checkout an amazing breakout happened in the stock in Weekly timeframe.
Breakouts happening in longer timeframe is way more powerful than the breakouts seen in Daily timeframe. You can blindly invest once the weekly candle closes above the breakout line and stay invested forever. Also these stocks breakouts are lifelong predictions, it means technically these breakouts happen giving more returns in the longer runs. Hence, even when the scrip makes a loss of 10% / 20% / 30% / 50%, the stock will regain and turn around. Once they again enter the same breakout level, they will flyyyyyyyyyyyy like a ROCKET if held in the portfolio in the longer run.
Time makes money, GREEDY & EGO will not make money.
Also, magically these breakouts tend to prove that the companies turn around and fundamentally becoming strong. Also the magic happens when more diversification is done in various sectors under various scripts with equal money invested in each N500 scripts.
The real deal is when to purchase and where to purchase the stock. That is where Breakout study comes into play.
Check this stock which has made an all time low and high chances that it makes a "V" shaped recovery.
> Taking support at last years support or breakout level
> High chances that it reverses from this point.
> Volume dried up badly in last few months / days.
> Very high suspicion based analysis and not based on chart patterns / candle patterns deeply.
> VALUABLE STOCK AVAILABLE AT A DISCOUNTED PRICE
> OPPURTUNITY TO ACCUMULATE ADEQUATE QUANTITY
> MARKET AFTER A CORRECTION / PANIC FALL TO MAKE GOOD INVESTMENT
DISCLAIMER : This is just for educational purpose. This type of analysis is equivalent to catching a falling knife. If you are a warrior, you throw all the knives back else you will be sorrow if it hits SL. Make sure to do your analysis well. This type of analysis only suits high risks investor and whose is willing to throw all the knives above irrespective of any sectoral rotation. BE VERY CAUTIOUS AS IT IS EXTREME BOTTOM FISHING.
HOWEVER, THIS IS HOW MULTIBAGGERS ARE CAUGHT !
STOCK IS AT RIGHT PE / RIGHT EVALUATION / MORE ROAD TO GROW / CORRECTED IV / EXCELLENT BOOKS / USING MARKET CRASH AS AN OPPURTUNITY / EPS AT SKY.
LET'S PUMP IN SOME MONEY AND REVOLUTIONIZE THE NATION'S ECONOMY!
PNB trade ideas
PNB <>BreakoutWith PSU Banks already on fire, PNB also showing breakout after forming Flag n Pole
Keeping it ion radar
PNB: Weekly Rounding Bottom Breakout! 🚀 PNB: Weekly Rounding Bottom Breakout! 🚀
📉 CMP: ₹111.16
🔒 Stop Loss: ₹99
🎯 Targets: ₹117 | ₹126 | ₹133
🔍 Why PNB Looks Strong?
✅ Technical Breakout: Rounding bottom breakout confirmed on weekly charts
✅ Retest Support: Successful retest at 40 EMA, strengthening bullish bias
✅ Sector Boost: With rate cuts supporting banking, PNB as a laggard may catch up with upside momentum, especially with improving results
💡 Strategy & Risk Management:
📈 Staggered Entry: Ideal to accumulate in phases
🔒 Strict SL: Maintain stop loss at ₹99 to manage downside risk
📍 Outlook: Strong technical setup + sector tailwind = promising swing and positional trade opportunity.
📉 Disclaimer: Not SEBI-registered. Please do your own research or consult a financial advisor before investing.
#PNB #BankingStocks #BreakoutTrading #TechnicalAnalysis #SwingTrading #StockMarketIndia #InvestmentOpportunities

PNB | Buy @110 | SL below 99 | Targets 135Disclaimer:
This is not financial advice. Please do your own research or consult with a financial advisor before making any investment decisions. Investments in stocks can be risky and may result in loss of capital.

breakout in pnb share i see a clear breakout in pnb share in daily candle. now my 1st target of this share price is 118 and 2nd target is 130 . pnb share also giving dividend on 20th june so lets check what happens in this share price after dividend annoucement.

PNBSEBI-Disclosure for Stock Analysis
For Informational Purposes Only: The analysis provided above is for educational and informational purposes only and is based on the technical interpretation of the supplied stock chart. It should not be construed as financial advice, investment advice, or a recommendation to buy, sell, or hold any security.
Not a Financial Advisor: I am an AI assistant and not a registered or qualified financial advisor, investment advisor, or stockbroker. The information presented is generated without considering your individual financial situation, risk tolerance, or investment objectives.
Risk of Loss: Trading and investing in financial markets, including equities, carry a significant risk of loss. The value of stocks can fluctuate, and you may lose part or all of your investment. Past performance is not indicative of future results.
Consult a Professional: Before making any investment decisions, you should conduct your own thorough research and/or consult with a qualified financial professional to assess your personal circumstances and the suitability of any investment.
Information Accuracy: While this analysis is based on the data visible in the chart, it does not account for all possible market variables, including fundamental factors (like company earnings, debt, management) or macroeconomic events (like interest rate changes, government policies) that can impact the stock's price.
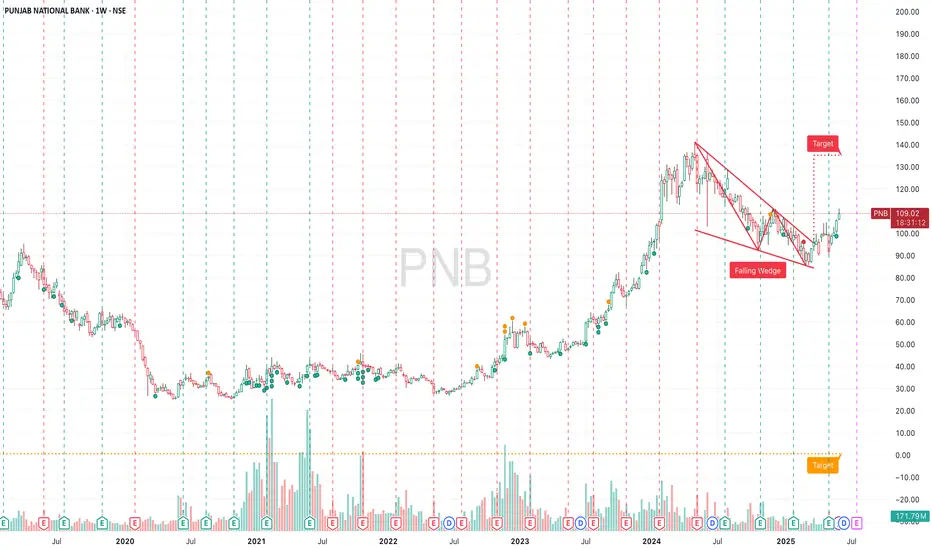
PNB Breaks Out of Long Downtrend – Bullish Continuation SetupDescription:
Punjab National Bank has broken out of a falling channel that lasted nearly a year. Price surged past the ₹105 resistance with strong volume (~60M), validating the breakout. RSI trending toward overbought confirms momentum. Prior resistance zone ₹102–104 may act as support on any pullback. As long as ₹100 holds, bias remains bullish.
Targets: ₹115 / ₹124
Stop: Below ₹98 (invalidation level)
Bias: Bullish continuation
Timeframe: Swing (2–6 weeks)
Disclaimer:
This idea is purely for educational purposes and reflects a technical setup based on chart patterns and price action. It is not a recommendation to buy or sell securities. PSU banks can be volatile and sensitive to macro/policy triggers. Traders should manage risk independently, use stop-loss, and size positions based on personal risk tolerance. Always do your own due diligence before taking any trade.

PNB | Buy @LTP or @105 | SL below 98 | 1st Target 122Disclaimer:
This is not financial advice. Please do your own research or consult with a financial advisor before making any investment decisions. Investments in stocks can be risky and may result in loss of capital.

PunJaB National Bank - Long Set-UP𝐏𝐍𝐁 𝐖𝐞𝐞𝐤𝐥𝐘 𝐂𝐡𝐚𝐫𝐭 𝐒𝐮𝐦𝐦𝐞𝐫𝐲- NSE:PNB
PNB is attempting a breakout from a long-term downtrend, currently trading at ₹102.02 with rising volume. Price is reclaiming the 30-week EMA and interacting with the 1D Fair Value Gap, showing signs of a bullish reversal
𝐊𝐞𝐘 𝐋𝐞𝐯𝐞𝐥𝐬-
EntrY - 99-101 (FVG)
SL Below 94
Target Above 115
EntrY - 92-93 (Daily Gap)
SL Below 88
Target Above 115

PNB ON A RUN Everything is pretty much explained in the picture itself.
I am Abhishek Srivastava | SEBI-Certified Research and Equity Derivative Analyst from Delhi with 4+ years of experience.
I focus on simplifying equity markets through technical analysis. On Trading View, I share easy-to-understand insights to help traders and investors make better decisions.
Kindly check my older shared stock results on my profile to make a firm decision to invest in this.
Kindly dm for further assistance it is for free just for this stock.
Thank you and invest wisely.

PNB Buy or Sell ? Punjab National Bank (PNB) is one of India's leading public sector banks, founded in 1894 with its headquarters in New Delhi. It provides a wide range of banking and financial services, including retail and corporate banking, loans, insurance, and investment solutions. PNB has a strong domestic presence with thousands of branches and ATMs across the country and also operates internationally. The bank has played a significant role in India's economic development by supporting businesses, agriculture, and financial inclusion initiatives. Despite facing challenges, including past fraud incidents, PNB continues to strengthen its operations and digital banking services to enhance customer experience and maintain its reputation in the financial sector.

PNB - SECOND ENTRY INITIATED Everything is pretty much explained in the picture itself.
I am Abhishek Srivastava | SEBI-Certified Research and Equity Derivative Analyst from Delhi with 4+ years of experience.
I focus on simplifying equity markets through technical analysis. On Trading View, I share easy-to-understand insights to help traders and investors make better decisions.
Kindly check my older shared stock results on my profile to make a firm decision to invest in this.
For any query kindly dm.
Thank you and invest wisely.

PNB Near Support – Potential Bullish Reversal PNB Near Support – Potential Bullish Reversal
4/1/24 Daily/Weekly Analysis
PNB is currently trading near a strong support zone around ₹96, as identified by both horizontal and diagonal support levels. The technical indicators are signaling a bullish stance, with TradingView scans identifying the stock as bullish and undervalued.
Key Levels:
Buy Entry: Around ₹106.40, with a stop-loss below ₹96 to manage risk effectively.
First Target: ₹142.90, where the price may face resistance.
Second Target: ₹153.97, in case of a strong upward momentum.
Technical Setup:
Support: The ₹96 level has acted as a strong support, reinforced by the 200-week moving average.
Trendline Analysis: The price is bouncing from a diagonal support, indicating potential upward movement.
Risk-Reward: The risk is well managed with a stop-loss at ₹96, and the potential upside is significant.
This setup suggests that PNB could see a bullish reversal, making it a good candidate for a swing trade. Keep an eye on key resistance levels and adjust stop-loss levels accordingly.
Disclaimer:
This analysis is for informational purposes only and should not be considered as investment advice. Trading in the stock market involves risks, and it is important to conduct your own research or consult with a financial advisor before making investment decisions. Past performance is not indicative of future results. Always trade with risk management strategies in place.

pnb has no strength showing Charts for Educational purposes only.
Please follow strict stop loss and risk reward if you follow the level.
Thanks,

PNB 1D TFIn the previous post we saw that NSE:PNB has been for a resistance zone, now the zone has been broken out and the stock is running in profit.
We have discussed this more on our previous post. You can view the previous post by clicking the attachment below this post.
Disclaimer:- This analysis is only for educational purpose. Please always do your own analysis or consult with your financial advisor before taking any kind of trades

PNB 1D TFNSE:PNB has formed a small resistance zone in 1D TF. The chart though is in downtrend has formed a resistance zone which can be used in near future. This stock can be traded with multiple confirmations.
Disclaimer:- This analysis is only for educational purpose. Please always do your own analysis or consult with your financial advisor before taking any kind of trades

LONGCup and handle break out, now retesting the support line . Very Good Q2 numbers. Lets see, will it test the 160 level.

IF IT CLOSSES ABOVE THIS LEVEL - A BUY BUY BUY BUY CALL IN PNB"Everything is pretty much explained in the picture itself.
I am Abhishek Srivastava | SEBI-Certified Research and Equity Derivative Analyst from Delhi with 4+ years of experience.
I focus on simplifying equity markets through technical analysis. On Trading View, I share easy-to-understand insights to help traders and investors make better decisions.
Kindly check my older shared stock results on my profile to make a firm decision to invest in this.
Thank you and invest wisely.

Punjab National Bank (PNB) Technical Outlook📌 Current Price: ₹100.53 (+1.05%)
📌 Sector: Banking
📌 Timeframe: Daily
Key Observations:
1.Descending Channel:
PNB has been trading in a well-defined descending channel since its peak of ₹142.40. The current trend remains bearish, with lower highs and lower lows.
2.Fibonacci Retracement:
Major Levels:
0.618 (₹113.59) : Key resistance.
0.5 (₹104.69): Immediate resistance.
0.382 (₹95.80): Current support.
0.236 (₹84.79): Next critical support if the stock breaches ₹95.80.
3.Support and Resistance Levels:
Support: ₹95.80 (holding strong for now).
Resistance: ₹104.69, followed by ₹113.59.
4.Volume Analysis:
Declining volume suggests indecision among traders, indicating a potential consolidation phase.
5.RSI (Relative Strength Index):
RSI shows the stock is moving out of oversold territory, which could trigger a short-term bounce.
Jefferies Target 🎯:
Revised Target: ₹135
This aligns with the 0.786 Fibonacci level (₹126.26) , a crucial point where PNB would need to break out of the descending channel and confirm a trend reversal.
Potential Scenarios:
Bullish Case:
Bounce from ₹95.80 and breakout above ₹104.69.
Sustained buying could push the stock to ₹113.59 and eventually to ₹126.
Bearish Case:
A breakdown below ₹95.80 could lead to a retest of ₹84.79.
Failure to hold ₹84.79 might push the stock to its next support zone around ₹80.
Trading Strategy:
1.Short-Term Traders:
Watch for a breakout above ₹104.69 for a quick target of ₹113.59.
Stop-loss: ₹95.
2.Long-Term Investors:
Accumulate near ₹95.80 or ₹84.79, keeping ₹80 as a long-term stop-loss.
Final Thoughts:
The stock's long-term prospects remain aligned with its sector growth and broader market recovery. A breakout from the descending channel could attract significant buying interest, aligning with Jefferies' bullish target of ₹135.

PNB swing trading setupChart Analysis:
1.Descending Trendline:
The chart shows a clear descending trendline acting as resistance, with the price making lower highs. This signals a prevailing downtrend, and any break above this line with significant volume could indicate a reversal or trend change.
2.Support Zones:
•There is a key support zone near the current price level, as indicated on the chart. This level has held up on previous occasions, making it a potential bounce or breakdown point.
•Below the main support, there is another secondary support level which could act as the next stop if the primary support breaks.
3.Resistance Level:
The chart highlights a resistance level just above the current price action. If the price approaches this zone, it may encounter selling pressure unless accompanied by strong buying momentum.
4.RSI Indicator:
The RSI appears to be in the mid-range, indicating neither overbought nor oversold conditions. This implies a potential for a move in either direction, depending on market sentiment and volume.
Swing Trading Strategy:
1.Bearish Setup (Preferred Scenario):
•Entry: Enter a short position if the price breaks below the support zone with a convincing candle (strong red candle on high volume).
•Stop Loss: Place a stop loss just above the descending trendline or above the breakout point to minimize potential losses in case of a reversal.
•Target 1: First target would be the next significant support level as highlighted on the chart.
•Target 2: If momentum continues, you can extend the target further down to historical support or key psychological levels.
•Trailing Stop: Use a trailing stop once you reach Target 1 to lock in profits if the price moves favorably.
2.Bullish Reversal Setup:
•Entry: Consider entering a long position if the price breaks and closes above the descending trendline with strong bullish momentum and high volume.
•Stop Loss: Place a stop loss slightly below the breakout candle to mitigate risk of a fake breakout.
•Target 1: Aim for the immediate resistance level.
•Target 2: If bullish momentum sustains, consider further targets based on historical resistance levels.
•Trailing Stop: Implement a trailing stop after reaching Target 1 to protect profits while allowing room for further gains.
Risk Management:
•Position Sizing: Only risk a small percentage (typically 1-2%) of your total trading capital per trade.
•Confirmation Signals: Look for confirmation with volume spikes and candlestick patterns before entering any trades.
•Market Conditions: Consider broader market trends and sentiment as they can heavily influence individual stock movements.
Additional Tips:
•Be cautious of potential fake breakouts, especially around major trendlines or key levels.
•Monitor volume; a lack of volume on breakouts or breakdowns can signal weak moves that may reverse quickly.
Disclaimer: This information is for educational and informational purposes only and should not be considered as financial advice. Trading and investing involve significant risk of loss and may not be suitable for all investors. Past performance is not indicative of future results. You should do your own research and consult with a licensed financial advisor before making any investment decisions. The author of this content does not accept any liability for any losses or damages arising directly or indirectly from the use of or reliance on the information provided.

PNBPNB
monthly timeframe
i just shared my experience it is not an invite or recommendation to trade.
if youn any doubt means Please leave comments for any query.
best wishes
DYSON

$PNB - Bullish Pattern observedNSE:PNB - showing Navarro200 (bullish pattern) for Tgt of 112, 128 levels with sl @ 99.75
Disclaimer : for Educational purpose - Not a SEBI registered advisor

PNBHi guys,
In this chart i Found a Demand Zone in PNB CHART for Positional entry,
Observed these Levels based on price action and Demand & Supply.
*Don't Take any trades based on this Picture.
... because this chart is for educational purpose only not for Buy or Sell Recommendation..
Thank you
