PPL PHARMA
PPL PHARMA
MTF MTF-Zone TREND MTF Analysis Logic Proximal
HTF Yearly UP PPL PHARMA Yearly Demand DBR 143
HTF Half-Yearly UP PPL PHARMA 6 Month Demand RBR 167
HTF Qtrly UP PPL PHARMA Qtrly Demand BUFL RR 167
HTF Average UP 159
MTF Monthly Down PPL PHARMAMonthly Demand BUFL 194
MTF Weekly Down PPL PHARMAWeekly Demand BUFL 194
MTF Daily Down PPL PHARMADaily Demand DMIP DMIP 187
MTF Average UP 192
ITF 240M Down PPL PHARMA 240Mn Demand DMIP 189
ITF 180M Down PPL PHARMA 180 Mn Demand DMIP 213
ITF 60M Down PPL PHARMA 60 Mn Demand DMIP 213
ITF Average UP 205
Trade Plan BUY PPL PHARMA ENTRY-1
Entry-1 213
Entry-2 187
SL 185
RISK 29
REWARD 126
Target as per Entry 339
RR 4.4
Last High 307
Last Low 181
PPLPHARMA trade ideas

RETEST IS NEEDED - - PIRAMAL PHARMAEverything is pretty much explained in the picture itself.
I am Abhishek Srivastava | SEBI-Certified Research and Equity Derivative Analyst from Delhi with 4+ years of experience.
I focus on simplifying equity markets through technical analysis. On Trading View, I share easy-to-understand insights to help traders and investors make better decisions.
Kindly check my older shared stock results on my profile to make a firm decision to invest in this.
Kindly dm for further assistance it is for free just for this stock.
Thank you and invest wisely.

Piramal Pharma Ltd. for Long termPiramal Pharma Ltd.
best buy at 168 levels,
Multiple time act as Support / Resistance.
Piramal Pharma Ltd. for Long term

Piramal Pharma-looks good from here.1. Price Action & Trend Analysis
The stock has been in an uptrend since its low in late 2022, following an ascending trendline (dashed black).
Multiple higher lows (circled in blue) have formed, respecting the trendline.
Currently, the stock broke down sharply (-11.57%), testing both the trendline support and the horizontal resistance turned support (black horizontal line).
If the price holds above this key level, it may bounce; otherwise, further downside is possible.
2. Support & Resistance Levels
Support: Around 194-200 INR, where the stock is testing the trendline.
Resistance:
307.90 INR (High level)
414.20 INR (Projected target if the uptrend continues)
3. RSI & Momentum Analysis
RSI (14) = 40.69, indicating a neutral to slightly bearish zone (not oversold yet).
RSI-based MA (58.65) shows a significant drop, meaning momentum is weakening.
If RSI drops below 40, it could indicate further downside.
4. Future Projection
Bullish Scenario: If the stock bounces off this support, it may resume its uptrend toward 250-300 INR.
Bearish Scenario: If it breaks below 194 INR, it could drop further to 150 INR or even the previous low near 100 INR.
5. Summary
Key Decision Zone: 194-200 INR
Trend: Still bullish but at risk of breakdown.
Watch RSI & Support Levels: A break below 194 INR could trigger more selling.

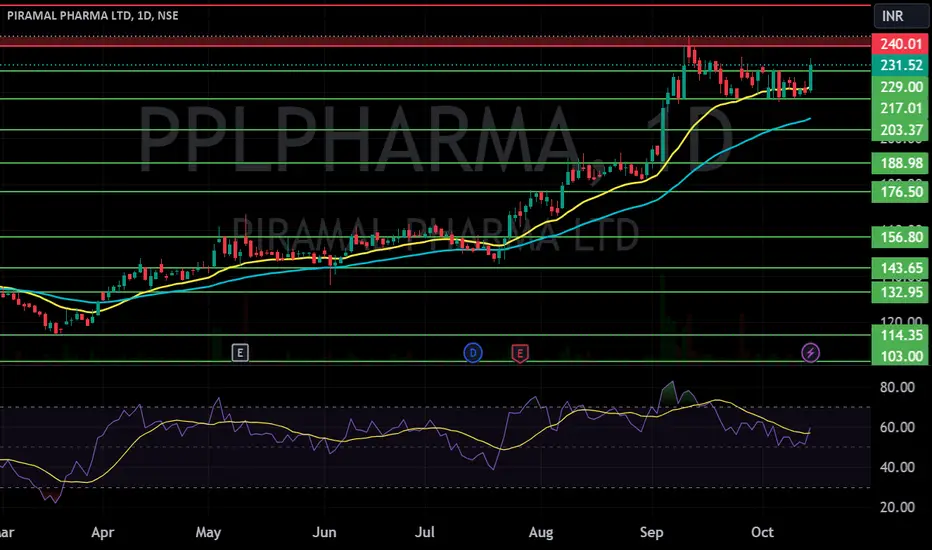
PIRAMAL CHART LOOKS GOOD ABOVE MALooks good above 9 Ema which can be short term .
Rule is rule. Rule for all
Don’t play with your emotions. Analysis may correct or fails but we have to wait for the level above sustainable 1hr candle. Only educational purpose

Piramal PharmaPiramal Pharma at support level,
Forming a triangle Pattern.
only for education purpose only.

PPLPHARMA NSE POLE & FLAG BO DT/WTF SWING/POSITIONALPIRAMAL PHARMA STOCK Analysis
TRADE PLAN
ENTRY -230 50% Qty, Add 50% qty 243 DTF Close
SL -186 (Note: SL is deep below the Weekly Low since there is a FVG in WTF
TARGET --01-243 (Swing) , TGT02--306
Hold For a 06M-1 Year or TGT 2
Chart Pattern :
STOCK had a 6 Month Streak to Touch an ATH of 243, Retracing in Equal time to 23.6% FIBO Level forming a Bullish Flag Pattern indicating a Bullish continuation..
INDICATORS EMA :
The STOCK Price has Trading above 50EMA, and bouncing up from 20EMA in DTF. STOCK EMAs are currently in ascending alignment 20 to 200EMA where on 1th an 5.3%+ price rise with Volumes indicating start of a bullish Flag Breakout Trend on DTF/WTF.
FIBO/E :
Currently the price is above 20% FIBO Retracement Level, Early Entry can be take as per your risk ability. Safe Traders Enter above 230.
Volumes: There is a uptrend in Volume above the 20VMA on the DTF & Weekly Charts for10-12 Weeks even during the Pullback.
Keep in your Priority Watch List
Disclaimer: For Education/Reference Purpose Only, Trade at your Own Risk with correct position sizing and SL based on your Risk appetite (Exit when price closes 7to8% below your Entry).and re enter when trend reverses...
Trail Your SL progressively. Learn/Know and Review the Stock trading Technical Terminology. Check Verify the Financial fundamentals of the Stock and Seek Advice from a Certified Financial Advisor prior to Investing. Prefer Entry with 25% quantity, Add in Tranches of 25%-50% as prices moves upwards recommended.
MTFA- Multiple Time Frame Analysis
DTF -Daily Time Frame
WTF-Weekly Time Frame
MTF- Monthly Time Frame
ATH-All Time High
LTH -LifeTime High
RBC&H-Rounding Bottom Cup/Handle
BO- Breakout Close
EMA -Exponential Moving Average
FIBO R/E -Trend based Fibonacci Retracement/Extension
SL Stop Loss
TBD- To be Decided
CHoCH- Change of Character Bullish/Bearish
MSB/BOS -Break Out Structure
FVG Fair Value Gap
20VMA -20Volume Moving Average
SWING/POSITIONAL Trade

50 SMA Rising- Positional TradeDisclaimer: I am not a Sebi registered adviser.
This Idea is publish purely for educational purpose only before investing in any stocks please take advise from your financial adviser.
Its 50 SMA Rising Strategy. Suitable for Positional Trading Initial Stop loss lowest of last 2 candles and keep trailing with 50 days SMA if price close below 50 SMA then Exit or be in the trade some time trade can go for several months.
Be Discipline because discipline is the Key to Success in the STOCK Market.
Trade What you see not what you Think

PPLPharma:LongTook entry today in PPLPHARMA: It broke the IBs near 10MAs and 10EMA crossed above 20EMA
Stock is in stage 2
Entry: 232.65
SL: 2.5%
Target: Near all-time High Resistance: Should book profit by selling most of the holdings
Uptrend continuation


PIRAMAL PHARMA S/R Support and Resistance Levels:
Support Levels: These are price points (green line/shade) where a downward trend may be halted due to a concentration of buying interest. Imagine them as a safety net where buyers step in, preventing further decline.
Resistance Levels: Conversely, resistance levels (red line/shade) are where upward trends might stall due to increased selling interest. They act like a ceiling where sellers come in to push prices down.
Breakouts:
Bullish Breakout: When the price moves above resistance, it often indicates strong buying interest and the potential for a continued uptrend. Traders may view this as a signal to buy or hold.
Bearish Breakout: When the price falls below support, it can signal strong selling interest and the potential for a continued downtrend. Traders might see this as a cue to sell or avoid buying.
20 EMA (Exponential Moving Average):
Above 20 EMA(50 EMA): If the stock price is above the 20 EMA, it suggests a potential uptrend or bullish momentum.
Below 20 EMA: If the stock price is below the 20 EMA, it indicates a potential downtrend or bearish momentum.
Trendline: A trendline is a straight line drawn on a chart to represent the general direction of a data point set.
Uptrend Line: Drawn by connecting the lows in an upward trend. Indicates that the price is moving higher over time. Acts as a support level, where prices tend to bounce upward.
Downtrend Line: Drawn by connecting the highs in a downward trend. Indicates that the price is moving lower over time. It acts as a resistance level, where prices tend to drop.
RSI: RSI readings greater than the 70 level are overbought territory, and RSI readings lower than the 30 level are considered oversold territory.
Combining RSI with Support and Resistance:
Support Level: This is a price level where a stock tends to find buying interest, preventing it from falling further. If RSI is showing an oversold condition (below 30) and the price is near or at a strong support level, it could be a good buy signal.
Resistance Level: This is a price level where a stock tends to find selling interest, preventing it from rising further. If RSI is showing an overbought condition (above 70) and the price is near or at a strong resistance level, it could be a signal to sell or short the asset.
Disclaimer:
I am not a SEBI registered. The information provided here is for learning purposes only and should not be interpreted as financial advice. Consider the broader market context and consult with a qualified financial advisor before making investment decisions.
Piramal Pharma (1 Hour Chart) - Technical AnalysisPiramal Pharma (1 Hour Chart) - Technical Analysis
---
Chart Overview:
Descending Triangle Pattern: The stock is forming a descending triangle, which is a bearish pattern but can break in either direction. The price is compressing between resistance at the downward-sloping trendline and support at around ₹222.
Resistance Zone: Around ₹230.
Support Zone: The stock has strong support near ₹222, as indicated by multiple rejections from that level.
Volume:
The volume is relatively low but steady, suggesting that a breakout could be imminent. A rise in volume could validate the move in either direction.
Potential Scenarios:
Bullish Breakout: A close above the ₹230 resistance could trigger a move towards the ₹240-₹245 zone.
Bearish Breakdown: A close below ₹222 could lead to a deeper correction, with support at ₹215 or lower.
Disclaimer: This analysis is for educational purposes and not financial advice.

PITAMAL PHARMA LTDThese are swing ideas which you can add your watchlist and analysis for yourself !
Keep on your radar!
i am not sebi ragister!

IPO BreakoutGood volume buildup in daily as well as weekly timeframe.
Highest volume buildup since is IPO in weekly timeframe.
Fundamentals are OK.
FII and DII stakes are up.
NOTE: I do my analysis, do yours before trade.

life high Let’s dive deeper into the breakdown and the **last 5 candles** for a more detailed explanation of the chart:
### **Breakout Analysis**:
**Breakout Level**: The stock price had been **consolidating** just below the resistance level of **₹194.96** for a while. This resistance level corresponds to the previous high, forming a psychological barrier.
**Volume Confirmation**: The breakout was accompanied by a **massive volume spike** (112 million shares), which is a clear indicator that there’s strong buying interest and confirms that the breakout is likely legitimate.
**Uptrend Line**: The purple trendline connecting the higher lows suggests that this uptrend has been building steadily over time. When the price broke above the ₹194-₹195 resistance, it broke free from this consolidation phase.
### **Last 5 Candles Analysis** (Weekly Chart):
1. **First Candle** (Leftmost):
**Type**: Large **bullish candle** 📈.
**Action**: This candle was the first to **break above ₹194.96**, making it significant as it signals a breakout. The long body suggests strong upward momentum, with buyers stepping in at the ₹195 level and driving the price up.
**Volume**: Volume was **strong**, suggesting a lot of participation during the breakout.
2. **Second Candle**:
**Type**: **Small-bodied candle**, a bit of a **spinning top** or **doji-like** pattern 📊.
**Action**: After the strong breakout, the price action showed **indecision**. This indicates the market is pausing after a large move up, possibly due to profit-taking or some hesitation among traders about further upside.
**Volume**: The volume slightly decreased, confirming the market's hesitation.
3. **Third Candle**:
**Type**: Another **bullish candle** 🔼 but smaller than the first.
**Action**: This candle confirms that the breakout remains **intact** as the price is holding above the breakout level and moving slightly upward. The smaller body compared to the first candle suggests that the momentum may be cooling off but is still on the upside.
**Volume**: Moderate volume suggests some interest, but it’s lower than the breakout candle, which is expected in a consolidation period.
4. **Fourth Candle**:
**Type**: **Small bearish candle** 💬 with a shadow (wick).
**Action**: This candle indicates a **small pullback** or retracement, which is common after a breakout. Some traders are likely locking in profits after the breakout. The lower wick shows that although the price pulled back, buyers stepped in again, preventing a deeper drop.
**Volume**: Slightly lower volume, indicating consolidation, and the sellers didn’t have much control despite the pullback.
5. **Fifth Candle** (Rightmost, Current Candle):
**Type**: **Large bullish candle** 📈
**Action**: This is the **most significant candle**, with a **16.20% price surge**, confirming that buyers are back in full force. The long body shows that the price jumped from₹186 to₹219.59, a very strong move. This candle signals the continuation of the breakout move, with no significant resistance in the way.
**Volume**: **Massive volume** (112M), which is far higher than previous weeks, confirming that the breakout has strong participation, making the uptrend more likely to continue.
### **Breakout Strength & Continuation**:
The strength of this breakout is validated by the combination of **price action** (breaking through resistance) and **volume confirmation** (high volume during the breakout).
With such strong volume and the fact that the price is now clearly above the **₹195 resistance**, this suggests that the stock could continue its upward momentum towards the next major resistance around **₹240-245**.
### **What to Watch**:
A **strong close** this week will confirm the breakout.
If the price stays above the **₹195** level with continued higher volume, it suggests that the breakout will hold.
**Pullbacks** are possible, but they may provide entry points if the price holds above the ₹195 level.
---
### **Summary of Breakout & Last 5 Candles**:
**Breakout confirmed** at ₹195 with huge volume.
The stock has entered a **strong bullish phase** with increasing buying pressure.
The **last 5 candles** show initial hesitation, a small pullback, but a **huge bullish push** in the most recent candle.
Let me know if you'd like more insights! 😊
no recommendation for buy and sell


PPL Pharma Create Cup & Handle pattern one Day Time Frame PPL Pharma Create Cup & Handle pattern one Day Time Frame, Buy Sustain Above 145 Sl 128 minimum target 169-188-195.80-212

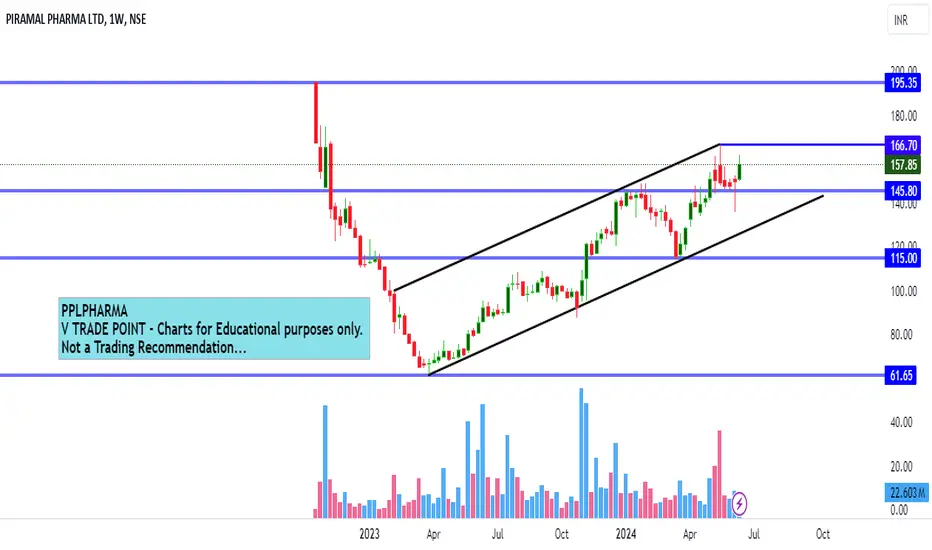
PPL PHARMA chart update #PPLPHARMA PPL PHARMA chart update #PPLPHARMA
If sustain above the current level then chance for bulls..145 area will act as short term support..
Charts for educational purposes only.
Not a Trading Recommendation
Thanks,
V Trade Point
camerla Pattern undecided pattern condition where the 3rd candle is undecided by the byers & Sellers

#PPLPHARMA new positionentry 150
sl 147.75
qty 1500
took medium sized position with very small risk
Overall market condition is weak, but looking at small daily candles I took the trade because overall market is weak but this stock is not falling and trading in very tight daily range

Break out in Piramal Pharma (Formed a complex cup & Handle )Piramal pharma give a berak out after a long time consolidation ,Breakout happen with good volume

PPLPHARMARectangle Pattern Breakout.
Volume Buildup seen.
Good for Short term.
Above all Key EMA.
Target 174 , 195 ...
Do Like ,Comment , Follow for regular Updates...
Keep Learning ,Keep Earning...
Disclaimer : This is not a Buy or Sell recommendation. I am not SEBI Registered. Please consult your financial advisor before making any investments . This is for Educational purpose only.

PPL PHARMA All time high in making ?PPLPHARMA has crossed the resistance with a strong candle after retesting the breakout and this move is supported by volume as well. It might move to target marked in some time.
Target: 186
SL: 138
R-R: ~1:2
Simple charts, so that, everyone can understand. I'll be posting more such ideas like this. Until that, like share and follow :)
Thanks,
Wayfarer.
keep learning and keep earning.
Disclaimer: We are not registered financial advisors, and the views shared here are personal opinions. It's important to consult with your financial advisors before making any investment decisions.
