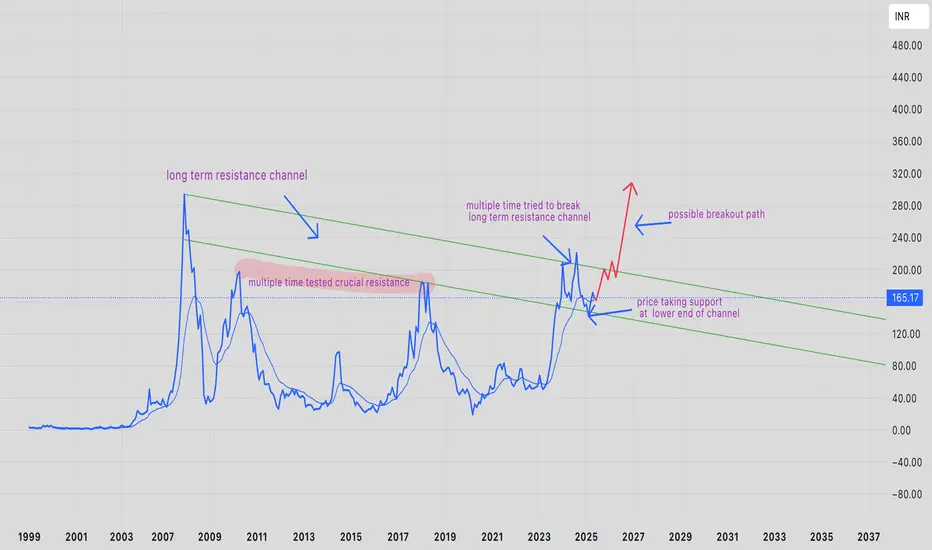
High chance of PRAKASH-EQ to break ATH and make new highPRAKASH-EQ has traded in range for about 14 years ( from 2010 high to recent 2024 high ). This time the breakout is different because price has managed to break and trade above its crucial resistance zone.
currently price of PRAKASH-EQ has taken support at the lower end of its long term resistance
19.85 INR
3.55 B INR
40.14 B INR
89.76 M
About PRAKASH INDUSTRIES LTD
Sector
Industry
Website
Headquarters
New Delhi
Founded
1980
ISIN
INE603A01013
FIGI
BBG000CXYWX9
Prakash Industries Ltd. engages in the businesses of mining, wind power, and steel and power generation. The company was founded by Basu Dev Agarwal on July 31, 1980 and is headquartered in New Delhi, India.
Related stocks
PRAKASH INDUSTRIES- COME-ON LIT OUR LIVES!!Chart Analysis & Summary:
Stock Overview:
Stock: Bhagyanagar India Ltd (NSE)
Current Price: ₹71.60
Change: -₹3.47 (-4.62%)
Timeframe: Weekly (1W)
Technical Levels & Fibonacci Retracement:
Resistance & Highs:
Recent high at ₹163.30.
Another key level around ₹128.89.
Fibonacci Levels:
0.5 retracemen

Prakash- looking bright!!The chart represents a technical analysis of Prakash Industries Ltd. on a weekly time frame from the NSE (National Stock Exchange of India). Here are the key takeaways from the analysis:
Elliott Wave Analysis
The chart follows Elliott Wave Theory, with waves 1 to 5 labeled.
The stock appears to be


Prakash Ind Long Weekly BOIt has been consolidating for the last 16 years and is now giving a breakout on both weekly and monthly timeframes. Whenever a breakout occurs, it's often accompanied by changes in revenue, profits, and other fundamental ratios, indicating that the company is performing well.
Remember to do your ow

PRAKASHHi guys,
In this chart i Found a Demand Zone in PRAKASH CHART for Positional entry,
Observed these Levels based on price action and Demand & Supply.
*Don't Take any trades based on this Picture.
... because this chart is for educational purpose only not for Buy or Sell Recommendation..

LONGPrakash Ind.
Cup n handle pattern, if crossed the resistance, it may to the target given. Volume buzz seen.
Fundamentally strong.

PRAKASH1. Anything can happen.
2. You don't need to know what is going to happen next in order to make money.
3. There is a random distribution between wins and losses for any given set of variables that define an edge. No other thoughts
4. An edge is nothing more than an indication of a higher probability


"Prakash Industries: Bullish Breakout Imminent on 1D Chart – PotPrakash Industries Limited on the 1D timeframe is showing a bullish setup, signaling an imminent breakout. With the technical indicators aligning, this stock is poised to deliver significant returns in the coming weeks. Keep an eye on the price action for a potential entry point to capitalize on thi

See all ideas
Summarizing what the indicators are suggesting.
Oscillators
Neutral
SellBuy
Strong sellStrong buy
Strong sellSellNeutralBuyStrong buy
Oscillators
Neutral
SellBuy
Strong sellStrong buy
Strong sellSellNeutralBuyStrong buy
Summary
Neutral
SellBuy
Strong sellStrong buy
Strong sellSellNeutralBuyStrong buy
Summary
Neutral
SellBuy
Strong sellStrong buy
Strong sellSellNeutralBuyStrong buy
Summary
Neutral
SellBuy
Strong sellStrong buy
Strong sellSellNeutralBuyStrong buy
Moving Averages
Neutral
SellBuy
Strong sellStrong buy
Strong sellSellNeutralBuyStrong buy
Moving Averages
Neutral
SellBuy
Strong sellStrong buy
Strong sellSellNeutralBuyStrong buy
Displays a symbol's price movements over previous years to identify recurring trends.
Frequently Asked Questions
The current price of PRAKASH is 176.64 INR — it has decreased by −2.56% in the past 24 hours. Watch PRAKASH INDUSTRIES LTD stock price performance more closely on the chart.
Depending on the exchange, the stock ticker may vary. For instance, on NSE exchange PRAKASH INDUSTRIES LTD stocks are traded under the ticker PRAKASH.
PRAKASH stock has risen by 5.35% compared to the previous week, the month change is a 7.38% rise, over the last year PRAKASH INDUSTRIES LTD has showed a −6.88% decrease.
PRAKASH reached its all-time high on Jan 1, 2008 with the price of 308.70 INR, and its all-time low was 0.91 INR and was reached on Sep 17, 2001. View more price dynamics on PRAKASH chart.
See other stocks reaching their highest and lowest prices.
See other stocks reaching their highest and lowest prices.
PRAKASH stock is 3.29% volatile and has beta coefficient of 1.08. Track PRAKASH INDUSTRIES LTD stock price on the chart and check out the list of the most volatile stocks — is PRAKASH INDUSTRIES LTD there?
Today PRAKASH INDUSTRIES LTD has the market capitalization of 31.68 B, it has increased by 3.72% over the last week.
Yes, you can track PRAKASH INDUSTRIES LTD financials in yearly and quarterly reports right on TradingView.
PRAKASH net income for the last quarter is 908.30 M INR, while the quarter before that showed 837.40 M INR of net income which accounts for 8.47% change. Track more PRAKASH INDUSTRIES LTD financial stats to get the full picture.
Yes, PRAKASH dividends are paid annually. The last dividend per share was 1.20 INR. As of today, Dividend Yield (TTM)% is 0.68%. Tracking PRAKASH INDUSTRIES LTD dividends might help you take more informed decisions.
EBITDA measures a company's operating performance, its growth signifies an improvement in the efficiency of a company. PRAKASH INDUSTRIES LTD EBITDA is 5.20 B INR, and current EBITDA margin is 12.94%. See more stats in PRAKASH INDUSTRIES LTD financial statements.
Like other stocks, PRAKASH shares are traded on stock exchanges, e.g. Nasdaq, Nyse, Euronext, and the easiest way to buy them is through an online stock broker. To do this, you need to open an account and follow a broker's procedures, then start trading. You can trade PRAKASH INDUSTRIES LTD stock right from TradingView charts — choose your broker and connect to your account.
Investing in stocks requires a comprehensive research: you should carefully study all the available data, e.g. company's financials, related news, and its technical analysis. So PRAKASH INDUSTRIES LTD technincal analysis shows the buy rating today, and its 1 week rating is strong buy. Since market conditions are prone to changes, it's worth looking a bit further into the future — according to the 1 month rating PRAKASH INDUSTRIES LTD stock shows the buy signal. See more of PRAKASH INDUSTRIES LTD technicals for a more comprehensive analysis.
If you're still not sure, try looking for inspiration in our curated watchlists.
If you're still not sure, try looking for inspiration in our curated watchlists.