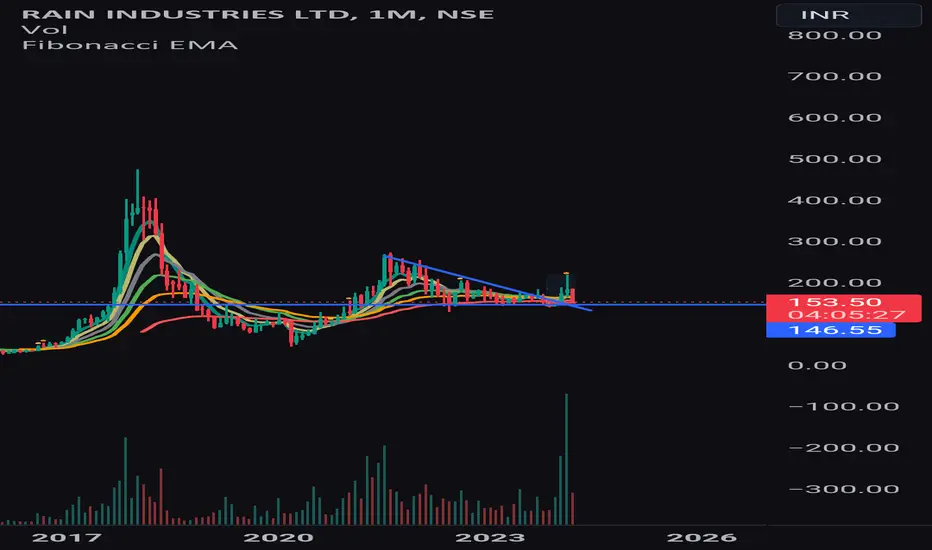
RAIN Industries Swing IdeaRain Industries has given Multiyear breaks out with spike in volume we can expect a good upside movement in the stock.
RAIN trade ideas

RAIN INDUSTRIES ' s Key Support Zone This is the one hour chart of RAIN INDUSTRIES.
Rain Industries is moving within an ascending parallel channel with support around 140 range and resistance around 160 range.
If this level is sustain , then we may see higher prices in the
Rain Industries
Thank You !!

RAIN INDUSTRIES at Good Support.This is 4 hour chart of RAIN INDUSTRIES.
Stock is forming a Symmetrical Triangle Pattern.pattern lower boundary expected to act as a strong support level 142-145.
IF this level is sustain , then we may see higher prices in Rain industries.
Thank You !!

RAIN LONGMomentum is picking up. Good increase in volumes.
Resistance Level 1 : 270
Resistance Level 2 : 385
Support Level : 125
View is negated below 125
Long Term stock.
For short term keep these levels and track the price action on weekly chart.
My view is for educational or study purpose only.
It is not a buy/sell recommendation.
Contact your financial advisor before taking any investment or trade decision.

Rain Industries - Box Confirmation for Buy **Rain Industries - Box Confirmation for Buy**
#### **Key Observations**:
1. **Range Breakout Setup**:
- The chart highlights a **box range** between **₹150.69** (support) and **₹220.34** (resistance).
- The recent price movement shows a **strong upward breakout** from the lower box level, currently trading around **₹192.55**.
2. **Box Confirmation**:
- A successful breakout above **₹195–₹200** with sustained volumes would confirm bullish momentum.
- A move towards the upper resistance zone at **₹220.34** appears likely.
3. **Volume Analysis**:
- Monitor for **volume spikes** during the breakout; higher volumes indicate strong buying interest.
4. **Moving Average Support**:
- The price has reclaimed the **50-day moving average** and is now consolidating above it.
- This moving average will act as dynamic support.
5. **Risk-Reward Setup**:
- **Entry**: Buy on confirmation above **₹195–₹200**.
- **Stop-Loss**: Set at **₹175** (below recent support).
- **Targets**:
- **First Target**: ₹220.34 (upper box resistance).
- **Second Target**: ₹240–₹250 (if momentum continues post breakout).
---
### **Trade Strategy**:
- **Entry Zone**: ₹195–₹200 (upon box breakout confirmation).
- **Stop-Loss**: ₹175.
- **Target**: ₹220.34 (initial), with extended targets up to ₹240–₹250.
### **Conclusion**:
Rain Industries is exhibiting a bullish range breakout setup. A confirmation above ₹200 with strong volumes can trigger a rally towards the upper resistance zone at ₹220. Traders can consider buying with strict risk management.
\

WEALTH CREATION STOCK RAIN INDUSTRIESRain Industries
This Stock Is In My Watch List From 27/10/2024 Price Was 154.
Cmp@183
This Stock Is In Wave 3 Of 3.
I Hope This Stock Can Give Tremendous Return In Near Future.
Holding Period 2-3 Year.
Target - 356/408/493

RAIN NSE WTF Bearish Channel 3Y 4M BO Soon PositionalRAIN INDUSTRIES Analysis EARLY ENTRY
TRADE PLAN
ENTRY -176 25% Qty (refer linked Charts)
SL -159
TARGET --01-219 (25%), TGT02--272 (50% gain)
Hold For a Year or TGT 2
Chart Pattern :
STOCK peaked 3.5Y ago 272 ATH and then got into a bearish Channel and is Trading in Range for 3Y now. The Stock Gained 6%+ today with Good Volumes above 20VMA.
INDICATORS EMA :
The Price is Currently Trading just above 20EMA, and 20EM crossed above 50EMA in DTF. STOCK EMAs are currently aligned in a ascending order 200 to 20 but indicating a Flat Trend on DTF/WTF.
FIBO E :
The Stock has Support at 23.6% FIBO Retracement Level, Price is currently trading near the 23.6% FIBO Retracement level. Add quantity Above 50% FIBO/R of 199 on DTF, with ChoCH at 176 on WTF is added impetus to the bullishness...
Volumes: There is a uptrend in Volume on the Monthly Charts consistently in the current trading Range confirming the Accumulation Phase.. A Gap up can is the offing soon...
Keep in your Priority Watch List
Disclaimer: For Education/Reference Purpose Only, Trade at your Own Risk with correct position sizing and SL based on your Risk apetite (Exit when price closes 7to8% below your Entry).
Trail Your SL progressively. Learn/Know and Review the Stock trading Technical Terminology. Check Verify the Financial fundamentals of the Stock and Seek Advice from a Certified Financial Advisor prior to Investing. Prefer Entry with 25% quantity, Add in Tranches of 25%-50% as prices moves upwards recommended.
MTFA- Multiple Time Frame Analysis
DTF -Daily Time Frame
WTF-Weekly Time Frame
MTF- Monthly Time Frame
ATH-All Time High
LTH -LifeTime High
RBC&H-Rounding Bottom Cup/Handle
BO- Breakout Close
EMA -Exponential Moving Average
FIBO R/E -Trend based Fibonacci Retracement/Extension
SL Stop Loss
TBD- To be Decided
CHoCH- Change of Character Bullish/Bearish
MSB/BOS -Break Out Structure
FVG Fair Value Gap
20VMA -20Volume Moving Average
SWING/POSITIONAL Trade

Rain Industries ..................Ready to JumpRain Industries, a diversified global company, as per charts can see 20% increase in its stock price. This forecast is supported by positive financial results, strategic business moves, or favorable market conditions.

Rain-ing money?The scrip has broken out of the darvas box after almost 6 month of consolidation, the volume is nice, it may easily run up to 198, further bull move requires a good closure above 210.

RAIN CMP 182After giv a strong rally after covid in 2021 stock consolidating around two years. At monthle candle it giving a trendline breakout signal with Bollinger band and EMA confirmation. We can see see a low risk and high reward setup in this stock. Add wachlist and take your Trade.

Rain Industries Ltd - Long BUYRain Industries Ltd - Long BUY
fundamentally and technically strong company
now trading at good valuable price go for long

6 months consolidation & going on. laggardsix months consolidation & still going on......... Once darling of traders now the laggard


RAIN IND may touch the Trendlines...NSE:RAIN trade at 168.80. You can watch for next trendline resistance 200, after breakout you can watch for 250 level.

Consolidation Breakout - RAIN📊 Script: RAIN
Key highlights: 💡⚡
📈 Script is giving consolidation breakout on daily chart.
📈 One can go for Swing Trade.
BUY ONLY ABOVE 176
⏱️ C.M.P 📑💰- 176
🟢 Target 🎯🏆 - 187
⚠️ Stoploss ☠️🚫 - 171
⚠️ Important: Always maintain your Risk & Reward Ratio.
✅Like and follow to never miss a new idea!✅
Disclaimer: I am not SEBI Registered Advisor. My posts are purely for training and educational purposes.
Eat🍜 Sleep😴 TradingView📈 Repeat 🔁
Happy learning with trading. Cheers!🥂

Rain Industries: Range Trading Setup with MACD & Bollinger BandLong Position:
Entry: Current price level (around 163-165)
Target: 175-180 (Upper range of the channel)
Stop-Loss: 155 (Tightened stop-loss, just below recent support)
Pattern Overview:
Horizontal Channel: Rain Industries is trading within a well-defined horizontal channel, with support around 145-150 and resistance around 175-180. The stock has recently bounced from the lower support and is moving toward the upper resistance.
MACD: The MACD line has crossed above the signal line, indicating a bullish momentum shift. This supports the potential move toward the upper range of the channel.
Bollinger Bands: The stock is currently trading near the middle of the Bollinger Bands. The narrowing bands suggest decreasing volatility, but a move toward the upper band (around 175-180) is possible as the stock approaches the upper resistance.
Strategy:
Enter long near the current price level with a target of 175-180, the upper boundary of the channel. Use a stop-loss at 155 to reduce downside risk while still allowing the trade to develop.
Risk/Reward Ratio: ~3:1
Key Levels to Watch:
Support: 155
Resistance: 175-180
MACD Bullish Signal: Watch for continued divergence between the MACD and signal lines for confirmation.
Bollinger Bands: Look for price action near the upper band as a potential exit point.
Disclaimer:
*I am not SEBI registered and this idea could be wrong. I'm here to learn, so please share your thoughts in the comments. Don’t follow this blindly! :) *

Rain - Long Term (Different wave count)Currently doing wave 2. Breakout of triangle will launch wave 3 which will make new all-time highs.

RAIN - Long term chartRain currently doing its complex wave 4 correction. Triangle pattern is visible and breakout of this triangle could launch the wave 5 to the high of wave 3 at least.

RAIN Industries Ltd - Bullish Momentum (Buy o Every DIP) Technical Analysis of RAIN Industries Ltd
Overview of the Stock:- The chart provides a technical analysis of RAIN Industries Ltd on a 1-hour timeframe. The primary tools used are:
Price action: Using candlestick patterns and support/resistance levels.
Moving averages: Specifically, the 200-period Exponential Moving Average (EMA).
Fibonacci retracement levels: To identify potential support and resistance areas.
Relative Strength Index (RSI): To assess the overall market sentiment.
My Observations about the Stock
Uptrend: -The overall price action suggests an uptrend, as the price is currently above the 200 EMA.
Support and Resistance:
The 0.382 Fibonacci retracement level around 173.70 acted as strong support.
The price is now testing the 0.5 Fibonacci level around 173.97, which could be a crucial level to watch.
A break above the 0.618 level (around 184.77) would confirm a stronger uptrend.
RSI: - The RSI is currently around 57, indicating a neutral to slightly bullish sentiment. A reading above 70 would suggest overbought conditions, while a reading below 30 would indicate oversold conditions.
Potential Scenarios
Bullish Scenario: -If the price breaks above the 0.5 Fibonacci level with strong volume, it could signal a continuation of the uptrend. The next target would be the 0.618 Fibonacci level.
Bearish Scenario: - A breakdown below the 0.382 Fibonacci level would invalidate the uptrend and could lead to further downside. The 0.236 Fibonacci level around 149.80 could be the next support area.
Trading Implications
Buy Signal: - A breakout above the 0.5 Fibonacci level with strong volume could be a potential buy signal.
Sell Signal: - A breakdown below the 0.382 Fibonacci level could be a potential sell signal.
Stop-Loss: - Traders should consider placing a stop-loss below the recent swing low to protect their profits or limit potential losses.
Risk Management: - It's crucial to implement proper risk management strategies, such as using stop-loss orders and position sizing.
Remember: This analysis is based on historical data and past performance is not indicative of future results. The stock market is volatile, and prices can fluctuate rapidly.
Disclaimer: This analysis is based solely on the provided chart and does not constitute financial advice. It's essential to conduct thorough research and consider multiple factors before making investment decisions as I am not SEBI registered person to suggest any stock and this is my personal opinion
Thanks for your support as always

RAIN- Analysis Looks good for long term (1-2 Years time ) with Small Stoploss as per your comfort.
Anytime stock closed above above 175 or 186 then it will be bullish
Safe Entry above 217
Stoploss of 170
Final Target around 430
Targets to watch 196 then 217 then 240 then 264 to 289 then 315 then 342 then 370 then 400 then 430
Please do your due diligence before trading or investment.
*Comment or message me if you wish to see my analysis for any stocks.
**Disclaimer -
I am not a SEBI registered analyst or advisor. I does not represent or endorse the accuracy or reliability of any information, conversation, or content. Stock trading is inherently risky and the users agree to assume complete and full responsibility for the outcomes of all trading decisions that they make, including but not limited to loss of capital. None of these communications should be construed as an offer to buy or sell securities, nor advice to do so. The users understands and acknowledges that there is a very high risk involved in trading securities. By using this information, the user agrees that use of this information is entirely at their own risk.
Thank you.

Rain: will money rain?Most underperforming stock finally brokeout, a close above 208 will give more conviction. The scrip can easily reach 275 in ST and MT target will be ATH.

RAIN LONGForming a Triangle Pattern in Weekly timeframe.
Good for Short term.
Target Recent Swing high.
Disclaimer : This is not a Buy or Sell recommendation. Please consult your financial advisor before making any investments . This is for Educational purpose only.
