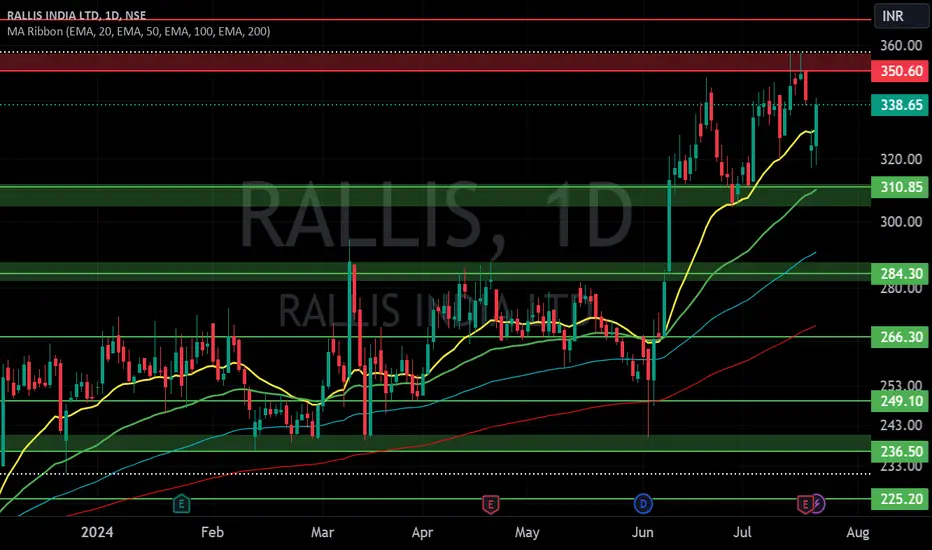
Rallis India - Cup Pattern BreakoutRallis India Ltd
Cup pattern breakout - consolidation - breakout.
Crossing last week high.
RSI crossed above 70.
Stock outperforming benchmark and sectoral inde
NEWS - Rallis India Limited reports revenue of Rs 2663 Cr in FY25.
agrospectrumindia.com
Disclaimer:
For educational purpose only.
Please do your own research before taking any trades.
Happy Trading!
RALLIS trade ideas

This stock price Multiyear SupportThis stock price trading near multiyear Support, low risk zone for any stocks/indices .

RALLIS CMP 314.This stock we providing for Your Fear Trading porpose. In charts maximum stoploss hunted by operator.Now it trying to rebound from here.Operator need maximum down level and liquidity. An that is your stoploss.Always try if company is fundamentally best then Buy at Every Dip. In this chart Stoploss is Minimum .Its mean Low risk High reward. Add to your wachlist and see how it perform in coming days.

RALLIS INDIA - BUYNSE:RALLIS Monthly breakout stock with positive momentum and quarterly results. On the other side comparatively outperform the market.

SWING TUTORIAL - RALLISIn this tutorial, we analyzes the reversal of NSE:RALLIS 's 50% decline, identifying key technical indicators that signaled a buying opportunity. We'll explore how to recognize bullish momentum and optimal entry points using chart analysis.
NSE:RALLIS reached its all-time high at 362 before experiencing a significant downturn. However, the stock began forming support levels near 200 in June 2022 and retested this level again in May 2023.
Key Observations:
1. Support Levels: The stock consistently found support at ₹200, indicating a potential reversal.
2. MACD Indicator: The Moving Average Convergence Divergence (MACD) line showed steady upward momentum, signaling increasing bullish pressure.
3. MACD Crossover: The successful crossover in June 2023 confirmed the bullish trend, creating an entry opportunity.
Trading Strategy and Results:
Based on this analysis, our entry point was established at the MACD crossover. The stock subsequently rose to its swing high levels, yielding approximately 85% returns in just 57 weeks.
Note: This case study demonstrates the effectiveness of combining technical indicators to identify bullish momentum. By recognizing support levels, MACD movements, and consolidation patterns, traders can pinpoint potential entry points.
Would you like to explore more technical analysis concepts or case studies? Share your feedback and suggestions in the comments section below.


Perfect Rounding Bottom ....NSE:RALLIS trade at 355. Support is at 300 and Resistance at 375,
after breakout you can watch it next resistance at 500.

50 SMA Rising StrategyI am not a Sebi registered adviser.
This Idea is publish purely for educational purpose only before investing in any stocks please take advise from your financial adviser.
This Strategy i learn by paying. It 50 SMA Rising. Suitable for Positional Trading Initial Stop loss lowest of last 2 candles and keep trailing with 50 days SMA if price close below 50 SMA then Exit or be in the trade some time trade can go for several months.

Rallis India Ltd- A Tata Group Company in Agriculture Chemicals Rallis India Ltd- A Tata Group Company in Agriculture Chemicals
Buy above- 270
Stop Loss - 235
Disclaimer
The information and publications are not meant to be, and do not constitute, financial, investment, trading, or other types of advice or recommendations supplied or endorsed by Me.

RALLIS INDIA LTD S/R Support and Resistance Levels: In technical analysis, support and resistance levels are significant price levels where buying or selling interest tends to be strong. They are identified based on previous price levels where the price has shown a tendency to reverse or find support.
Support levels are represented by the green line and green shade, indicating areas where buying interest may emerge to prevent further price decline.
Resistance levels are represented by the red line and red shade, indicating areas where selling pressure may arise to prevent further price increases. Traders often consider these levels as potential buying or selling opportunities.
Breakouts: Breakouts occur when the price convincingly moves above a resistance level (red shade) or below a support level (green shade). A bullish breakout above resistance suggests the potential for further price increases, while a bearish breakout below support suggests the potential for further price declines. Traders pay attention to these breakout signals as they may indicate the start of a new trend or significant price movement.
20 EMA: The yellow line denotes 20 EMA, to interpret the 20 EMA, you need to compare it with the prevailing stock price. If the stock price is below the 20 EMA, it signals a possible downtrend. But if the stock price is above the 20 EMA, it signals a possible uptrend.
Disclosure: I am not SEBI registered. The information provided here is for learning purposes only and should not be interpreted as financial advice. It is important to consult with a qualified financial advisor before making any investment decisions. Tweets neither advice nor endorsement.
SWING IDEA - RALLIS INDIARallis India , a leading player in the agrochemical sector renowned for its innovative solutions and commitment to sustainable agriculture, showcases promising potential for swing trading amidst favorable technical indicators.
Reasons are listed below :
After multiple tests in the 270-290 zone, Rallis India has finally breached the resistance, signaling a significant shift in market sentiment.
A robust bullish candle close on the weekly timeframe, accompanied by massive volumes, underscores strong buying interest and potential for sustained upward momentum.
The price found support at the 0.382 Fibonacci level, adding weight to the bullish thesis and reinforcing the likelihood of continued upward movement.
Breaking free from a consolidation phase lasting over 2.5 years, Rallis India demonstrates potential for a new bullish trend trajectory.
Trading above both the 50 and 200 exponential moving averages (EMA) on the weekly timeframe, with the 50 EMA crossing over the 200 EMA, further bolsters the bullish outlook, suggesting strengthening upward momentum.
Target - 325 // 353 // 392
StopLoss - weekly close below 245
DISCLAIMER -
Decisions to buy, sell, hold or trade in securities, commodities and other investments involve risk and are best made based on the advice of qualified financial professionals. Any trading in securities or other investments involves a risk of substantial losses. The practice of "Day Trading" involves particularly high risks and can cause you to lose substantial sums of money. Before undertaking any trading program, you should consult a qualified financial professional. Please consider carefully whether such trading is suitable for you in light of your financial condition and ability to bear financial risks. Under no circumstances shall we be liable for any loss or damage you or anyone else incurs as a result of any trading or investment activity that you or anyone else engages in based on any information or material you receive through TradingView or our services.
@visionary.growth.insights

Buy rallisMoving average cross over
Entery @275-281
Stope loss @259
Target @320-321
#education purpose

rallis looks good for 350++Very good volume
clear breakout
stoploss 290
Rallis India, a Tata Group company Group Co., has a history of over 150 years. The company is into manufacturing of Agrochemicals and is present across the value chain of agriculture inputs - from seeds to organic plant growth nutrients. Rallis is also in the business of contract manufacturing for global corporations

RALLIES : Sector Agriculture CONSOLIDATION ALMOST OVER FRESH BREAKOUT SOON .
POSTIVE -🔥
1. Company Almost DEBT free
2. PromoterS - 𝙄𝙉𝘾𝙍𝙀𝘼𝙎𝙀 𝙃𝙊𝙇𝘿𝙄𝙉𝙂
3. FIIs - 𝙄𝙉𝘾𝙍𝙀𝘼𝙎𝙀 𝙃𝙊𝙇𝘿𝙄𝙉𝙂
#BOOK_VALUE - 94.1 ₹
EPS - 7.60
STOCK PE - 37.1
ROE - 8.30%
Disclaimer : educational purpose only.
DYOR


RALLIS - Bullish - Long TermNSE:RALLIS has just corrected 50% of the fib level in the long term after completing impulse waves over a multi-year.
This 50% retracement is typical of wave 2 correction in Eliott Wave to 182.50 level and bounced back.
Now it has completed wave 1 and 2 of 3 higher degree and wave 3 of 3 can break all time very quickly. watch out

#RALLIS 288 TGT 525 #Investment #TataChem #TATASons #TATAMOTORSRALLIS 288
TGT 525
SL 224
RR ~4
Timeframe <8M
Return > 80%
Risk < 25%
NSE:RALLIS
Buy Recommended
Can hold for long term
Shared with 💚
By Rachit Sethia

RALLIS : About to breakoutFundamentals:
From past few weeks, we are observing good buying in chemical sector especially in agro-chemical.
Subsidiary of tata chemical
Sector is coming out of long price and time correction phase.
Promoter holding has increased by 5% in current consolidation phase . FIIs stake is also increasing
Public is decreasing quarter by quarter
Technical:
Weekly price chart is coming out of consolidation.
New high was made today after 4-5 weeks
Good volume bars on weekl chart
RSI is bouncing back from levels of 60
TARGET -1 : 300
TARGET -2 : 325
STOP LOSS: 242
**These are my personal observations. Please trade at your own risk.**

Rallis IndiaStock on weekly breakout. yellow dotted is target 1..above that quick move expected. Long term portfolio pik. no SL as add on dip.. target % profit should be 30% on invested capital.....

RALLIS - BUY ACTIVERALLIS - Rallis India Limited - BUY ACTIVE
Chart Insights : Day Chart
Stock closed at 287 on 07-Mar-2024
We can see stock is under formation of cup & handle and tried to break the resistance and can expect upside move if its sustain above the resistance.
BUY Active only resistance breaks and sustain above resistance & keep monitor for future investment. The best Investment at SUPPORT ZONE 110-140 Level.
Create GTT order in Zerodha at 140 or 110 Level or create alert if it comes you can invest more for better returns, If you want you can invest less amount for less returns.
Drawn support and resistance levels on chart for entry and exit reference.
Its purely investment and must have patience.

Rallis BreakoutStock testing 10 year old resistance line again but coupled with double bottom , we may see a upside above Rs 255/-
This is a discussion with educational point of view.

RALLIS INDIA Descending Triangle Pattern Breakout RALLIS INDIA with a solid Descending Triangle Pattern Breakout with Multiple Confirmation on Weekly Chart.
Ready to take entry & Can expect easy 1:2 or 1:3 Targets with Proper Risk Management.
Stock is Ready to take off.

Demand in RALLISClear demand is visible on the 15 min chart. Can provide good return in short time. SL can be 215 and target 345.
