RAMA STEEL A MULTI BAGGER IN THE MAKINGRama Steel Tubes Limited has demonstrated notable developments recently:
Sales Growth: In Q2 FY25, the company reported a sales volume of 50,921.67 tons, marking a 42.32% year-over-year increase and a 36.28% rise from the previous quarter.
Green Energy Initiatives: Rama Steel Tubes has entered the renewable energy sector by partnering with Onix Renewable Ltd. to supply steel structures and single-axis trackers for solar projects. Additionally, the company incorporated a wholly-owned subsidiary, ONIX IPP Pvt. Ltd., to focus on green energy ventures.
Market Performance: The stock has experienced significant movements, including a 38% surge over three sessions in September 2024, adding approximately ₹500 crore to its market capitalization.
Financial performance for the second quarter of fiscal year 2025 (Q2 FY25) is as follows:
1)Sales Volume: The company reported a sales volume of 50,921.67 tons in Q2 FY25, a 42.32% increase compared to 35,780.33 tons in Q2 FY24.
2)Revenue: The revenue for Q2 FY25 stood at ₹263.05 crore, up 29.37% from ₹203.33 crore in the same quarter the previous year.
Rama Steel Tubes Limited has been actively reducing its debt levels over recent years, reflecting a strategic move to strengthen its financial health. Here's a detailed overview:
1)Total Debt:
As of March 2024, the company's total debt stood at ₹144 crore, a 25.12% reduction from ₹193 crore in March 2023.
2) Debt-to-Equity Ratio:
The debt-to-equity ratio decreased to 0.43 in March 2024 from 0.77 in March 2023, indicating a significant reduction in leverage.
3)Net Debt-to-EBITDA Ratio:
The company has improved its Net Debt-to-EBITDA ratio over the years, showcasing better debt management relative to earnings.
These metrics highlight Rama Steel Tubes Limited's commitment to reducing debt and enhancing financial stability.
ITS A REAL HIDDEN GEM 💎
RAMASTEEL trade ideas

Rama Steel Tube going to take new high Attention, Rama Steel Tube will take the new high upcoming days. Short-term target 25 Long term target - 750.

RAMA STEEL TUBES LTD S/RSupport and Resistance Levels:
Support Levels: These are price points (green line/shade) where a downward trend may be halted due to a concentration of buying interest. Imagine them as a safety net where buyers step in, preventing further decline.
Resistance Levels: Conversely, resistance levels (red line/shade) are where upward trends might stall due to increased selling interest. They act like a ceiling where sellers come in to push prices down.
Breakouts:
Bullish Breakout: When the price moves above resistance, it often indicates strong buying interest and the potential for a continued uptrend. Traders may view this as a signal to buy or hold.
Bearish Breakout: When the price falls below support, it can signal strong selling interest and the potential for a continued downtrend. Traders might see this as a cue to sell or avoid buying.
20 EMA (Exponential Moving Average):
Above 20 EMA(50 EMA): If the stock price is above the 20 EMA, it suggests a potential uptrend or bullish momentum.
Below 20 EMA: If the stock price is below the 20 EMA, it indicates a potential downtrend or bearish momentum.
Trendline: A trendline is a straight line drawn on a chart to represent the general direction of a data point set.
Uptrend Line: Drawn by connecting the lows in an upward trend. Indicates that the price is moving higher over time. Acts as a support level, where prices tend to bounce upward.
Downtrend Line: Drawn by connecting the highs in a downward trend. Indicates that the price is moving lower over time. It acts as a resistance level, where prices tend to drop.
RSI: RSI readings greater than the 70 level are overbought territory, and RSI readings lower than the 30 level are considered oversold territory.
Combining RSI with Support and Resistance:
Support Level: This is a price level where a stock tends to find buying interest, preventing it from falling further. If RSI is showing an oversold condition (below 30) and the price is near or at a strong support level, it could be a good buy signal.
Resistance Level: This is a price level where a stock tends to find selling interest, preventing it from rising further. If RSI is showing an overbought condition (above 70) and the price is near or at a strong resistance level, it could be a signal to sell or short the asset.
Disclaimer:
I am not a SEBI registered. The information provided here is for learning purposes only and should not be interpreted as financial advice. Consider the broader market context and consult with a qualified financial advisor before making investment decisions.

RAMASTEEL- AnalysisBullish Levels -Day closing above 11 then 15 to 15.5 then 23 to 25 then 31 then 36 or 39
Bearish levels :- Day closing below 9 (SL for Swing trade Investor) then 6 to 4 (SL for Long term Investor) below this more bearish.
**Consider some Points buffer in above levels
**Disclaimer -
I am not a SEBI registered analyst or advisor. I does not represent or endorse the accuracy or reliability of any information, conversation, or content. Stock trading is inherently risky and the users agree to assume complete and full responsibility for the outcomes of all trading decisions that they make, including but not limited to loss of capital. None of these communications should be construed as an offer to buy or sell securities, nor advice to do so. The users understands and acknowledges that there is a very high risk involved in trading securities. By using this information, the user agrees that use of this information is entirely at their own risk.
Thank you.

rama steel tubehas partnered with Onix Renewable for green and renewable energy.
Under the partnership, the company will provide steel structures along with single-axis trackers, and focus on dual-axis trackers to be expanded in the future essential for solar projects undertaken by Onix Renewable.

RAMASTEELHi guys,
In this chart i Found a Demand Zone in RAMASTEEL CHART for Positional entry,
Observed these Levels based on price action and Demand & Supply.
*Don't Take any trades based on this Picture.
... because this chart is for educational purpose only not for Buy or Sell Recommendation..
Thank you

Rama Steel Tubes - Thundering like Rama's Bow
Rama Steel Tubes - The price reached the high of 15.37 on Jan 2023 - Approx 609 days ago. Since then it fell -33% from its ATH and has been painfully going sideways between 10 and 16 forming an upward Parallel Channel - testing the patience of every investor. During mid of 2023, FIIs significantly increased stake in this counter, yet it didn't budge
Today the price Locked itself in 20% UC back-to-back for 2 consecutive days, and stood alone as the lone warrior among majority of Metal related stocks
Here is the Chart of Nifty Metal Index -
Nifty Metal Index fell 0.5% today and has been continually falling -10% since beginning of June 2024
So, why did Rama Steel Blast today despite Majority Metal stocks fell and Index also fell?? The answer lies within the Stock's Chart itself
On the Quarterly chart - the price gave approx. 7,050% returns in 1,036 days. Any investor would be Crazy to expect immediate bounce back after running a marathon like this...
The consolidation started on Jan 2023 and the price fell just a meagre -33% from previous ATH, but to clearly show Bullish Continuation - the price formed an Upward Parallel Channel for nearly 1 year 9 months which is a clear indication to NOT TO WORRY
But many investors don't understand the previous returns of 7000%, and lose patience waiting for just 1.5 years and when the price blasted 20% UC in 2 days many of them booked their profits / exited completely...
How many times have we heard the statement....
"Whenever I invest the price falls....
Whenever I exit the Price Blasts..."
This situation is no exception to this adage, for the primary reason that investors don't understand why they invest and neither understand why they sell off....
Clues:
1. On the Monthly chart, the August candle ended right on Parallel Channel bottom as Support
2. Also, the Aug candle turned to be a Gravestone Doji pattern / inverted Hammer pattern at the bottom which is clear indication of Bullish reversal
3. The long consolidation for more than 1.9 years built enough pressure which got blasted in the past 2 days
This is not a Target, but rather the journey is yet to start. The parallel Channel is yet to be broken and once broken it would hit a Target of 25
But it still won't be a cake-walk, once the Parallel Channel top is tested, the resistance would for 1 last time push the price down to a support of 15.4 and then blast upwards
Keep Holding for multibagger returns. Learn how the market behaves and build your patience and Conviction....
Disclaimer:
Stocks-n-Trends is NOT registered with SEBI. We do not provide Buy / Sell recommendations - rather we provide detailed analysis of how to review a chart, explain multi-timeframe views purely for Educational Purposes. We strongly suggest our followers to "Learn to Ride the Tide" and consult your Financial Advisors before taking any positions.
If you like our detailed analysis, please do rate us with your Likes, Boost and share your comments
-Team Stocks-n-Trends

Technical Analysis of RAMA STEEL TUBES LTDAnalyzing the Rama Steel Tubes Chart
Disclaimer: While I can provide a technical analysis based on the given chart, it's essential to conduct thorough research and consider additional factors like fundamental analysis, market conditions, and personal risk tolerance before making any investment decisions.
Technical Analysis
Overall Trend:
* The chart indicates a strong uptrend. The price has been consistently making higher highs and higher lows.
Support and Resistance:
* The horizontal line drawn near the 13.87 level seems to act as a significant support level. The stock has found support at this level multiple times.
* There is no immediate strong resistance level visible on the chart, but the price might encounter resistance around the previous all-time high if it continues to rise.
Indicators:
* Volume: The volume appears to be increasing during uptrends, suggesting growing interest in the stock.
* Moving Averages: (Assuming the chart uses default settings) The 50-day and 200-day moving averages are likely to be below the current price, indicating a bullish trend.
Potential Entry, Stop Loss, and Target
Entry:
* Breakout: If the price breaks above a recent high, it could signal a continuation of the uptrend. A breakout entry could be considered.
* Pullback: If the price pulls back to the support level near 13.87 and shows signs of reversal (e.g., bullish candlestick patterns), a pullback entry might be considered.
Stop Loss:
* The stop loss could be placed below the recent support level, perhaps around 13.00. This would limit potential losses if the trend reverses.
Target:
* A potential target could be the previous all-time high or a Fibonacci extension level based on the recent uptrend. However, these targets are subject to change based on market conditions.
Additional Considerations
* Fundamental Analysis: Consider factors like company financials, industry trends, and news related to Rama Steel Tubes to support the technical analysis.
* Risk Management: Always practice proper risk management by diversifying your portfolio and allocating a suitable portion of your capital to this investment.

Technical Analysis of Rama Steel Tubes Ltd Technical Analysis of Rama Steel Tubes Ltd
Key Observations from the Chart
Trend: - The stock appears to be in a sideways trend or consolidation phase. The price action is confined within a horizontal channel, indicating indecision among buyers and sellers.
Support and Resistance: - The horizontal channel acts as both support and resistance. A break above the upper channel could signal a bullish uptrend, while a break below the lower channel could indicate a bearish downtrend.
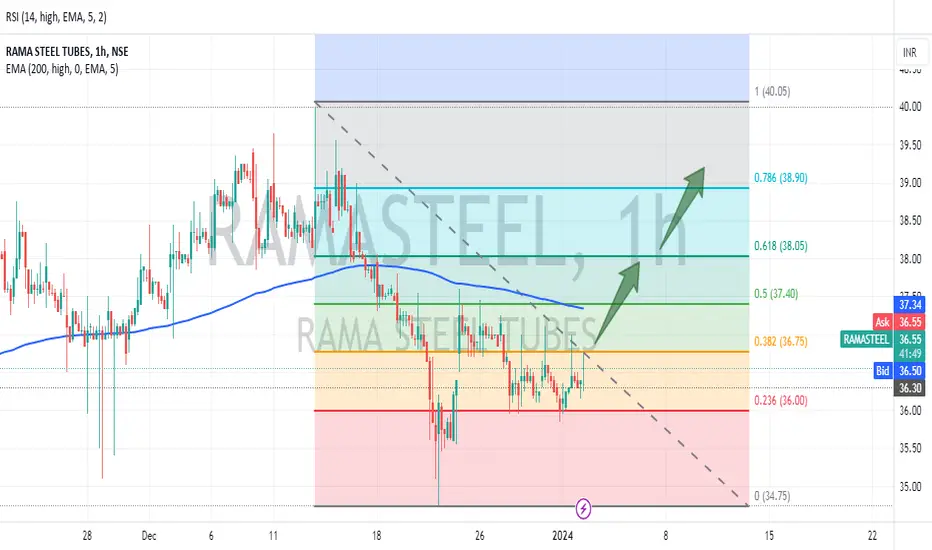
Fibonacci Retracement: The Fibonacci retracement levels have been drawn on the chart. These levels are often used to identify potential reversal points or support/resistance areas.
Moving Averages: The 200-day moving average (MA) is a long-term trend indicator. The price is currently above the 200-day MA, which is generally considered bullish.
Relative Strength Index (RSI): The RSI is a momentum oscillator. It is currently hovering around the neutral level of 50, indicating neither a strong overbought nor oversold condition.
Potential Scenarios
Breakout: If the price breaks above the upper channel with strong volume, it could signal a bullish breakout and a potential uptrend.
Breakdown: A break below the lower channel with strong volume could indicate a bearish breakdown and a potential downtrend.
Continued Consolidation: The stock may remain in a sideways trend for an extended period, waiting for a catalyst to break out of the range.
Trading Strategies and My Personal Opinion
Range Trading: Traders could attempt to profit from the sideways movement by buying near the lower channel and selling near the upper channel.
Breakout Trading: For more aggressive traders, waiting for a clear breakout or breakdown could offer potential trading opportunities.
Stop-Loss Orders: It's essential to use stop-loss orders to limit potential losses in case the trade moves against you.
Disclaimer: This analysis is based on technical indicators and does not consider fundamental factors such as company news, earnings, or industry trends. Always conduct a comprehensive analysis and conduct your own research or consult with a financial advisor before making investment decisions. I am not SEBI registered person
Thanks for your support as always

RAMASTEELHi guys,
In this chart i Found a Demand Zone in RAMASTEEL CHART for Positional entry,
Observed these Levels based on price action and Demand & Supply.
*Don't Take any trades based on this Picture.
... because this chart is for educational purpose only not for Buy or Sell Recommendation..
Thank you

RAMA STEEL TUBES - ENTRY POINTCan enter at CMP - 43₹
SL - 32
Targets - 50,60,70+
Disclaimer - All information on this page is for educational purposes only,
we are not SEBI Registered, Please consult a SEBI registered financial advisor for your financial matters before investing And taking any decision. We are not responsible for any profit/loss you made.
Request your support and engagement by liking and commenting & follow to provide encouragement
HAPPY TRADING 👍

RAMASTEEL: Momentum with Pullback and Upside Potential 📈🔄Title: "RAMASTEEL: Navigating Momentum with Anticipated Pullback and Upside Potential 📈🔄"
Description:
Embark on a strategic exploration of Ramasteel as we delve into the dynamics of an anticipated pullback, poised to fuel a potential upside move. In this analysis by NEOALGO, we uncover the intricacies that suggest momentum-building opportunities for discerning investors.
The prospect of a pullback in Ramasteel signifies a strategic entry point for investors seeking to capitalize on potential upside moves. As we navigate the nuances of market dynamics, this analysis sheds light on key indicators contributing to the optimistic outlook.
However, diligence is paramount. NEOALGO is not SEBI registered, and investors should conduct thorough research. Acknowledge that your decisions directly impact your profit or loss.
Stay informed, explore the momentum-building potential of RAMASTEEL, and make strategic investment decisions with confidence, guided by our detailed analysis. 🚀📉 #RAMASTEEL #PullbackOpportunities #UpsidePotential #StrategicAnalysis

RAMASTEEL BREAKOUTWeekly and Monthly Breakout with huge Volume.
Triangle pattern breakout.
Good for Short term.
Disclaimer : This is not a Buy or Sell recommendation. Please consult your financial advisor before making any investments . This is for Educational purpose only.

Rama steel This stock triangle pattern breakout with huge volume and TGT are 61.75, 73.45 and this is only for education purpose only

RAMASTEELStock name - Rama Steels Tubes Limited.
Weekly chart setup
Chart is self explanatory. Levels of breakout, possible up-moves (where stock may find resistances) and support (close below which, setup will be invalidated) are clearly defined.
Master Score - C
Great earnings are a positive sign for this stock. However, its price performance is lacking. You may want to keep it on your Watch List until the market confirms its strength.
Disclaimer: This is for demonstration and educational purpose only. this is not buying and selling recommendations. I am not SEBI registered. please consult your financial advisor before taking any trade.


RAMSTEEL on breakout... no trgets defined but can be in 3 digits soon... positional play with add on dips.
manage risk and money on own

RAMA Steel Tubes - Buying OpportunityAs per previous chart history and technical analysis, a buying opportunity has been seen in RAMA Steel Tubes , You can buy and make an average if it falls from 36.80
All major points are mentioned on the chart itself.
This is not investment advice and do your own research before buying any stock. I prepare charts on educational purposes.
Thanks for your continuous support
Rama steel looks goodRama steel can be looked at current price. Stock is at support level. can give upto 15 % return from here.
My Idea is for educational purpose.

RAMA STEEL TARGET 🎯 60 ₹Nearly in breakout stock,just keep eyes 👀 on
Technically strong breakout coming soon
SL may be 34 ₹
Disclaimer:
I am not sebi registered person, I am not giving buy or sell recommendation;I am just giving my personal opinion,please invest in your own risk .before taking any decision please consult your financial advisor .
I am not responsible for your financial loss take your own decision.
Thank you very much!!!💫

Rama steelLooks bullish above 39 and forming a good pattern on a daily Time frame.
Expecting a good move in this counter.
Keep this in your watch list.

Rama Steels - Long term BOLooks good after breaking out a long term trendline and monthly candle opening above the close of the previous candle and will be moving rapidly once it crosses 44.7
Keep an eye on this script
