RAMCOCEM
NSE:RAMCOCEM
Note :
1. One should go long with a Stop Loss, below the Trendline or the Previous Swing Low.
2. Risk :Reward ratio should be minimum 1:2.
3. Plan your trade as per the Money Mangement and Risk Appetite.
Disclamier :
>You are responsible for your profits and loss.
>The idea shared here is purely for Educational purpose.
>Follow back, for more ideas and their notifications on your email.
>Support and Like incase the idea works for you.
RAMCOCEM trade ideas
Long The Ramco Cements LTD . On 9/07/2025 I have shared this stock with all of you but very few people have seen this publish idea but today on 13/07/2025 I am sharing this stock with all of guys with weekely analysis of this stock. Its new target is 1450.
Ramco Cements in BreakoutNSE:RAMCOCEM in breakout. You can buy at 1072 and Target for 1140. Keep the Stop loss at 1050
Long TradeThe Ramco Cements This stock has broken out of cup&handle pattern and we can take a long trade in this stock at current CMP 1111 with SL of 3.5% and target will be 20% which we will achieve at point 1350.
Our profit ratio is 1:6.


Bulls entering cementClear breakout, crossed 50EMA, crossed strong resistance with good volume and big green candle. Has potential to break ATH.
Good to go longPlease do your own analysis and maintain your risk reward ratio.
This is only for the educational purposes

Ramco CementsCan be looked into with SL 909 entry once OBV gives breakout
TGT as per chart
Rising RSI, MACD

SWING IDEA - THE RAMCO CEMENTS Ramco Cements , one of India's leading cement manufacturers, is showing a promising swing trade setup with compelling technical signals.
Reasons are listed below :
Cup and Handle Pattern Breakout : The price is breaking out from a classic cup and handle pattern, which indicates a continuation of the upward trend.
1050 Resistance Zone : This level has been tested multiple times and is now showing signs of a breakout, suggesting strong bullish sentiment.
2.5+ Year Consolidation Break : The stock is emerging from a prolonged consolidation phase, which often signals a significant trend reversal or continuation.
Bullish Engulfing Candle : A bullish engulfing candle on the daily timeframe highlights strong buying momentum.
Target - 1150 // 1215 // 1340
Stoploss - weekly close below 925
DISCLAIMER -
Decisions to buy, sell, hold or trade in securities, commodities and other investments involve risk and are best made based on the advice of qualified financial professionals. Any trading in securities or other investments involves a risk of substantial losses. The practice of "Day Trading" involves particularly high risks and can cause you to lose substantial sums of money. Before undertaking any trading program, you should consult a qualified financial professional. Please consider carefully whether such trading is suitable for you in light of your financial condition and ability to bear financial risks. Under no circumstances shall we be liable for any loss or damage you or anyone else incurs as a result of any trading or investment activity that you or anyone else engages in based on any information or material you receive through TradingView or our services.
@visionary.growth.insights

Short RamcoForming Bearish Engulfing with follow on candle confirmation in D-TF
This kind of formation at Resistance levels earliers have give good follow through on the downside

Ramco Cements: Bullish Flag BreakoutNSE:RAMCOCEM Ramco Cements has recently given a bullish flag breakout at ₹1040, indicating a strong upward momentum in the stock. A bullish flag pattern is a continuation pattern that signifies the resumption of an uptrend after a brief consolidation phase. The breakout from this pattern suggests a renewed buying interest, backed by robust volumes.
Trading Setup:
Entry Price: ₹1040
Stop Loss: ₹987 (below the consolidation zone)
Targets:
First Target: ₹1072.10
Second Target: ₹1104.10
Third Target: ₹1136.10
Fourth Target: ₹1168.05
Final Target: ₹1200.05
Risk-Reward Ratio:
This trade setup offers a favorable risk-to-reward ratio of 1:3, making it an attractive opportunity for swing traders.
Key Observations:
The stock has been in an uptrend, supported by strong institutional buying.
The breakout is accompanied by above-average volumes, adding conviction to the move.
Key resistance levels are expected at the target prices, while the stop loss is strategically
placed below the recent consolidation range to minimize risk.
Recommendation:
Traders can consider buying Ramco Cements at ₹1040 for the above-mentioned targets. Ensure strict adherence to the stop loss of ₹987 to manage risk effectively.
Disclaimer: This analysis is for educational purposes only. Please conduct your own research or consult with a financial advisor before taking any trading or investment decisions.

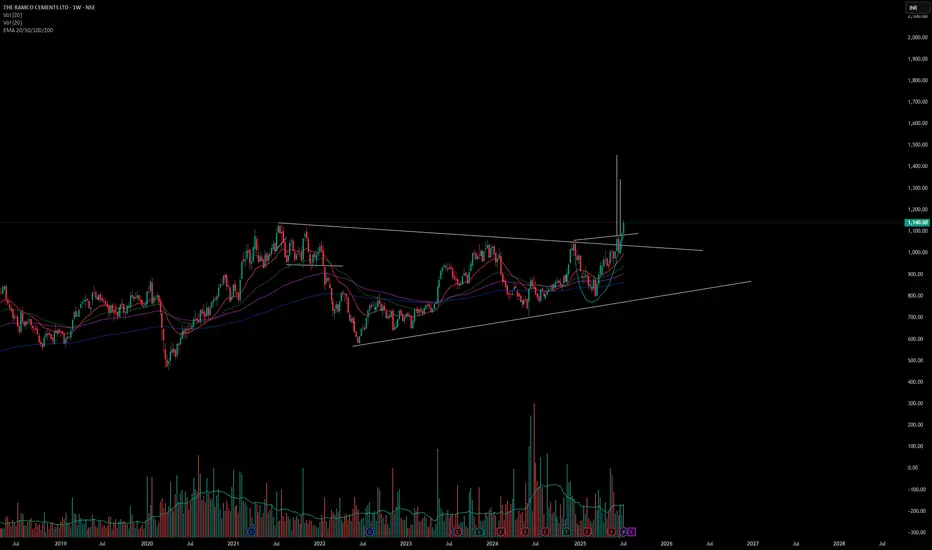
Weekly TF Analysis - RAMCOCEMStrong Weekly close on Ramco Cements.
Closing above 1055 would accelerate the move.
A retest on 1040 can be a possibility if the Momentum mellows down

THE RAMCO CEMENTS LTD Long TradeHello,
Trend-Based Analysis. Buy the Dips, Sell The Rallies, Also Following the Trend. Let's see where the Price Action takes us, Riding the wave. Potential trade setups based on trend momentum.
Technical analysis based on trend identification and momentum, Looking for high-probability setups within the prevailing trend.
Analyzing the current market trend and potential future price movement. Focusing on risk management and reward-to-risk ratios.
Details is Mentioned in Chart, Read carefully.. .

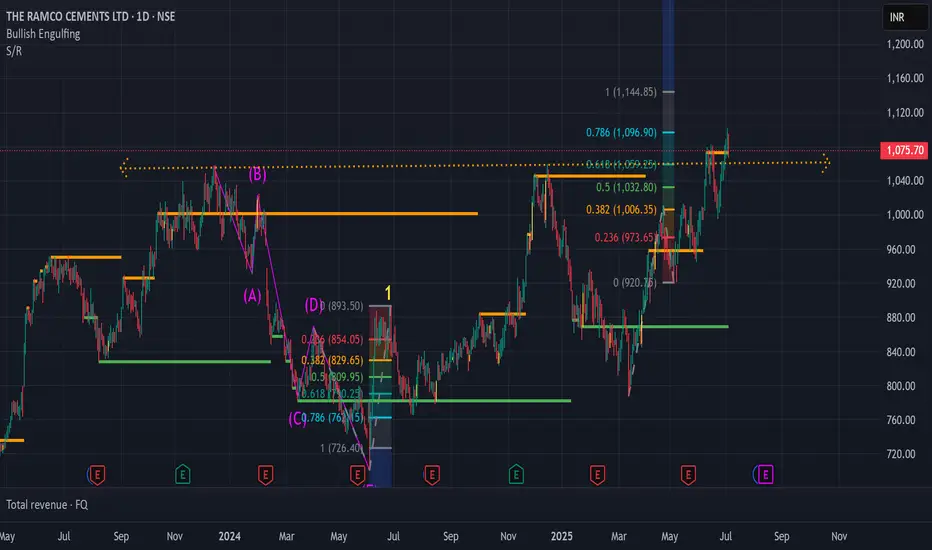
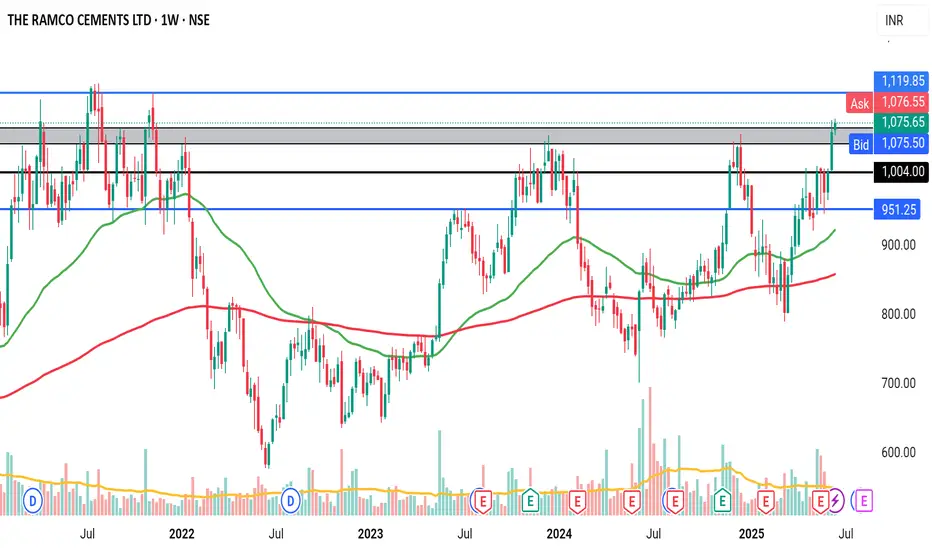
THE RAMCO CEMENTS LTD S/RSupport and Resistance Levels:
Support Levels: These are price points (green line/shade) where a downward trend may be halted due to a concentration of buying interest. Imagine them as a safety net where buyers step in, preventing further decline.
Resistance Levels: Conversely, resistance levels (red line/shade) are where upward trends might stall due to increased selling interest. They act like a ceiling where sellers come in to push prices down.
Breakouts:
Bullish Breakout: When the price moves above resistance, it often indicates strong buying interest and the potential for a continued uptrend. Traders may view this as a signal to buy or hold.
Bearish Breakout: When the price falls below support, it can signal strong selling interest and the potential for a continued downtrend. Traders might see this as a cue to sell or avoid buying.
20 EMA (Exponential Moving Average):
Above 20 EMA(50 EMA): If the stock price is above the 20 EMA, it suggests a potential uptrend or bullish momentum.
Below 20 EMA: If the stock price is below the 20 EMA, it indicates a potential downtrend or bearish momentum.
Trendline: A trendline is a straight line drawn on a chart to represent the general direction of a data point set.
Uptrend Line: Drawn by connecting the lows in an upward trend. Indicates that the price is moving higher over time. Acts as a support level, where prices tend to bounce upward.
Downtrend Line: Drawn by connecting the highs in a downward trend. Indicates that the price is moving lower over time. It acts as a resistance level, where prices tend to drop.
RSI: RSI readings greater than the 70 level are overbought territory, and RSI readings lower than the 30 level are considered oversold territory.
Combining RSI with Support and Resistance:
Support Level: This is a price level where a stock tends to find buying interest, preventing it from falling further. If RSI is showing an oversold condition (below 30) and the price is near or at a strong support level, it could be a good buy signal.
Resistance Level: This is a price level where a stock tends to find selling interest, preventing it from rising further. If RSI is showing an overbought condition (above 70) and the price is near or at a strong resistance level, it could be a signal to sell or short the asset.
Disclaimer:
I am not a SEBI registered. The information provided here is for learning purposes only and should not be interpreted as financial advice. Consider the broader market context and consult with a qualified financial advisor before making investment decisions.

The Ramco Cements Ltd view for Intraday 13th Nov #RAMCOCEM The Ramco Cements Ltd view for Intraday 13th Nov #RAMCOCEM
Resistance 915. Watching above 917 for upside movement...
Support area 900. Below 900 ignoring upside momentum for intraday
Support 900. Watching below 899 for downside movement...
Resistance area 915
Above 915 ignoring downside move for intraday
Charts for Educational purposes only.
Please follow strict stop loss and risk reward if you follow the level.
Thanks,
V Trade Point

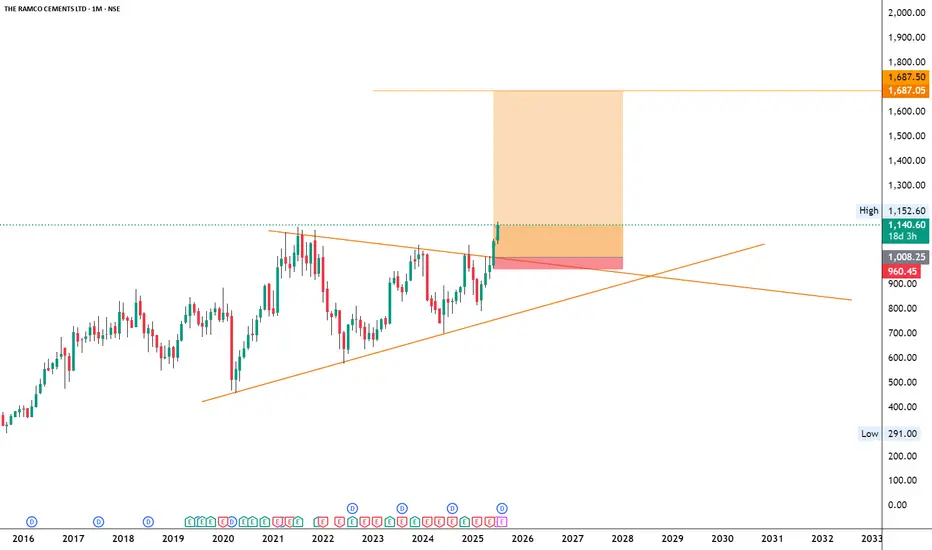
The Ramco Cements Ltd 1weekThe Ramco Cements Ltd is forming a bullish triangle pattern on the weekly time frame. I’m waiting for the price to break out of this pattern and then retest the breakout level, after which I expect the price to reach around 1600.
I'm not a SEBI-registered analyst. All posts and levels shared are just for educational purposes. I'm not responsible for any losses or profits. No claims, all rights reserved

50 SMA Rising- Positional TradeDisclaimer: I am not a Sebi registered adviser.
This Idea is publish purely for educational purpose only before investing in any stocks please take advise from your financial adviser.
Its 50 SMA Rising Strategy. Suitable for Positional Trading Initial Stop loss lowest of last 2 candles and keep trailing with 50 days SMA if price close below 50 SMA then Exit or be in the trade some time trade can go for several months.
Be Discipline because discipline is the Key to Success in the STOCK Market.
Trade What you see not what you Think

Ramco Cement Ramco cement may have formed a LD pattern on Ew basis & may have completed the correction.. The new run could be fast & we can expect 1100-1500 levels in the next 4-6 months..
Stop loss 780

Here Is a Trade Idea for The Ramco Cements Limited.Here Is a Trade Idea for The Ramco Cements Limited. Price is currently seen consolidating of daily Time frame Make sure to follow strict risk managements.

Ramco Cements Ltd intraday level for 19th Aug #RAMCOCERamco Cements Ltd intraday level for 19th Aug #RAMCOCEM
Buying may witness above 811
Support area 803. Below ignoring buying momentum for intraday
Selling may witness below 796
Resistance area 803. Above ignoring selling momentum for intraday
Charts for Educational purposes only.
Please follow strict stop loss and risk reward if you follow the level.
Thanks,
V Trade Point

The Ramco Cements Ltd intraday level for 13th Aug #RAMCOCEM The Ramco Cements Ltd intraday level for 13th Aug #RAMCOCEM
Buying may witness above 807
Support area 807. Below ignoring buying momentum for intraday
Selling may witness below 796
Resistance area 796 Above ignoring selling momentum for intraday
Charts for Educational purposes only.
Please follow strict stop loss and risk reward if you follow the level.
Thanks,
V Trade Point

The Ramco Cements Ltd intraday level for 8th Aug #RAMCOCEMThe Ramco Cements Ltd intraday level for 8th Aug #RAMCOCEM
Buying may witness above 826
Support area 816. Below ignoring buying momentum for intraday
Selling may witness below 809
Resistance area 816 Above ignoring selling momentum for intraday
Charts for Educational purposes only.
Please follow strict stop loss and risk reward if you follow the level.
Thanks,
V Trade Point

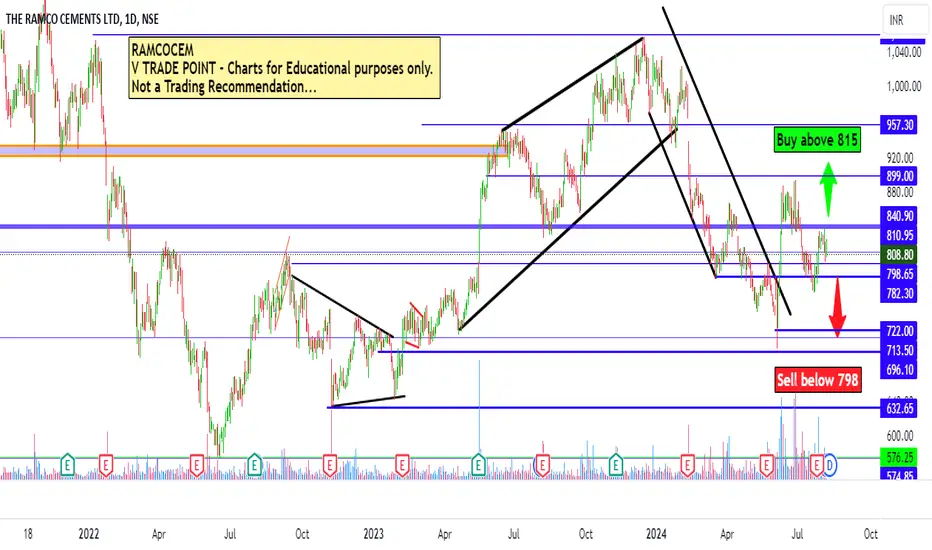
The Ramco Cements Ltd intraday level for 7th Aug #RAMCOCEMThe Ramco Cements Ltd intraday level for 7th Aug #RAMCOCEM
Buying may witness above 815
Support area 800-805. Below ignoring buying momentum for intraday
Selling may witness below 798
Resistance area 805-810. Above ignoring selling momentum for intraday
Charts for Educational purposes only.
Please follow strict stop loss and risk reward if you follow the level.
Thanks,
V Trade Point