RCFRCF
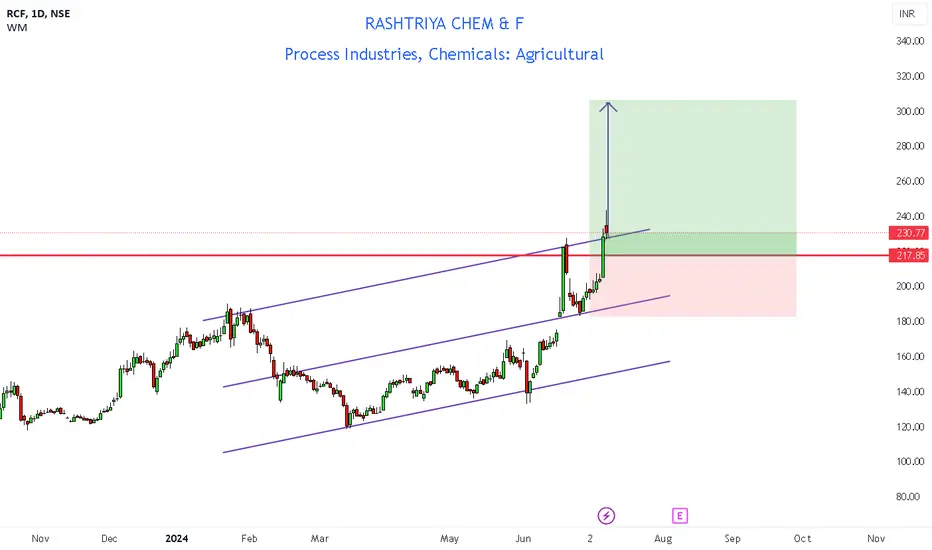
watch above levels. green line is our entry, redline is our SL.
DISCLAIMER : I am NOT a SEBI registered advisor or a financial adviser. All the views are for educational purpose only.
RCF trade ideas

RCF Report
📆 Monthly Time Frame:
📍 Price Action: Price is currently at a major support zone.
🔄 Trend Analysis: Downtrend (Dow Theory) remains intact.
📉 Moving Average: Price is near the 50 EMA.
🔍 Analysis: Price is not strongly bearish but not yet bullish. This zone might indicate a potential trend reversal in the upcoming sessions.
📆 Weekly Time Frame:
📍 Price Action: Price is near the 200 EMA.
🔄 Trend Status: No strong bearish momentum.
🔍 Analysis: Price shows signs of potential reversal. We need to look for a bullish setup in lower time frames.
📆 Daily Time Frame:
📈 Key Candlestick Patterns:
🛠️ 12th Feb: Hammer candle with a low of 132.36.
🔄 13th Feb: Inverted hammer at bottom – possible bullish reversal signal.
📉 14th Feb: Bearish candle with good volume, but closing above 132.36, indicating bulls’ presence.
🔍 Analysis: The past three days' price action suggests buyers are defending the support zone.
⏰ Hourly Time Frame:
🛑 Double Bottom: Pattern with bullish divergence observed.
📊 RSI Status: RSI is below 40; we need a close above 40 to confirm bullish swing setup.
🔍 Trade Setup:
🛒 Entry: Upon RSI closing above 40 on the hourly time frame.
📍 Stop Loss: 132.99 (Hourly Closing Basis)
🎯 Target 1: 147 (Risk-Reward Ratio: 1:6)
🎯 Target 2: 162
⚖️ CMP: 135
Conclusion:
RCF shows potential for a trend reversal across multiple time frames. Confirmation of RSI above 40 in the hourly chart will provide a low-risk entry opportunity with attractive risk-reward potential. Patience is essential to let the setup mature for the best results.
📈 Recommendation: Wait for RSI to close above 40 in the hourly time frame and then consider entering the trade with the defined risk and reward targets.

RCF testing support lineRCF is converging testing 2 trendline and can easily reach 149-147 and move up in near time

(RCF) is Poised for a Breakout: Watch These Key Levels!Rashtriya Chemicals & Fertilizers Ltd. (RCF) stock is showing promising technical setups as it consolidates near critical resistance. With strong price action and a trendline acting as support, the stage may be set for an upward breakout.
Key Levels and Setup
📈 Support Trendline: The stock has consistently respected an upward trendline starting from ₹155. This serves as a strong base for further price action.
📌 Immediate Resistance: ₹183-188 is the immediate level to watch. A breakout above this zone could trigger significant bullish momentum.
🚀 Upside Targets:
Target 1: ₹205
Target 2: ₹240
📉 Stop-loss: To manage risk, a stop-loss can be placed below ₹175 (near the base of recent consolidation).
Trading Plan
Breakout Confirmation: Look for a daily close above ₹188 with volume to confirm the breakout.
Retest Entry: If the stock retests ₹188 as support, it could be an ideal entry point for a low-risk trade.
Volume and Momentum
Watch for an increase in trading volume as the stock approaches ₹188. High volume during the breakout will strengthen the bullish case.
⚠️ This is not financial advice. Always perform your own analysis before entering any trade.
💬 Do you think RCF will reach ₹240? Share your thoughts below!
🚀📊 #RCF #TechnicalAnalysis #StockBreakout #TradingSetup

A look at RCF..A look at RCF..
SL 150
Target 194, 240
Stock following channel
Double bottom on daily TF
Goverement might be pushing for fertilizer consumptions (in next budget, market already assuming same.)


RCF looks good for 240++Seems like stock got support at 215 levels
can bounce back to resistance area240
target 240++
stoploss 200
vol avg now
needs a good volume for rally(expects)
agro chem theme
Rashtriya Chemicals & Fertilizers is a public sector undertaking (PSU) with 75% stake owned by GOI. Company is engaged in manufacturing and marketing of fertilizers and industrial chemicals.

SWING IDEA - RCFMACD Cross is in play.
Volume has increased a lot this week.
1Y Beta is @ 1.78, which is very good for this stock.
This week could be your Entry week if stock retest levels mentioned on chart. Good change it might too.
Overall looks good till Swing High.

RCF GIVES BRAKEOUT ON DAILY CHARTNSE:RCF
RCF GIVES BRAKEOUT ON DAILY CHART.
I am buying some quantity of Rcf on price 230 and i will bought some quantity on 218.
i will follow SL of 180
and i will set my target on 295,310.
i think in next 1 month i will get my targets.

RCF BUYRCF BUY VIEW
TRADE REASON :
1)MONTHLY - Uptrend Correction Completed
2)DAY - Trend Reversal
Entry - 147.50 Rs
Target - 180.95 Rs
Stoploss - 118.40 Rs
Happy Trading .

RCF GIVES BRAKEOUT ON DAILY CHARTNSE:RCF
RCF Gives brake out on daily chart.
Buy Near 170
Sl 148
Target 212
Time duration 1 month
Risk Reward Ratio ---- 1 : 2
Profit on capital Ratio ---- 20%+

RCF BRAKEOUT ON DAILY CHARTNSE:RCF
RCF gives double brake out daily chart.
Buy price 154
Sl 140
Target 185

Trendline Breakout RCF ready to break the trendline on weekly chart if closes above 163. Short term targets will be 170,185,190. Keep in radar. Entry only if weekly closing above 163.

Elliot's impulsive 5-wave formation with trendline support #Freshview Dt 25.04.2024
#RCF CMP 150+
Weekly chart
Elliot's impulsive 5-wave formation with trendline support
Accumulate in SIP
Price Momentum
120-136-152-164-186-216-230+
Hope for the best.
Stay Connected
#TEJGYAN

Swing and positional trade (educational prupose only)Stoc has given multiyear break out and now restesting its breaout on monthly time frame.
For positional trade : target could be as high as 50 to 60% ( beware it will not go up in straight line, ther will be ups and downs)
For Swing : Target around 200 approx
Two ways to plan trade :
1 stock has given 50 EMA breakout and retested level. You can buy at high of retest candle
2. Its following upword channel and currenly at bottom of the channel. Target could be arounf 200 (upper intersection of the channel)
Please do your own due diligence. Cheers !!!

RCF - GO LongCompany has given the Monthly and Weekly BO and is ready for the further momentum. Stock can be traded based on swing analysis. Fundamentals are ok not like Deepak Fertilizer

RCF MONTHLY CHARTRCF MONTHLY CHART
Ellipse breakout @ 133 MOB 225-235
This stock has broken out of its monthly ellipse @ 133, Target projected as seen by MOB.
Note : Ellipse is calculated by combination of technical studies. MOB levels too are technical studies.
Its only an observation & not any suggestion.

15 years breakout#RCE
• monthly chart analysis
• budget session: this stock is in focus
• breakout 2008 high level
• 15-year breakout in chart
• 2008 volume build-in chart but global crisis hit stock badly
• ascending triangle pattern breakout
• 2022-2023: massive volume in chart
• this volume helps to breakout chart 🐂
• Target and Stop losses mentioned in chart
• we never recommend buying and sell any charts and this stock is also
• More, please check the chart all mentions in that

RCF Ready to Rally?Simple analysis No Confusion! I have marked levels and targets on charts and i hope they are self explanatory, looking at the volume build up in this scrip it should easily close above 151.95(monthly time frame candle).
Looking at the financials of this scrip, RCF had significantly reduced their Debts from past few years, this looks very attractive for investors and as per price action and Volume build up this stock and easily rally above the levels marked in the chart, its looking good for short term investment for a period 1 to 1.5 years.
Analyze as per your view and invest accordingly for best returns.

rcf Indian government seeks parliament's approval to spend additional 133.51 billion rupees ($1.60 billion) for fertiliser subsidy for current fiscal year
** Additional fertiliser subsidies to raise the total subsidy for fiscal 2024 by 8% year-on-year to 1.88 trillion rupees
** Rise in subsidy will likely help fertiliser companies' volume growth


RCF SWING TRADE IDEARCF ascending broadening channel and all time high breakout done today with strong bullish candle and gud volume bar can play this for swing trade with gud RR.
