REC correctionREC shows correction ending here for the next impulse on wave 5. as the price moves upside clearing the hurdles of the daily averages and gains momentum would be a good indication that the correction pattern is valid. always protecting the capital would be first target during investing in capital markets
RECLTD trade ideas

REC Ltd bulish butterffly pattern REC Ltd bulish butterffly pattern cmp 441 on 09.02.2025 ... as per the price action looking bulish and shortly reach the marked target ..

RECLTD swing tradeHello,
Trend-Based Analysis. Buy the Dips, Sell The Rallies, Also Following the Trend. Let's see where the Price Action takes us, Riding the wave. Potential trade setups based on trend momentum.
Technical analysis based on trend identification and momentum, Looking for high-probability setups within the prevailing trend.
Analyzing the current market trend and potential future price movement. Focusing on risk management and reward-to-risk ratios.
Details is Mentioned in Chart, Read carefully.. .


Rec Ltd view for Intraday 8th October #RECLTD Rec Ltd view for Intraday 8th October #RECLTD
Buying may witness above 506
Support area 500-501. Below ignoring buying momentum for intraday
Selling may witness below 496
Resistance area 500-501
Above ignoring selling momentum for intraday
Charts for Educational purposes only.
Please follow strict stop loss and risk reward if you follow the level.
Thanks,
V Trade Point

Rec Ltd view for Intraday 26th September #RECLTD Rec Ltd view for Intraday 26th September #RECLTD
Buying may witness above 552
Support area 545. Below ignoring buying momentum for intraday
Selling may witness below 539
Resistance area 545
Above ignoring selling momentum for intraday
Charts for Educational purposes only.
Please follow strict stop loss and risk reward if you follow the level.
Thanks,
V Trade Point

Rec Ltd view for Intraday 24th September #RECLTD Rec Ltd view for Intraday 24th September #RECLTD
Buying may witness above 545
Support area 535. Below ignoring buying momentum for intraday
Selling may witness below 529
Resistance area 535
Above ignoring selling momentum for intraday
Charts for Educational purposes only.
Please follow strict stop loss and risk reward if you follow the level.
Thanks,
V Trade Point

Rec Ltd view for Intraday 23rd September #RECLTD Rec Ltd view for Intraday 23rd September #RECLTD
Buying may witness above 544
Support area 535. Below ignoring buying momentum for intraday
Selling may witness below 529
Resistance area 535
Above ignoring selling momentum for intraday
Charts for Educational purposes only.
Please follow strict stop loss and risk reward if you follow the level.
Thanks,
V Trade Point

RECLTDInverted Cup - Target 742
Triangle Out put (CD) is declining the Price instead of raising the price.
Expecting the fall equal to BC -525.
Based on the Triangle (AB) price will bullish up to 740.
Hence Target- 740

REC to look for a 10% bounce off here?REC LTD is showing potential as it attempts a bounce off the lower trendline of its falling channel, with targets set at 577-592 and a long-term goal of 616. Invalidation of the bull view occurs below 541. REC LTD, a key player in India’s power sector, finances and promotes renewable energy projects, making it a solid prospect in a growing industry. With a focus on infrastructure development and sustainable energy, the company is well-positioned for future growth. Keeping an eye on the price action as momentum builds!

REC LTD 1DThis stock has the potential to surpass its all-time high
I'm not a SEBI-registered analyst. All posts and levels shared are just for educational purposes. I'm not responsible for any losses or profits. No claims, all rights reserved

REC : FVG 540 is a key for re-entryGo Long setup:
Look for reversal price action around 540-520 zone that represent FVG on Daily TF.
These are the levels where we get the confluence of Downside mirror move and the FVGs

REC LTD S/RSupport and Resistance Levels:
Support Levels: These are price points (green line/share) where a downward trend may be halted due to a concentration of buying interest. Imagine them as a safety net where buyers step in, preventing further decline.
Resistance Levels: Conversely, resistance levels (red line/shade) are where upward trends might stall due to increased selling interest. They act like a ceiling where sellers come in to push prices down.
Breakouts:
Bullish Breakout: When the price moves above resistance, it often indicates strong buying interest and the potential for a continued uptrend. Traders may view this as a signal to buy or hold.
Bearish Breakout: When the price falls below support, it can signal strong selling interest and the potential for a continued downtrend. Traders might see this as a cue to sell or avoid buying.
20 EMA (Exponential Moving Average):
Above 20 EMA: If the stock price is above the 20 EMA, it suggests a potential uptrend or bullish momentum.
Below 20 EMA: If the stock price is below the 20 EMA, it indicates a potential downtrend or bearish momentum.
Trendline: A trendline is a straight line drawn on a chart to represent the general direction of a data point set.
Uptrend Line: Drawn by connecting the lows in an upward trend. Indicates that the price is moving higher over time. Acts as a support level, where prices tend to bounce upward.
Downtrend Line: Drawn by connecting the highs in a downward trend. Indicates that the price is moving lower over time. It acts as a resistance level, where prices tend to drop.
RSI: RSI readings greater than the 70 level are overbought territory, and RSI readings lower than the 30 level are considered oversold territory.
Combining RSI with Support and Resistance:
Support Level: This is a price level where a stock tends to find buying interest, preventing it from falling further. If RSI is showing an oversold condition (below 30) and the price is near or at a strong support level, it could be a good buy signal.
Resistance Level: This is a price level where a stock tends to find selling interest, preventing it from rising further. If RSI is showing an overbought condition (above 70) and the price is near or at a strong resistance level, it could be a signal to sell or short the asset.
Disclaimer:
I am not a SEBI registered. The information provided here is for learning purposes only and should not be interpreted as financial advice. Consider the broader market context and consult with a qualified financial advisor before making investment decisions.

REC Ltd shows a breakout-pullbackREC Ltd NSE:RECLTD shows a breakout-pullback. You can buy at current Price 600.
1st Target would be 800 and 2nd Target would be 945( which you can try achieving using GTT)

Rec Ltd intraday level for 1st Aug #RECLTD Rec Ltd intraday level for 1st Aug #RECLTD
Buying may witness above 651
Support area 640-643. Below ignoring buying momentum for intraday
Charts for Educational purposes only.
Please follow strict stop loss and risk reward if you follow the level.
Thanks,
V Trade Point

Rec Ltd Intraday level for 31st July #RECLTD Rec Ltd Intraday level for 31st July #RECLTD
Buying may witness above 651
Support area 642-645. Below ignoring buying momentum for intraday
Charts for Educational purposes only.
Please follow strict stop loss and risk reward if you follow the level.
Thanks,
V Trade Point

Rec Ltd Intraday level for 30th July #recRec Ltd Intraday level for 30th July #rec
Buying may witness above 648
Support area 640. Below ignoring buying momentum for intraday
Charts for Educational purposes only.
Please follow strict stop loss and risk reward if you follow the level.
Thanks,
V Trade Point

Trading Strategy for REC Ltd. (NSE: RECLTD)
Analysis:
1. Trend: The stock is currently in a downward channel as indicated by the parallel lines. This suggests a bearish trend in the short term.
2. Support Levels:
- Strong support is present around the 600 mark, which coincides with the current price level.
- Another key support level is at 575.
3. Resistance Levels:
- Immediate resistance is around 610.
- The next major resistance level is around 625-640.
Volume:
- The volume has been significant, especially during the drop, indicating strong selling pressure.
Strategy:
1. Entry Point:
- Consider entering a long position if the stock shows signs of reversal or consolidation around the 600 support level.
- Alternatively, if the stock breaks below 598 with significant volume, it might be wise to wait for it to approach the next support at 575.
2. Stop Loss:
- Set a tight stop loss around 595 to limit potential losses.
3. Targets:
- First target would be around 610 (immediate resistance).
- If the stock breaks above 610 with volume, the next target is 625-640.
Conclusion:
- The stock is in a downtrend but is approaching a critical support level at 600. Monitoring the price action around this level is crucial.
- Entering a long position with a stop loss at 595 and targeting 610 initially is a prudent strategy.
- If the support at 600 fails, look for opportunities closer to 575.
Note: Always consider the overall market conditions and use proper risk management techniques when trading.

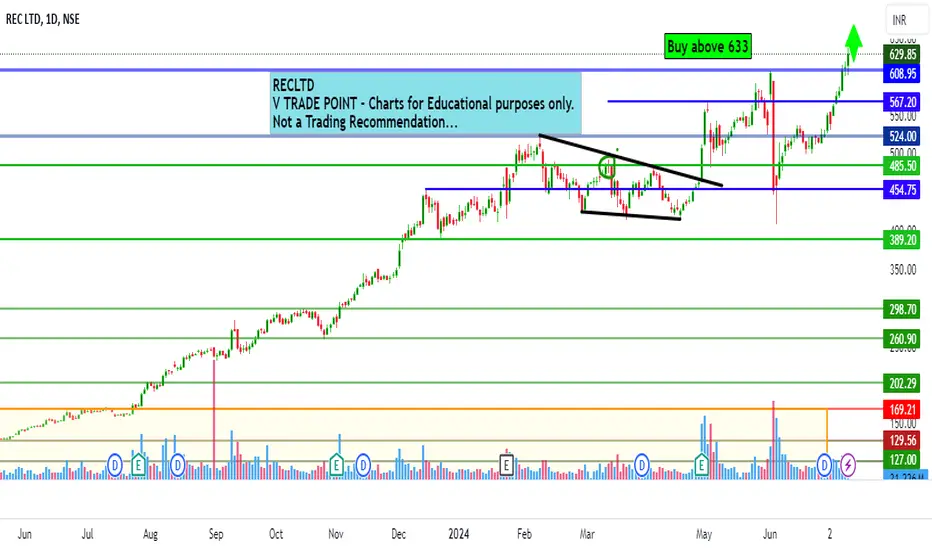
Rec Ltd Intraday level for 11th July #RECLTD Rec Ltd Intraday level for 11th July #RECLTD
Buying opportunity above 633
Support area 625. Below ignoring buying opportunity
Charts for Educational purposes only.
Please follow strict stop loss and risk reward if you follow the level.
Thanks,
V Trade Point
REC Ltd: Breakout on Strong VolumeREC Ltd has successfully broken through a key resistance level with strong volume, indicating a potential for further upward movement. The stock shows significant bullish momentum, supported by the high trading volume, which confirms the reliability of this breakout. Traders should watch for continued strength in the coming sessions. Proper risk management is essential, with attention to support levels below the breakout. Stay updated as we track this promising setup.

Sounds like a breakout retest for RECltdsounds like a good support. Good chance to accumulate this beautiful share which has not give much chance for investors.

Review and plan for 4th July 2024 Nifty future and banknifty future analysis and intraday plan in kannada.
This video is for information/education purpose only. you are 100% responsible for any actions you take by reading/viewing this post.
please consult your financial advisor before taking any action.
----Vinaykumar hiremath, CMT

Review and plan for 3rd July 2024 Nifty future and banknifty future analysis and intraday plan in kannada.
This video is for information/education purpose only. you are 100% responsible for any actions you take by reading/viewing this post.
please consult your financial advisor before taking any action.
----Vinaykumar hiremath, CMT
