REDINGTON✅ Redington Buy Trade Setup
Parameter Value
Entry 287
Stop Loss (SL) 278
Risk 9 pts
Reward 88 pts
Target Price 375
Risk:Reward (RR) 9.8
📍 Other Key Levels
Metric Value
Last High 327
Last Low 279
Point Variance 48
🔎 Interpretation & Trade Insights
🔼 Trend Confirmation: Every timeframe shows an uptr
Next report date
—
Report period
—
EPS estimate
—
Revenue estimate
—
20.90 INR
16.05 B INR
993.34 B INR
584.30 M
About REDINGTON LTD
Sector
Industry
CEO
Vishnampet Sethu Hariharan
Website
Headquarters
Chennai
Founded
1961
ISIN
INE891D01026
FIGI
BBG000QRLXC2
Redington Ltd. provision of machinery, equipment and supplies. It includes computers, computer peripheral equipment, software, electronic, and telecommunications equipment and parts. It operates through the India, and Overseas segments. The company was founded by Ramanathan Srinivasan on May 2, 1961 and is headquartered in Chennai, India.
No news here
Looks like there's nothing to report right now

REDINGTONNSE:REDINGTON
Note :
1. One should go long with a Stop Loss, below the Trendline or the Previous Swing Low.
2. Risk :Reward ratio should be minimum 1:2.
3. Plan your trade as per the Money Management and Risk Appetite.
Disclaimer :
>You are responsible for your profits and loss.
>The idea share

Redington Ltd - Breakout StockRedington Ltd is showing strong price action and is currently positioned as a breakout stock. The stock has surged above key resistance levels with supportive volume, indicating potential for further upside momentum.
📊 Traders and investors may consider keeping this stock on their watchlist for pot

Redington - Uptrend in Progress!📈 NSE:REDINGTON
🔹 Current Price: ₹243.97 (+0.43%)
🔹 Support Zone: ₹240
🔹 Target Price: ₹323
✅ Stock following an ascending trendline
✅ Retesting breakout zone – bullish momentum expected
✅ Gradual higher highs indicate strong buying interest
🚀 Potential for a rally towards ₹323 if support ho

Breakout Stock Redington Limited has recently exhibited a technical breakout, surpassing key resistance levels with notable trading volume. Technical indicators such as the Relative Strength Index (RSI) and Moving Average Convergence Divergence (MACD) suggest a strong bullish momentum. The stock's price has consis


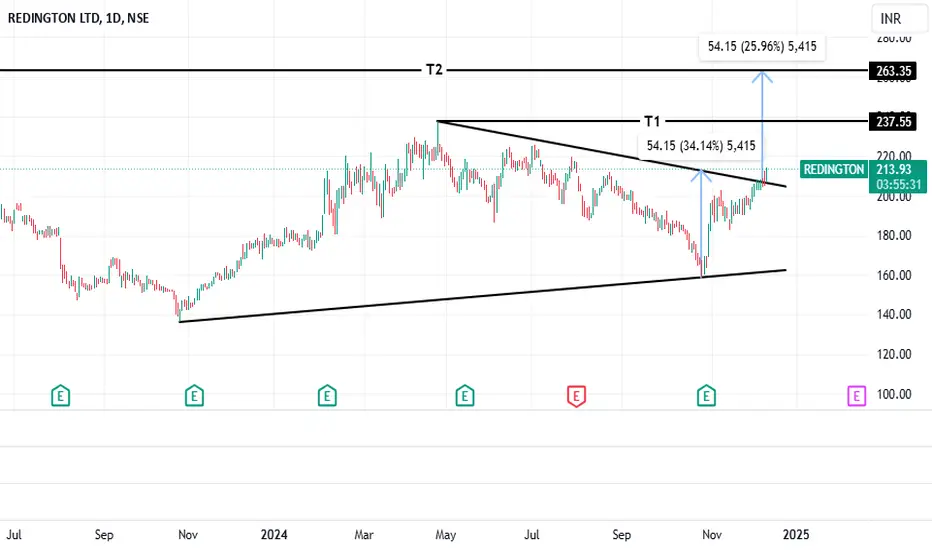
REDINGTON--portfolio stock redington is making inverse head and shoulder formation ( complex) .and on breakout at 215 stock to make new high with breakout trg of 244 . management has given guidance of 20-25% growth every year for next 2 years low PE high dividend yield stock. 5th wave trg of 260 is in range and can get exte

See all ideas
Summarizing what the indicators are suggesting.
Neutral
SellBuy
Strong sellStrong buy
Strong sellSellNeutralBuyStrong buy
Neutral
SellBuy
Strong sellStrong buy
Strong sellSellNeutralBuyStrong buy
Neutral
SellBuy
Strong sellStrong buy
Strong sellSellNeutralBuyStrong buy
An aggregate view of professional's ratings.
Neutral
SellBuy
Strong sellStrong buy
Strong sellSellNeutralBuyStrong buy
Neutral
SellBuy
Strong sellStrong buy
Strong sellSellNeutralBuyStrong buy
Neutral
SellBuy
Strong sellStrong buy
Strong sellSellNeutralBuyStrong buy
Displays a symbol's price movements over previous years to identify recurring trends.
Frequently Asked Questions
The current price of REDINGTON is 240.15 INR — it has increased by 1.93% in the past 24 hours. Watch REDINGTON LTD stock price performance more closely on the chart.
Depending on the exchange, the stock ticker may vary. For instance, on NSE exchange REDINGTON LTD stocks are traded under the ticker REDINGTON.
REDINGTON stock has fallen by −5.37% compared to the previous week, the month change is a −19.88% fall, over the last year REDINGTON LTD has showed a 20.01% increase.
We've gathered analysts' opinions on REDINGTON LTD future price: according to them, REDINGTON price has a max estimate of 310.00 INR and a min estimate of 170.00 INR. Watch REDINGTON chart and read a more detailed REDINGTON LTD stock forecast: see what analysts think of REDINGTON LTD and suggest that you do with its stocks.
REDINGTON reached its all-time high on Jun 30, 2025 with the price of 334.80 INR, and its all-time low was 7.97 INR and was reached on Feb 26, 2009. View more price dynamics on REDINGTON chart.
See other stocks reaching their highest and lowest prices.
See other stocks reaching their highest and lowest prices.
REDINGTON stock is 2.66% volatile and has beta coefficient of 1.32. Track REDINGTON LTD stock price on the chart and check out the list of the most volatile stocks — is REDINGTON LTD there?
Today REDINGTON LTD has the market capitalization of 184.15 B, it has decreased by −2.88% over the last week.
Yes, you can track REDINGTON LTD financials in yearly and quarterly reports right on TradingView.
REDINGTON LTD is going to release the next earnings report on Nov 11, 2025. Keep track of upcoming events with our Earnings Calendar.
REDINGTON LTD revenue for the last quarter amounts to 259.52 B INR, despite the estimated figure of 243.81 B INR. In the next quarter, revenue is expected to reach 287.72 B INR.
REDINGTON net income for the last quarter is 2.75 B INR, while the quarter before that showed 6.66 B INR of net income which accounts for −58.64% change. Track more REDINGTON LTD financial stats to get the full picture.
Yes, REDINGTON dividends are paid annually. The last dividend per share was 6.80 INR. As of today, Dividend Yield (TTM)% is 2.89%. Tracking REDINGTON LTD dividends might help you take more informed decisions.
REDINGTON LTD dividend yield was 2.80% in 2024, and payout ratio reached 33.13%. The year before the numbers were 2.98% and 39.77% correspondingly. See high-dividend stocks and find more opportunities for your portfolio.
As of Aug 13, 2025, the company has 12.79 K employees. See our rating of the largest employees — is REDINGTON LTD on this list?
EBITDA measures a company's operating performance, its growth signifies an improvement in the efficiency of a company. REDINGTON LTD EBITDA is 20.82 B INR, and current EBITDA margin is 2.30%. See more stats in REDINGTON LTD financial statements.
Like other stocks, REDINGTON shares are traded on stock exchanges, e.g. Nasdaq, Nyse, Euronext, and the easiest way to buy them is through an online stock broker. To do this, you need to open an account and follow a broker's procedures, then start trading. You can trade REDINGTON LTD stock right from TradingView charts — choose your broker and connect to your account.
Investing in stocks requires a comprehensive research: you should carefully study all the available data, e.g. company's financials, related news, and its technical analysis. So REDINGTON LTD technincal analysis shows the sell today, and its 1 week rating is sell. Since market conditions are prone to changes, it's worth looking a bit further into the future — according to the 1 month rating REDINGTON LTD stock shows the buy signal. See more of REDINGTON LTD technicals for a more comprehensive analysis.
If you're still not sure, try looking for inspiration in our curated watchlists.
If you're still not sure, try looking for inspiration in our curated watchlists.