REDINGTON✅ Redington Buy Trade Setup
Parameter Value
Entry 287
Stop Loss (SL) 278
Risk 9 pts
Reward 88 pts
Target Price 375
Risk:Reward (RR) 9.8
📍 Other Key Levels
Metric Value
Last High 327
Last Low 279
Point Variance 48
🔎 Interpretation & Trade Insights
🔼 Trend Confirmation: Every timeframe shows an uptrend, which confirms directional conviction.
🎯 Entry Zone Strength: Your entry at 287 sits well within the Daily & Intraday demand zones (278–297), suggesting strong support below.
🛡️ Tight SL: A very tight SL of 278, right at the confluence of multiple zones. This minimizes risk.
📈 High R:R Ratio: With a Risk:Reward of 9.8, this is an excellent asymmetric setup—ideal for swing or positional trading.
💡 Target of 375 is significantly above the last high (327), which means price will need to break out to fresh highs for full realization. Keep an eye on price action near 325–330 zone for profit booking or SL trailing.
⚙️ Suggestions for Execution
🔁 Trail SL: Once price hits above 310, consider adjusting SL to entry (287) or slightly above to lock in gains.
🧱 Watch Resistance: 327 (previous high) could act as short-term resistance.
📊 Volume Confirmation: If volume expands above 300, it would strengthen breakout potential toward 350+.
📊 Demand Zone Summary
🕰️ High Time Frame (HTF)
Timeframe Logic Proximal Distal Avg
Yearly Support 225 173 199
Half-Yearly RBR Pattern 215 173 194
Quarterly BUFL + Breakout 211 173 192
HTF Avg 217 173 195
📆 Medium Time Frame (MTF)
Timeframe Logic Proximal Distal Avg
Monthly Support 300 175 238
Weekly Support 300 278 289
Daily BUFL/DMIP 287 278 283
MTF Avg 296 244 270
⏱️ Intraday Time Frame (ITF)
Timeframe Logic Proximal Distal Avg
240 Min DMIP 293 278 286
180 Min DMIP 297 278 288
60 Min DMIP 294 278 286
ITF Avg 295 278 286
REDINGTON trade ideas

REDINGTONNSE:REDINGTON
Note :
1. One should go long with a Stop Loss, below the Trendline or the Previous Swing Low.
2. Risk :Reward ratio should be minimum 1:2.
3. Plan your trade as per the Money Management and Risk Appetite.
Disclaimer :
>You are responsible for your profits and loss.
>The idea shared here is purely for Educational purpose.
>Follow back, for more ideas and their notifications on your email.
>Support and Like incase the idea works for you.

Redington Ltd - Breakout StockRedington Ltd is showing strong price action and is currently positioned as a breakout stock. The stock has surged above key resistance levels with supportive volume, indicating potential for further upside momentum.
📊 Traders and investors may consider keeping this stock on their watchlist for potential swing opportunities, subject to market conditions and proper risk management.

Redington - Uptrend in Progress!📈 NSE:REDINGTON
🔹 Current Price: ₹243.97 (+0.43%)
🔹 Support Zone: ₹240
🔹 Target Price: ₹323
✅ Stock following an ascending trendline
✅ Retesting breakout zone – bullish momentum expected
✅ Gradual higher highs indicate strong buying interest
🚀 Potential for a rally towards ₹323 if support holds!
For study purpose ONLY. Never a Buy/Sell Reccomendation❌
#Redington #StockMarketIndia #Trading #BreakoutStocks

Breakout Stock Redington Limited has recently exhibited a technical breakout, surpassing key resistance levels with notable trading volume. Technical indicators such as the Relative Strength Index (RSI) and Moving Average Convergence Divergence (MACD) suggest a strong bullish momentum. The stock's price has consistently remained above its 20-day Simple Moving Average (SMA), reinforcing the upward trend. Additionally, the Average Directional Index (ADX) indicates a strengthening trend, while the Chaikin Money Flow (CMF) points to increased buying pressure. These factors collectively highlight Redington as a compelling opportunity for investors seeking momentum-driven growth.

Redington India LtdRedington India Ltd
CMP 231
Almost at crucial breakout zone
Tested 5 times resistance zone
Strong volume

RedingtonRedington its in a bullish pattern. Looks good positionally. Potential fr a 10% upmove fr a new high!

REDINGTONREDINGTON giving breakout with decent volume. This is the 2nd attempt nr 220 levels. There is v high probability that this time it will cross resistance abv 230 and may start new rally hereon. Keep it on radar.

REDINGTON--portfolio stock redington is making inverse head and shoulder formation ( complex) .and on breakout at 215 stock to make new high with breakout trg of 244 . management has given guidance of 20-25% growth every year for next 2 years low PE high dividend yield stock. 5th wave trg of 260 is in range and can get extended.

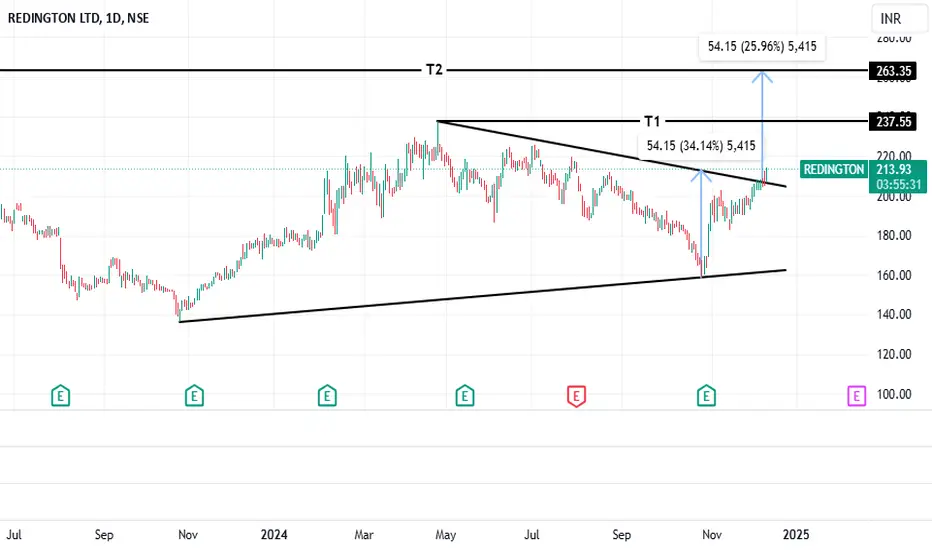
#Redington Ltd Redington Ltd break out Symmetrical Tirangle Pattern
Entry :- Above 210
Stop Loss :- 185
go longcandle closed above the trendline and the nearest resistance its good to go long with proper SL

Redington looking red hot. Redington Ltd. provision of machinery, equipment and supplies. It includes computers, computer peripheral equipment, software, electronic, and telecommunications equipment and parts. It operates through the India, and Overseas segments.
Redington Ltd. CMP is 193.37. The Negative aspects of the company are MFs decreased their shareholding last quarter. The positive aspects of the company are Attractive Valuation (P.E. = 12.5), Company with Low Debt, Company with Zero Promoter Pledge, Dividend yield greater than sector dividend yield, High Volume, High Gain and Stocks Outperforming their Industry Price Change in the Quarter.
Entry can be taken after closing above 199 Targets in the stock will be 204, 212 and 220. The long-term target in the stock will be 225 and 236. Stop loss in the stock should be maintained at Closing below 180 or 169. depending upon your risk taking ability.
Disclaimer: The above information is provided for educational purpose, analysis and paper trading only. Please don't treat this as a buy or sell recommendation for the stock. We do not guarantee any success in highly volatile market or otherwise. Stock market investment is subject to market risks which include global and regional risks. We will not be responsible for any Profit or loss that may occur due to any financial decision taken based on any data provided in this message.

Volume Breakout - Swing TradeDisclaimer: I am not a Sebi registered adviser.
This Idea is publish purely for educational purpose only before investing in any stocks please take advise from your financial adviser.
Volume Breakout. Stock has give Breakout with Volume. Keep in watch list. Buy above the high. Suitable for Swing Trade. Stop loss & Target Shown on Chart. Exit With in 15 Days, whether Target / Stop loss Hit or Not.
Be Discipline because discipline is the Key to Success in the STOCK Market.
Trade What you see not what you Think.
Note: Entry above High Only as shown on Chart as it is the confirmation of Trend Continuation

REDINGTON--ACCUMULATEWe are major support and downtrend might get arrested here . Technically end of 4th wave in sight. high EPS of 15rs , intrinsic value 254 low PE of 10.6 .Low Risk High Return stock

SWING IDEA - REDINGTON LTDA potential swing trade opportunity in Redington Ltd , a leading distributor of technology products and supply chain solutions.
Reasons are listed below :
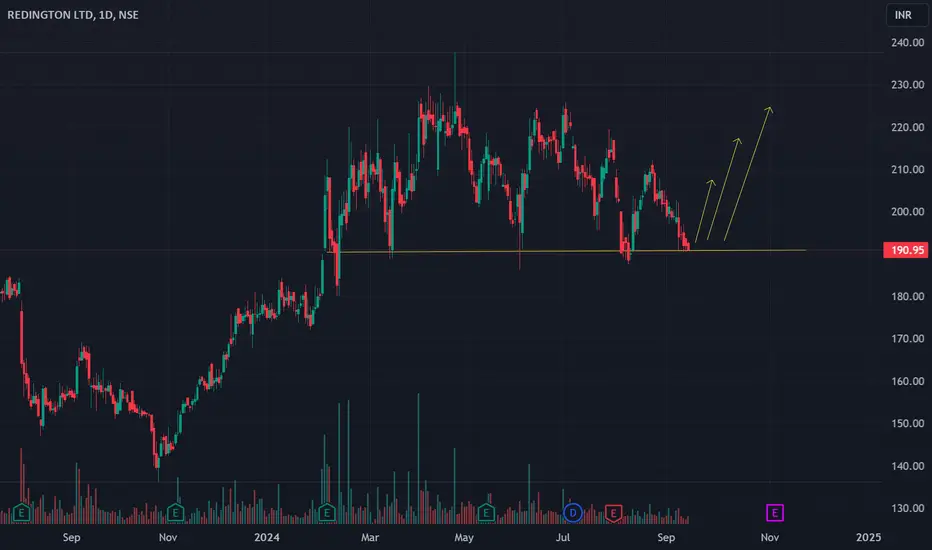
The stock has broken above a significant resistance zone of 180-190, and it has successfully retested this level, indicating potential upward momentum.
Redington Ltd recently broke out of an ascending triangle pattern, suggesting a bullish continuation pattern.
A hammer candlestick has formed on the weekly timeframe, indicating potential bullish reversal sentiment among traders.
The stock found support at the 0.382 Fibonacci level, adding further confirmation to the bullish outlook.
Redington Ltd has broken out of a 3-year consolidation phase, signaling a potential shift in long-term trend direction.
The stock has been forming constant higher highs, indicating a consistent uptrend.
Redington Ltd is currently trading above both the 50 and 200 EMA on the weekly timeframe, suggesting sustained bullish momentum.
Increased trading volumes have accompanied the recent price movements, validating the strength of the breakout.
Target - 242 // 288
StopLoss - weekly close below 187
DISCLAIMER -
Decisions to buy, sell, hold or trade in securities, commodities and other investments involve risk and are best made based on the advice of qualified financial professionals. Any trading in securities or other investments involves a risk of substantial losses. The practice of "Day Trading" involves particularly high risks and can cause you to lose substantial sums of money. Before undertaking any trading program, you should consult a qualified financial professional. Please consider carefully whether such trading is suitable for you in light of your financial condition and ability to bear financial risks. Under no circumstances shall we be liable for any loss or damage you or anyone else incurs as a result of any trading or investment activity that you or anyone else engages in based on any information or material you receive through TradingView or our services.
@visionary.growth.insights

REDINGTON INDIARedington india, its a falling stock in downtrend, but for short term it will touch in two steps towords our target, so watch it, the move will be fast n u will get good profits fast too, risk hain toh ishq hain, but after achieving our targets stock will fall

REDINGTON INDIA A GOOD SWING TRADING IDEAThe stock price is at support levels. Stock has seen taking support at these levels multiple times in the past. RSI is at comfortable levels.
SHORT REDINGTON100 Week EMA got tested very brutally.
On the daily chart, price action is weak, expect levels to be 140 in a week or two.
Fundamentally company looks good!
*Educational Purpose*

Redington (india) LimitedNext Big move on Redington (india) Limited
Price could move to order block before falling down to a key level as depicted on the char. Please refer chart for more details.

Redington (india) LimitedNext Big move on Redington (india) Limited
Price could move to order block before falling down to a key level as depicted on the char. Please refer chart for more details.


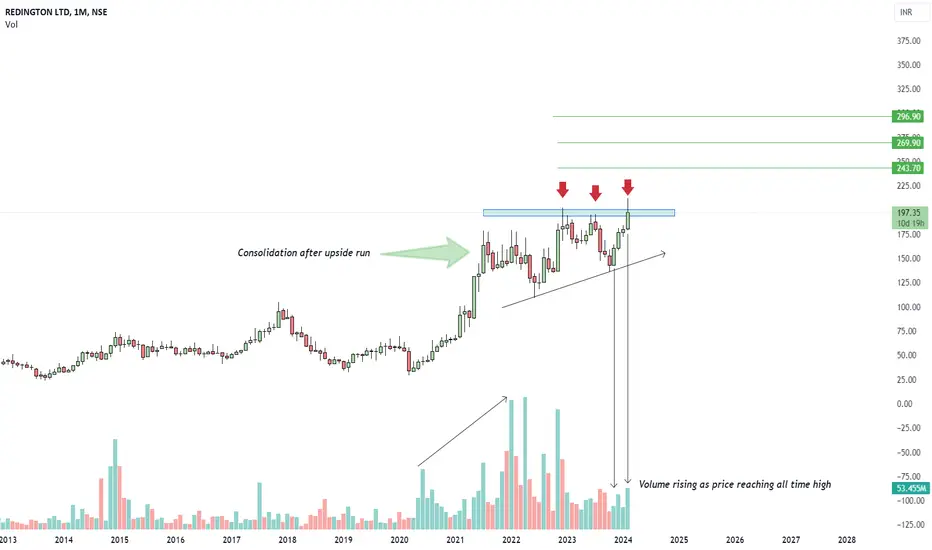
REDINGTONChart pattern - Ascending Triangle Pattern
Volume Understanding - As price is increasing upside volume also increasing, that concludes the sign of bullish run
Price is trading near all time high with higher high higher lows
Time frame - Monthly
Flag Pattern (smaller Flag Patter)3 Years consolidation in one range, and breakout and made smaller flag patter breakout,
upto 6% Sl
