REDINGTON INDIA LTDThis chart is only for educational purposes and should not be considered for doing any buying and selling in this stock.
REDINGTON trade ideas

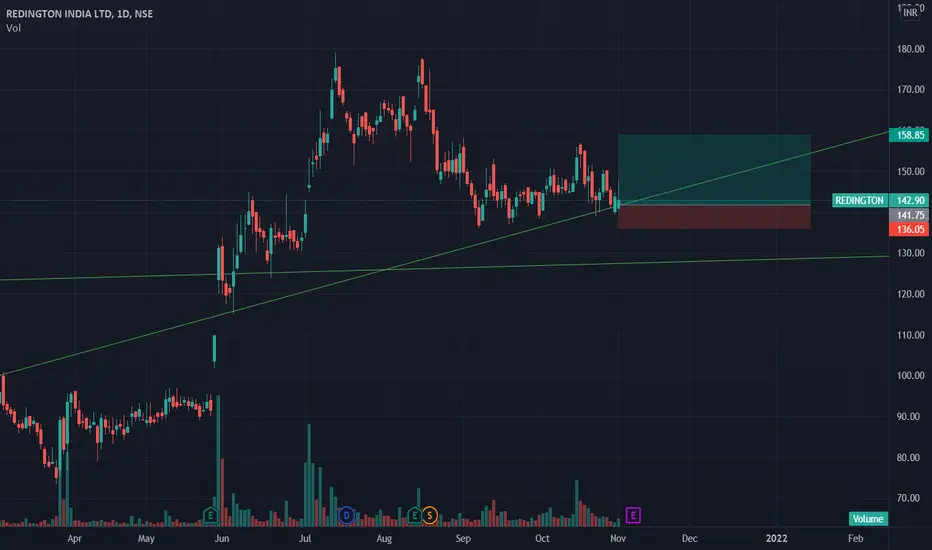
Redington Retest ReversalThe stock has reached lower trendline and may undergo a reversal rally. Trade is supported by brokerage calls and Supports Nearby.
Risk Reward Ratio - 3:1
SL is placed below support zone & the lower trendline. The target is placed near resistance.
Redington is trending 200 EMA and will bounce backRedington is trending 200 EMA and will bounce back

Redington - perfect for swing tradeIt has reached to the bottom and ready to move in 150 trajectory next week.

REDINGTON INDIA LTDThis chart is only for educational purposes and should not be considered for doing any buying and selling in this stock.

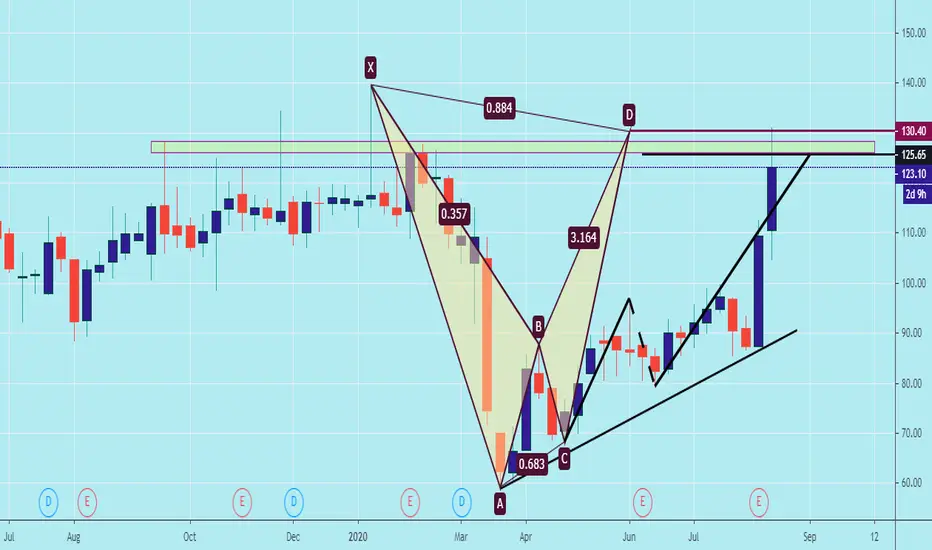
#redington bearish butterflybearish butterfly harmonic pattern
prz1 164.12
prz2 164.3015
prz3 162.6835

Redington - Channel Breakout - BullishRedington - Channel Breakout - Bullish; Plan your trade/investment.

#RedingtonGreat buying opportunity in the counter.
Buy Zone: 130-140
SL: 120
T1: 190, then ATH
Time horizon: 3-6 months

BUY : Redington IndiaABove the high of the box , with volumes coming in , stock will soon make new All Time Highs, and can reach levels of 400 as the stock is showing immense strength.

REDINGTON INDIA LTDThis chart is only for educational purposes and should not be considered for doing any buying and selling in this stock.

Big moveRedington formed a triangle pattern some time ago...and the BO was with a gap up and now it has reached 274...from 193 to 274...which is big
Target 1 - 244
target 2 - 277

Redington India LtdThis chart is only for educational purposes and should not be considered for doing any buying and selling in this stock.

Crazy move..breakout from trangle patternIn 2 sessions redington has made a monumental move...breakout from triangle and kept moving up
Targets mentioned...today's upper circuit is 263.5


RedigntonRedington given Good Breakout,
Now add this stock fore Positional .
add 220/197 we seen 255/288/333/377+
view invalid below 155 wcb.
Disclaimer : All views are education purpose only.


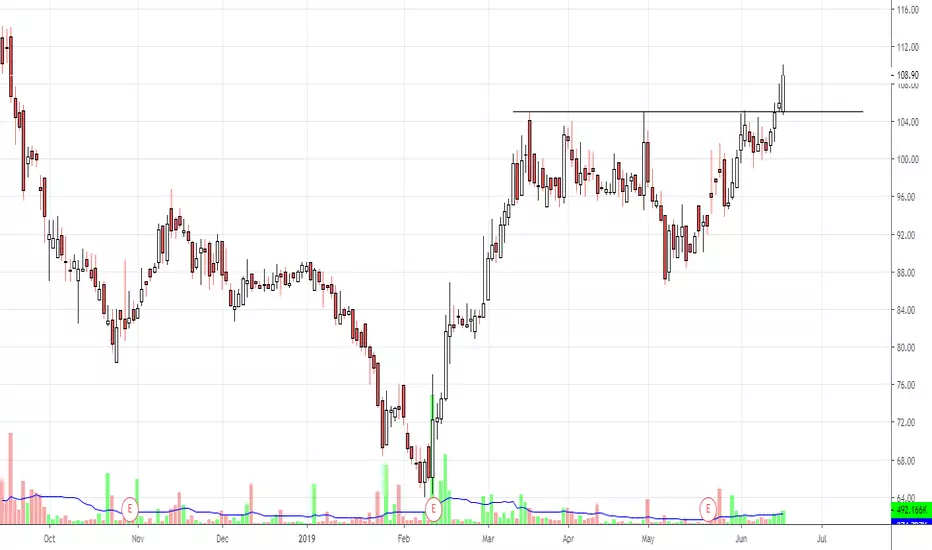
ascending wedge pattern indicating bearish movementBy technical analysis ascending wedge with contionue previous downtrend formed indicating bearish movement
wait for breakout confirm by increasing volume, short with stoploss at 96.75 , targetprice at support zone.
Further if it breaks upwards target price should be 131.00 and stop loss at supprot on trend line.
MACD indicates continuous trend upwards i.e from april to july session. While rising wedge indicates downtrend.
overall wait for breakout