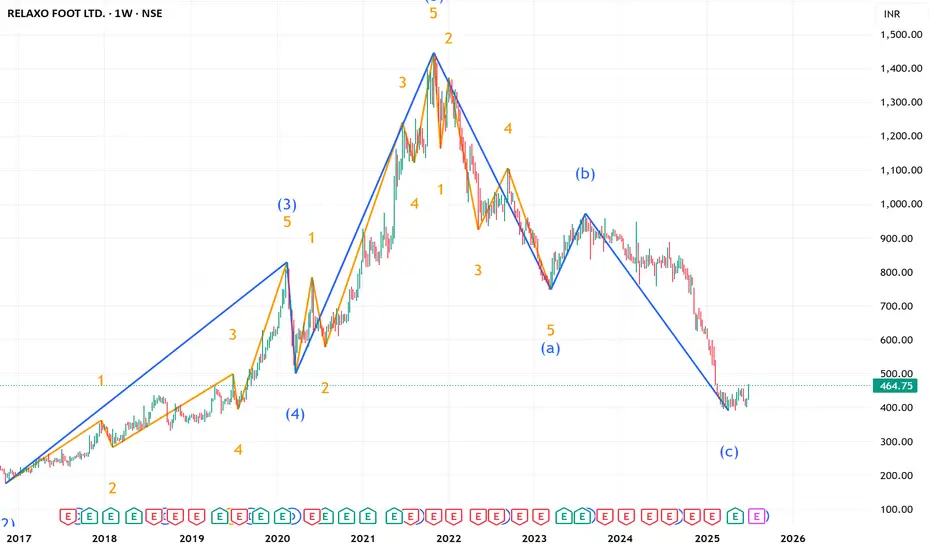
RELAXO ---Ready For UP SIDE---- ( LONG TERM Investment ) RELAXO Weekly counts indicate a Excellent bullish wave structure.
Both appear to be optimistic and this stock invalidation number 52 week low
target short / long term are already shared as per charts
correction wave leg seems completed
Investing in declines is a smart move for long-term players.
Buy in DIPS recommended
Long-term investors prepare for strong returns over the next two to five years.
Every graphic used to comprehend & LEARN & understand the theory of Elliot waves, Harmonic waves, Gann Theory, and Time theory
Every chart is for educational purposes.
We have no accountability for your profit or loss.
RELAXO trade ideas
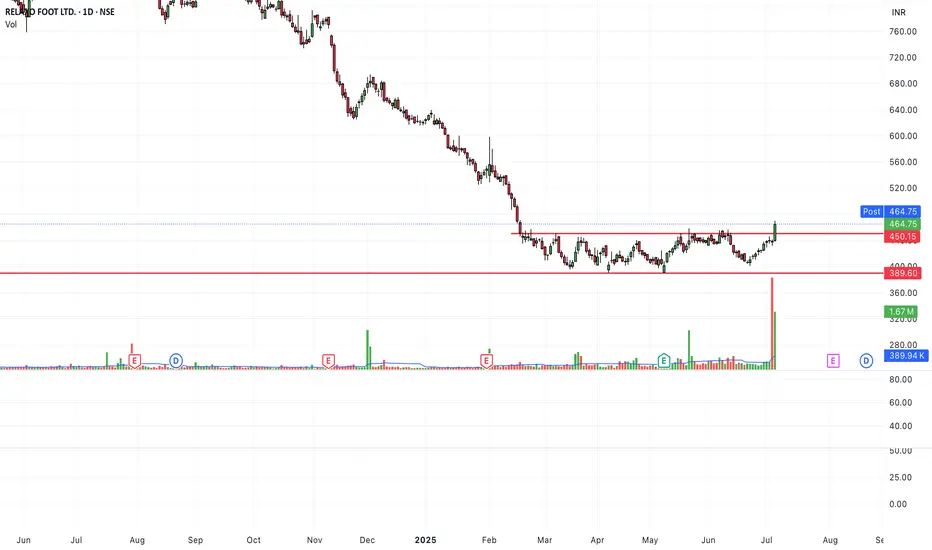
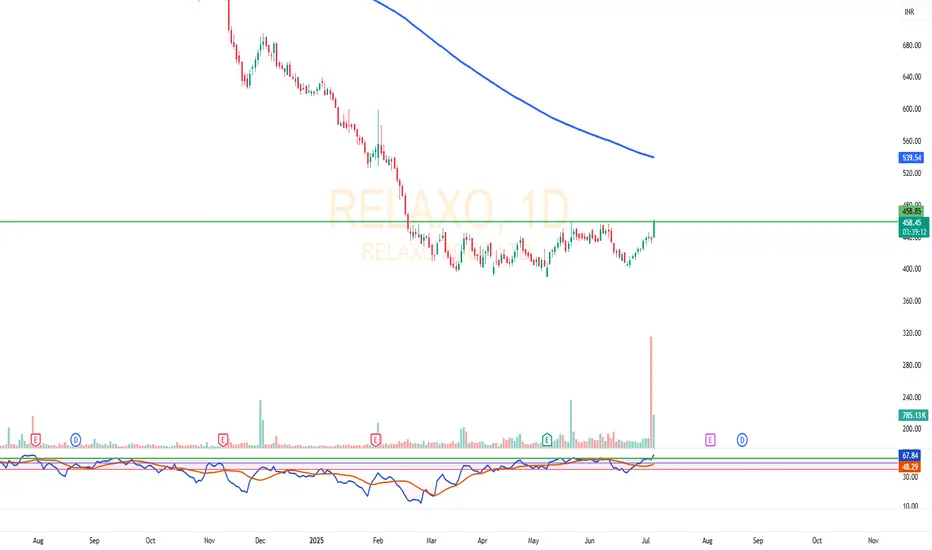
Relaxo Footwears - Breakout from Long Range with Strong VolumeRelaxo Footwears ne daily chart par ₹455 ke aas-paas ek lambi consolidation range (₹370–₹455) se breakout diya hai. Is breakout ke saath significant volume spike bhi dekhne ko mila, jo strong price action ko support karta hai.
🔍 Chart Highlights:
• Price ne multi-month resistance ₹455 ko tod diya hai
• Volume breakout ke din highest in recent months
• RSI indicator 60 ke upar cross kar chuka hai — bullish momentum
• 200 EMA approx ₹539 par hai — potential resistance
📊 Interpretation (Educational Purpose Only):
Ye breakout strong price structure aur buying interest ko reflect karta hai. Agar price is level ke upar sustain karta hai, to momentum continuation ki sambhavna ho sakti hai. 200 EMA agla key level hai jahan price reaction de sakta hai.
⸻
⚠️ Disclaimer:
I am not a SEBI registered advisor. This chart analysis is for educational and informational purposes only. It should not be considered as investment advice. Please consult a certified financial advisor before making any trading decisions.
Weekly Relaxo long Sound fundamentally.
One of the leaders in segment.
Technically at strong support and green volume increases.
Good opportunity for long to have a good return from medium to long term.

RELAXO FOOTWEARS HAVE A STRONG GROUND SUPPORT...NSE:RELAXO trade at 820 level. Stocks take a multiple support at 750-780 range. You can watch for an Upside move at 980 level...

Relaxo Foot LTD Relaxo Monthly Chart Descending Triangle froming & Bullish Marubozu Pattern any time 1target 956 , 2target 1218 & 3target 1450....

Downtrend came to an end?Relaxo at 850 has high probability for reversal. 30% ROI is expected if you hold for next 6 months. For long term investment also it looks good.

Downtrend came to an end?Relaxo at 850 has high probability for reversal. 30% ROI is expected if you hold for next 6 months. For long term investment also it looks good.

go long - swing pick- this stock shows signficant delivery percentage value
- possible chances for accumulation
- may perform good in upcoming days
- this stock is picked after market close based on delivery qty data.
- follow this stock for next 5 days , if entry not triggered with in 5 days , ignore pick
- line marked in chart is the day it showed huge delivery percentage.it means , i consider it as signal candle.i marked its high and low
entry
- go long with 1:1.5 RR
- take entry if 15min close crosses the line , ignore entry if it made gap ups
- i prefer entry with in 5 days , if not triggered ignore this pick
sl
- candle close below signal candle's low
target
- keep 1.5 times of sl.

RELAXOHi guys,
In this chart i Found a Demand Zone in RELAXO CHART for Positional entry,
Observed these Levels based on price action and Demand & Supply.
*Don't Take any trades based on this Picture.
... because this chart is for educational purpose only not for Buy or Sell Recommendation..
Thank you

Relaxzo is one my stock did not fair well lately. maybe now?I have changed some of plan to this stock. I guess it will perform this time well.

Relaxo is on long term support demand zone with low RRdaily time frame has positive RSI divergens,
Weekly CPR is tight sign of breakout
triangle formed on monthly, weekly, daily tiem frame stock at the consoludation at the trendline this time is good for 1:9 RR

Relaxo Industries | Elliott Wave Counts #Elliott #Wave #Analysis of #Relaxo Industries Ltd.:
I hope this message finds you well. I would like to share with you a technical analysis of Relaxo Industries, shedding light on recent market movements and potential future trends. Please note that I am not a SEBI registered analyst, and it is advisable to consult with a certified financial professional for any investment decisions.
Analysis of Relaxo Industries:
Relaxo Industries reached its all-time high (ATH) at Rs. 1440.45 in November 2021, completing its minor degree wave 1. Subsequently, the price has been retracing for its wave 2 correction, finding support near the 50% retracement zone. This retracement appears to be a valid move for wave 2, and current counts suggest that wave 2 has completed.
Furthermore, the analysis indicates that we have concluded wave (i) of minute degree and are presently in wave 2 of minute degree within the minor degree wave 3. This suggests a potential continuation of the bullish trend.
It is essential to monitor the price action closely, as this analysis will be invalidated if the price drops below the Rs. 750 level. Caution and diligence are always paramount in the dynamic landscape of the stock market.
Please remember that this analysis is based on technical indicators and patterns, and there are inherent risks associated with trading and investing. The future performance of Relaxo Industries may vary, and it's crucial to stay informed and seek advice from qualified financial professionals.

NSE:Relaxo 👟👠👢 can it walk or run..
Relaxo Footwears Limited manufactures and sells footwear for men, women, and kids in India and internationally. It offers casual, running, athleisure, walking, formal, sports, school, and training and gym shoes. The company also provides slippers, sandals, flip flops, slides, chappals, casuals, belles, and clogs. In addition, it offers footwear accessories. The company provides its products under the Relaxo, Bahamas, Flite, Sparx, BOSTON, and Mary Jane brands. It sells its products through 394 exclusive brand outlets; and e-commerce portals. Relaxo Footwears Limited was founded in 1976 and is based in New Delhi, India.

check this out to understand market structure THIS IS USLESS DONT READ THIS
Technical analysis is a method used in finance and trading to evaluate and forecast the future price movements of financial assets, such as stocks, currencies, commodities, or cryptocurrencies. It relies on the analysis of historical price charts and trading volumes to make predictions about future price movements. Here's a brief overview of technical analysis:
1. Price Patterns: Technical analysts study various price patterns that occur over time, such as head and shoulders, flags, pennants, and triangles. These patterns can provide insights into potential future price movements.
2. Moving Averages: Moving averages are commonly used in technical analysis to smooth out price data and identify trends. Two types of moving averages, simple and exponential, are often employed to assess the direction and strength of a trend.
3. Support and Resistance Levels: Analysts identify levels at which an asset's price tends to find support (stops declining) or resistance (stops rising). These levels are significant because they can help traders make decisions about buying or selling.
4. Indicators and Oscillators: Technical analysts use various indicators and oscillators, such as the Relative Strength Index (RSI) and Moving Average Convergence Divergence (MACD), to measure momentum, overbought or oversold conditions, and other aspects of market sentiment.
5. Volume Analysis: Trading volume, or the number of shares or contracts traded, is considered a critical component of technical analysis. It can provide insights into the strength or weakness of a price movement.
6. Trend Analysis: Identifying and following trends is a fundamental aspect of technical analysis. Analysts use trendlines, channels, and other tools to assess the direction and duration of a trend.
7. Chart Patterns: Technical analysts look for chart patterns like head and shoulders, double tops,

RELAXO SWING TRADE sept 10
swing trade perfect symmetrical triangle short term opportunity for upside take trade after breakout from the trendline according to own risk this is not call just a analysis.
when nifty turns bullish take trade

Relaxo...CMP...950...FocusRelaxo
Cmp- 950
Stop- 869
T1- 1500
T2- Open, Review at T1
Expected Holding Period- 9-12 Months
View- Swing/Investment

RELAXO - Bullish ConsolidationNSE: RELAXO is closing with a bullish consolidation candle supported with volumes.
Today's volumes and candlestick formation indicates strong demand and stock should move to previous swing highs in the coming days.
The stock has been moving along the horizontal support for the past few days which is indicating demand.
One can look for a 8% to 12% gain on deployed capital in this swing trade.
The view is to be discarded in the event of the stock breaking previous swing low.
#NSEindia #Trading #StockMarketindia #Tradingview #SwingTrade

Relaxo is nearing the bottom region. Soon to be reversed?Relaxo is nearing the bottom region. Soon to be reversed?

Relaxo footwears view for 22nd Feb Relaxo footwears view for 22nd Feb Wednesday
803 above it may move upside
Charts for Educational purposes only
Please follow strict risk reward and stop loss if you follow my level
Thanks,
V Trade Point

Bullish DIVERGENCE In Relaxo weekly chartAs you see a beautiful setup of market structure is under making a bullish DIVERGENCE in weekly chart . When price if close above 921 then on retest its good swing move seen in this script keep on watchlist. See how price works

BUY RELAXO Relaxo is one of the beaten down candidate from it's sector with on manufacturing unit and a strong customer base, as the demand rebound and the story of India's growth continue to hold and significant upside is open, on the fundamental note the top and bottom line continue to grow at moderate growth rate and there is growth that has to unfold in the coming year the stock is beaten down around 40% from it's high and there is and opportunity to go long on the stock to benefit as there is classic bullish inside candle form on weekly basis and one can go long around the level ofthe upside of inside candle with a stop of .25ATR + low of the same candle.
Happy Investing

