RR KABELAfter months of correction, RR Kabel shows signs of a strong technical reversal! With the stock bouncing off key support and reclaiming ₹1200+, bulls are back in control. Momentum suggests a retest of ₹1310 is on the cards — and maybe even ₹1800 if the breakout holds!
Capex of ₹1,450 Cr, 26% revenue growth, and 64% PAT jump are backing the charts with strong fundamentals!
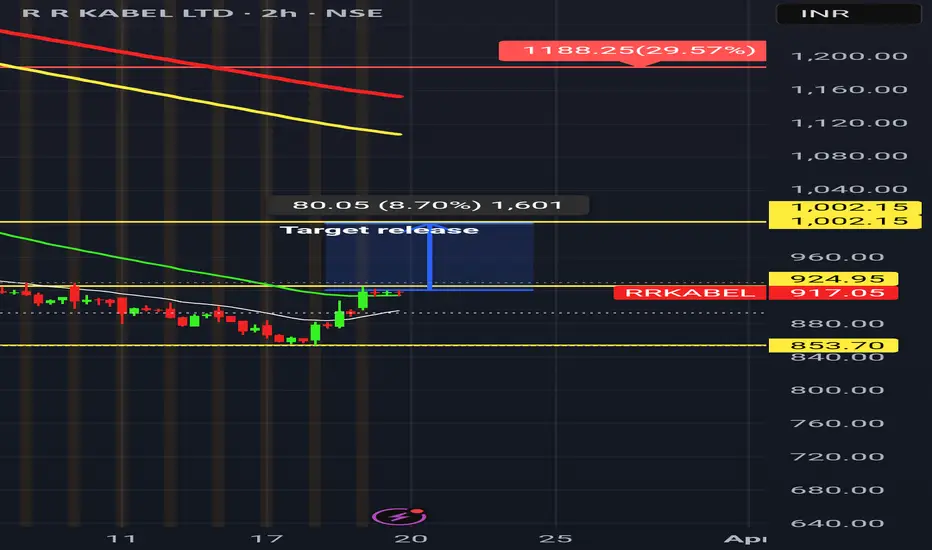
RRKABEL trade ideas

R R KABEL LTD S/R Support and Resistance Levels:
Support Levels: These are price points (green line/shade) where a downward trend may be halted due to a concentration of buying interest. Imagine them as a safety net where buyers step in, preventing further decline.
Resistance Levels: Conversely, resistance levels (red line/shade) are where upward trends might stall due to increased selling interest. They act like a ceiling where sellers come in to push prices down.
Breakouts:
Bullish Breakout: When the price moves above resistance, it often indicates strong buying interest and the potential for a continued uptrend. Traders may view this as a signal to buy or hold.
Bearish Breakout: When the price falls below support, it can signal strong selling interest and the potential for a continued downtrend. Traders might see this as a cue to sell or avoid buying.
MA Ribbon (EMA 20, EMA 50, EMA 100, EMA 200) :
Above EMA: If the stock price is above the EMA, it suggests a potential uptrend or bullish momentum.
Below EMA: If the stock price is below the EMA, it indicates a potential downtrend or bearish momentum.
Trendline: A trendline is a straight line drawn on a chart to represent the general direction of a data point set.
Uptrend Line: Drawn by connecting the lows in an upward trend. Indicates that the price is moving higher over time. Acts as a support level, where prices tend to bounce upward.
Downtrend Line: Drawn by connecting the highs in a downward trend. Indicates that the price is moving lower over time. It acts as a resistance level, where prices tend to drop.
Disclaimer:
I am not a SEBI registered. The information provided here is for learning purposes only and should not be interpreted as financial advice. Consider the broader market context and consult with a qualified financial advisor before making investment decisions.

Review and plan for 5th May 2025Nifty future and banknifty future analysis and intraday plan.
Quartely results.
This video is for information/education purpose only. you are 100% responsible for any actions you take by reading/viewing this post.
please consult your financial advisor before taking any action.
----Vinaykumar hiremath, CMT

Better stock fundamental strong bye Bad News is down but is marked
Bull run chanse to up side minimum 10% Bye stock
RRKABEL: Unlocking Potential with Key Fibonacci Levels!Technical Observations:
Pattern Identified: The stock appears to have completed an extended Corrective C Wave in a larger Elliott Wave framework. The price has retraced to a critical 127% Fibonacci retracement level around ₹1,427 - ₹1,420.
Price Action: Recent candles show a rejection from the extended retracement zone, indicating buying interest and possible demand resurgence.
Buy Zone: ₹1,420 to ₹1,462 (C wave bottom and retracement levels).
Targets:
First Target: ₹1,652 - ₹1,629 (Prior resistance and 50% Fibonacci retracement of the corrective wave).
Second Target: ₹1,862 - ₹1,921 (Upper range derived from Fibonacci extension and historical supply area).
Stop Loss: Below ₹1,371 (To manage risk in case the retracement zone fails).
Learning Points:
Elliott Wave Principle: The corrective C wave typically marks the end of a bearish cycle and the start of a bullish phase when aligned with key Fibonacci levels.
Demand Zone Confirmation: The 127% Fibonacci level often acts as a deep retracement point where demand overtakes supply.
Low-Risk Opportunity: Buying near the C wave lows offers a favorable risk-to-reward ratio, supported by a defined stop loss.
Reason for Action:
Rejection at Key Levels: The bounce from the retracement zone confirms strong demand.
Upside Targets: The targets are aligned with prior resistance and Fibonacci projections, indicating a potential breakout and trend continuation.

$RRKABLEhaving a look for a long term hold ..
come deviate below white line then we run it back
been in this range for a year so nearing time for its next leg up

🔥 Unleash the Bullish Beast: RRKABEL Edition! 🚀Brace yourself for a financial breakthrough with iBull Ventures' latest trade revelation. 📈 RRKABEL is our star pick, boasting a jaw-dropping Risk-Reward ratio of 1:5! 💹💰
🌐 Why we're buzzing about RRKABEL:
🚀 Wired for success in the electrifying tech domain.
💡 Our market crystal ball reveals a journey to amplified returns – your golden ticket to financial euphoria!
📊 Ready to ride the lightning? Uncover the trade secrets and turbocharge your portfolio!
